 By Marcus Reeve
Altcoin Season History and Bitcoin Dominance: Every Altseason Since 2017
Updated October 16, 2026
Is it altcoin season now? No. As of October 16, 2026, the 90-day Altcoin Season Index reads 59 and CoinMarketCap's version reads 60, both in neutral territory and short of the 75 needed for an altcoin season. Bitcoin dominance stands at 59.9% (CoinMarketCap; CoinGecko shows 59.3%) and the ETH/BTC ratio at 0.0298. The last altseason day on record was September 26, 2025, 385 days ago, and the index has not touched 75 since; its 2026 high is 67, reached on August 2.
"Altseason" — the stretch when altcoins outrun Bitcoin and modest bets turn into outsized gains — never arrives on a calendar. It arrives when Bitcoin dominance rolls over. Across every cycle since 2017, the same fingerprint shows up first: Bitcoin leads, dominance peaks, capital rotates down the risk curve, and the broader altcoin market catches fire. Get the rotation right and you front-run the crowd; get it wrong and you bag-hold alts through a dominance grind that bleeds them for months.
This is the complete 2017–2026 reference for reading that rotation: a dated table of every altcoin season on record, what Bitcoin dominance actually measures, every major peak and trough, how ETH/BTC behaved inside each window, what happened in the 90 days after each one ended, and the three signals that have marked the start of every altseason so far. We close with why the 2024–2026 ETF era partly broke the old playbook — the single most important nuance for timing alts today.
Altcoin Season History: Every Altseason Since 2017
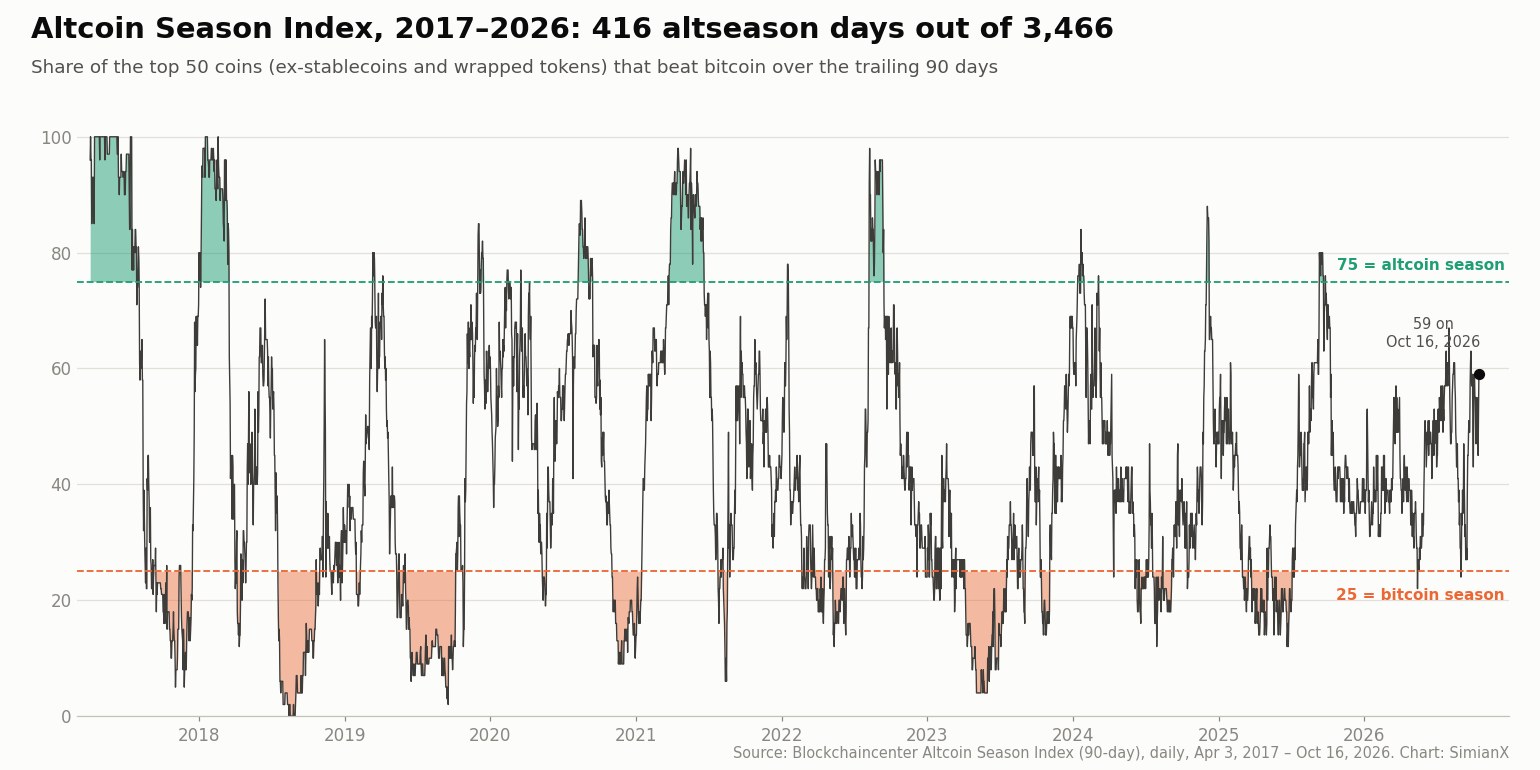
"Altcoin season" needs a definition before it can have a history, so this page uses the most widely cited one. The Blockchaincenter Altcoin Season Index takes the top 50 coins by market capitalization, excludes stablecoins and asset-backed tokens (wrapped bitcoin, liquid-staking receipts), and measures how many of them beat Bitcoin over the trailing 90 days. A reading of 75 or higher — three-quarters of the top 50 outperforming Bitcoin — is "altcoin season"; 25 or lower is "Bitcoin season"; everything in between is neutral. CoinMarketCap publishes a similar index on its top 100 coins with the same 90-day window and 75 threshold.
Method. We read the Blockchaincenter 90-day index day by day from its first value (April 3, 2017) to October 16, 2026 — 3,466 daily readings. A "window" below is a run of days at 75 or higher, with gaps of five days or fewer merged into one window. Bitcoin dominance comes from CoinMarketCap's daily historical global metrics, ETH/BTC from daily closes on Bitfinex, and the "90 days later" column compares each window's last day with the reading 90 calendar days afterwards.
The altcoin season reference table
| # | Window | Altseason days | Peak index | BTC dominance, start → end (low) | ETH/BTC, start → end | Backdrop | 90 days after the window |
|---|---|---|---|---|---|---|---|
| 1 | Apr 3 – Aug 3, 2017* | 120 | 100 | 64.7% → 44.5% (37.6%, Jun 20) | 0.0382 → 0.0806 | ICO boom on Ethereum | BTC.D back up to 58.7%; ETH/BTC 0.0428; BTC $2,790 → $6,740 |
| 2 | Jan 1 – Mar 17, 2018 | 75 | 100 | 38.6% → 42.7% (32.4%, Jan 14) | 0.0563 → 0.0698 | Alt blow-off after Bitcoin's Dec 2017 top | Total market cap $330B → $289B; bear market deepens |
| 3 | Aug 9 – Sep 14, 2020 | 33 | 89 | 60.6% → 56.7% (56.1%) | 0.0334 → 0.0353 | "DeFi summer" yield farming | BTC.D up to 63.5%; BTC $10,690 → $19,180 led the next leg |
| 4 | Mar 23 – Jun 20, 2021 | 89 | 98 | 59.8% → 45.1% (39.3%, May 19) | 0.0307 → 0.0631 | ETH-led rotation after Bitcoin's new highs | BTC.D 42.2%; total market cap $1.48T → $2.11T |
| 5 | Aug 9 – Sep 14, 2022 | 37 | 98 | 40.5% → 39.1% (37.7%, Sep 9) | 0.0735 → 0.0809 | Run-up to Ethereum's Merge (Sep 15) | Total market cap $988B → $851B as FTX collapsed |
| 6 | Jan 14 – 29, 2024 | 13 | 84 | 49.7% → 50.9% (49.6%) | 0.0592 → 0.0535 | Q4 2023 alt rally runs into the ETF launch | BTC.D 53.0%; BTC $43,309 → $63,216 |
| 7 | Dec 2 – 8, 2024 | 7 | 88 | 55.5% → 54.2% (53.9%) | 0.0380 → 0.0396 | Post-election alt spike | BTC.D 60.4%; ETH/BTC 0.0256; total market cap −22% |
| 8 | Sep 11 – 26, 2025 | 12 | 80 | 57.6% → 58.3% (56.7%, Sep 14) | 0.0386 → 0.0368 | Alt rally around the Fed's Sep 17 rate cut | BTC.D 59.1%; total market cap $3.72T → $2.96T |
\The index begins on April 3, 2017, so the first window may have started earlier. Altseason days = days with the index at 75 or higher inside the window. Dominance is Bitcoin's share of total crypto market capitalization, stablecoins included.*
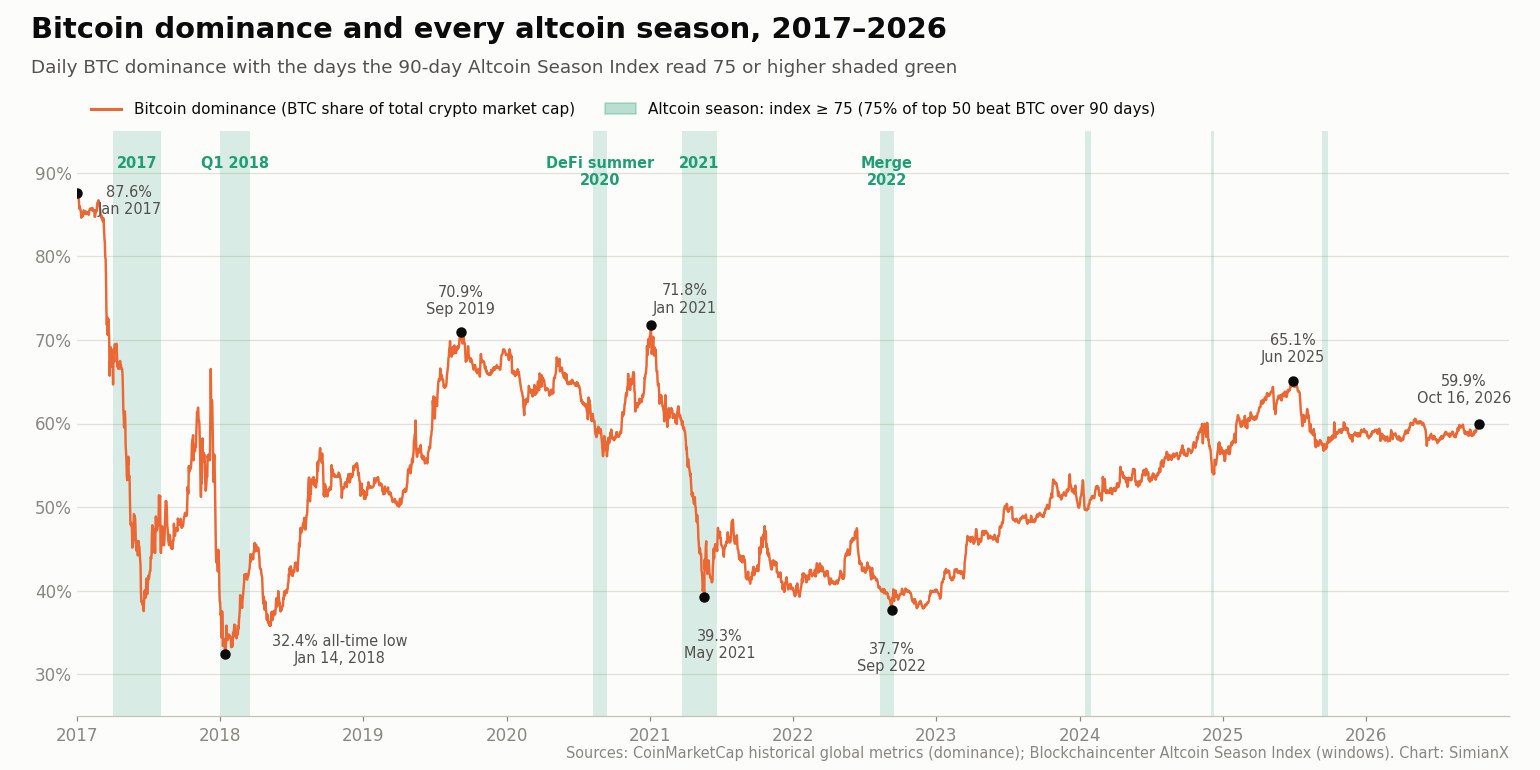
Outside those eight windows, the index only blinked above 75 a handful of times — five days in March 2019, one in April 2019, eleven in December 2019, seven in February 2020 and two single days in March and April 2020 — none of which grew into a broad rotation.
What nine years of altseason data show
- Altseason is rare. The index spent 416 of 3,466 days (12%) at 75 or higher, against 956 days (28%) in Bitcoin season. The other 60% of the time was neutral.
- Most windows are short. The longest unbroken run was 117 days in 2017 and the second longest 88 days in 2021. The average run lasted about 17 days, and the three windows since 2024 added up to just 32 days.
- The big ones came with a new Ethereum narrative. The two monster windows (2017 and 2021) saw ETH/BTC roughly double inside the window. In the three most recent windows ETH/BTC rose by less than 5% or fell.
- What follows is usually a hangover. Bitcoin dominance was higher 90 days after the window ended in 5 of 8 cases, and the total crypto market was smaller 90 days later after each of the last two windows (December 2024 and September 2025).
What Is Bitcoin Dominance (BTC.D)?
Bitcoin dominance is simply Bitcoin's share of the total crypto market capitalization:
BTC.D = Bitcoin market cap ÷ total crypto market cap × 100
If the entire crypto market is worth $3 trillion and Bitcoin accounts for $1.8 trillion of it, dominance is 60%. The metric does not tell you whether prices are rising or falling — it tells you where the money is concentrated. That is the whole point. A falling BTC.D while total market cap rises means capital is flowing out of Bitcoin and into altcoins faster than into Bitcoin — the textbook definition of altseason.
One caveat matters for anyone comparing readings across years: the denominator includes stablecoins. When stablecoin supply grows faster than the rest of the market, dominance drifts lower without a single altcoin outperforming Bitcoin. That is why the Altcoin Season Index, which compares coins directly against Bitcoin and excludes stablecoins, is the better yardstick for "is it altseason", while dominance is the better yardstick for "where is the money".
Two cousins matter just as much:
- ETH/BTC ratio — Ethereum priced in Bitcoin. Ethereum is the bellwether alt; when ETH/BTC turns up, it is usually the first leg of a broad rotation.
- Stablecoin dominance (USDT.D + USDC.D) — the "dry powder" gauge. When stablecoin dominance falls at the same time as BTC.D, sidelined cash is buying risk assets. When it rises, the market is de-risking into cash.
Read all three together and you have a far cleaner picture than price alone. A useful primer on the underlying math lives on Investopedia, but the cycle behavior below is where the edge is.
The Altseason Rotation Sequence
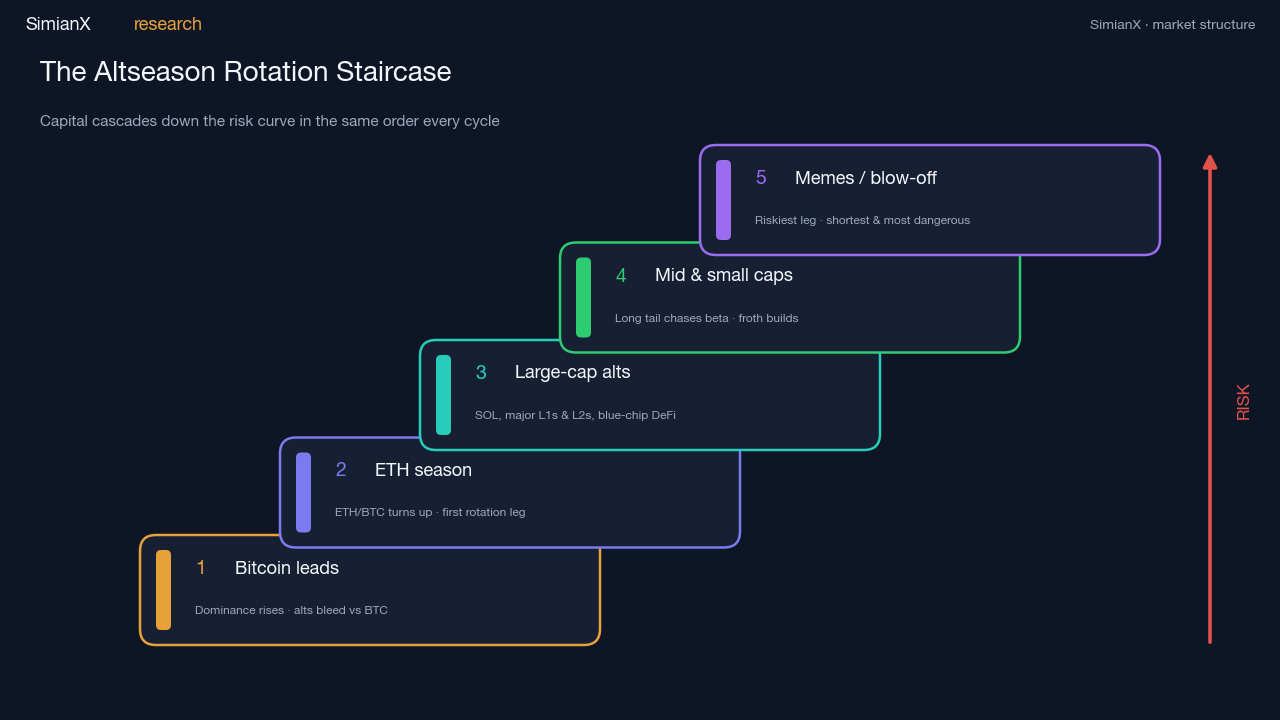
Every altseason since 2017 has followed roughly the same capital-flow staircase. Money does not hit the whole market at once — it cascades down the risk curve in a predictable order:
- Bitcoin leads. A new BTC rally pulls capital in first. Dominance rises. Alts bleed against BTC. This is the part newcomers hate and veterans accumulate into.
- Bitcoin consolidates at a high. Holders sitting on large BTC gains start hunting for higher beta. ETH/BTC turns up — "ETH season" begins.
- Large-cap alts run. Capital rotates from ETH into the next tier — Solana, major L1s and L2s, blue-chip DeFi.
- Mid- and small-caps run. As large-cap gains feel "expensive," money chases the long tail — mid-caps, then small-caps, then memecoins. This final, frothy leg is what most people call altseason, and it is historically the shortest and most dangerous.
- Dominance bottoms, rotation exhausts. When the riskiest assets are ripping and there is no lower tier left to rotate into, the music stops. BTC.D bottoms and the cycle's air comes out of alts first.
The single biggest timing mistake is buying small-caps in step 1. The second biggest is still holding them in step 5.
Every Bitcoin Dominance Cycle, 2017–2026
Here is the reference table of the major dominance turning points, read from CoinMarketCap's daily series. Each figure is the daily reading on the date shown.
| Date | BTC.D | What was happening | Altseason signal |
|---|---|---|---|
| Jan 2, 2017 | 87.6% | Pre-ICO market, alts negligible | Dormant |
| Jun 20, 2017 | 37.6% | First ICO mania leg | Altseason ON (window 1) |
| Jan 14, 2018 | 32.4% | All-time low; ICO blow-off top | Peak altseason / top (window 2) |
| Sep 6, 2019 | 70.9% | Deep bear, alts crushed vs BTC | Dormant |
| Sep 13, 2020 | 56.1% | DeFi summer peak | Short altseason (window 3) |
| Jan 3, 2021 | 71.8% | BTC breaks its 2017 high first | BTC-led, alts waiting |
| May 19, 2021 | 39.3% | ETH and L1 mania, then the May crash | Peak altseason (window 4) |
| Dec 9, 2021 | 39.8% | Cycle top for alts, SOL/AVAX run | Late-cycle rotation |
| Jun 12, 2022 | 47.5% | Terra/Luna and 3AC collapse, alts die hardest | De-risk to BTC |
| Sep 9, 2022 | 37.7% | Lowest since 2018, Merge run-up | Bear-market altseason (window 5) |
| Dec 7, 2023 | 53.9% | Spot-ETF anticipation, BTC leads | BTC-led |
| Jan 19, 2024 | 49.6% | ETF launch week dip in dominance | Brief altseason (window 6) |
| Nov 21, 2024 | 60.1% | ETF era, ETH/BTC near multi-year lows | Dominance grind UP |
| Jun 27, 2025 | 65.1% | Highest since January 2021 | Bitcoin season |
| Sep 14, 2025 | 56.7% | ETH rally peaks, then fades | Brief altseason (window 8) |
| Oct 16, 2026 | 59.9% | Range of 57.3%–60.6% all year | Neutral |
Read the table top to bottom and one rhythm jumps out: dominance peaks coincide with dormant alts; dominance troughs coincide with altseason tops. The 32.4% print in January 2018 and the 39.3% and 39.8% prints of May and December 2021 each marked the end of the party, not the beginning. The beginning was always months earlier, when dominance first rolled over from a high.
Note the anomaly in mid-2022: dominance actually rose to 47.5% as the market crashed, because Terra/Luna, 3AC and FTX vaporized altcoin value faster than Bitcoin's. Dominance up does not always mean "BTC strong" — sometimes it means "alts dying." Always check it against total market cap.
ETH/BTC in Every Altseason
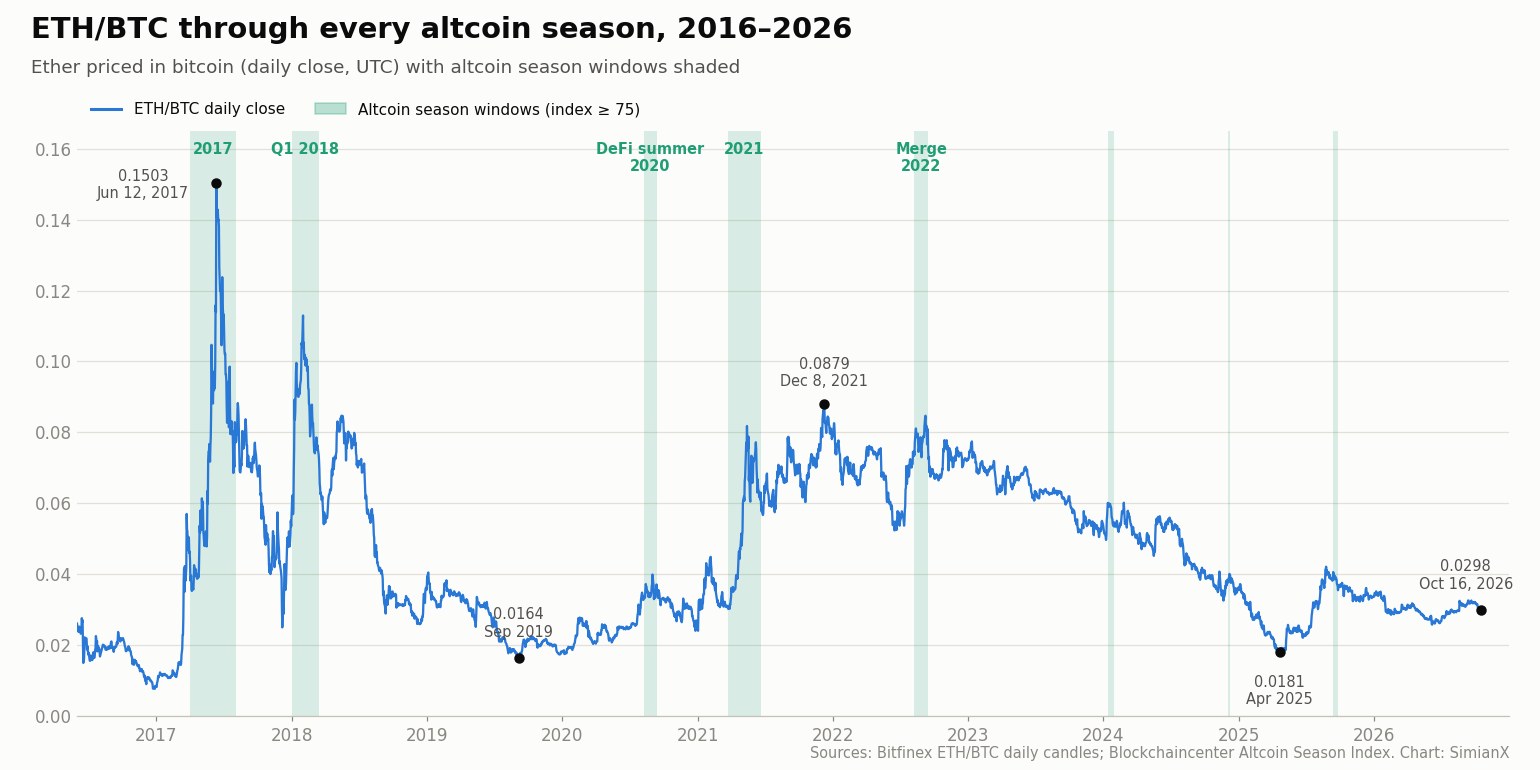
Ethereum has been the gateway asset for every rotation, and the ratio's behavior separates the big altseasons from the small ones. In 2017, ETH/BTC ran from 0.0382 to an all-time high of 0.1503 on June 12, 2017; in 2021 it doubled from 0.0307 to 0.0631 inside the window and peaked at 0.0879 on December 8, 2021. Those were the two longest windows on record.
The ratio rose in the 90 days before 6 of the 8 windows. The two exceptions are telling: Q1 2018 was a late blow-off after Bitcoin had already topped in December 2017, and December 2024 lasted only seven days. Across the decade the ratio made two deep lows — 0.0164 in September 2019 and 0.0181 in April 2025 — and stands at 0.0298 today, far below the levels that accompanied the long altseasons. The full cycle-by-cycle breakdown lives in our ETH/BTC ratio history.
The Three Signals That Mark Altseason's Start
You cannot trade a table of dates. What you can trade is the live confluence of three signals, all of which have preceded every genuine altseason:
1. Bitcoin dominance breaks its uptrend. Not a single red day — a structural rollover. BTC.D putting in a lower high after a sustained climb, then losing a multi-week trendline, is the classic trigger. In 2020 it broke down through ~67%; in early 2021 the breakdown accelerated the May melt-up. In all eight windows dominance was lower on the first altseason day than 90 days earlier — partly by construction, since the index itself measures 90-day outperformance, but the drop was large before the two biggest windows (87.6% to 64.7% in 2017, 67.0% to 59.8% in 2021).
2. ETH/BTC turns up and holds. Ethereum is the gateway. A multi-week base in ETH/BTC that resolves higher has front-run every broad rotation. If ETH cannot outperform BTC, the lower-tier alts almost never sustain a run — they are higher-beta bets on the same rotation ETH leads.
3. Stablecoin dominance falls alongside BTC.D. This is the confirmation most people miss. When both Bitcoin dominance and stablecoin dominance decline together, it means sidelined cash is buying altcoins directly — the purest fuel for altseason. If BTC.D falls but stablecoin dominance rises, the "rotation" is really a flight to safety, and any alt bounce tends to fail.
The widely-watched Altcoin Season Index formalizes the payoff: it flags "altcoin season" when 75% of the top 50 coins outperform Bitcoin over 90 days. But by the time that index lights up green, steps 1–3 above already fired weeks earlier. The signals lead; the index confirms.
What Happened After Every Altseason
The "90 days after" column of the reference table is the part most altseason guides leave out. Three patterns stand out:
- Bitcoin usually took the lead back. Dominance was higher 90 days after the window ended in 2017 (44.5% to 58.7%), 2020, January 2024, December 2024 and September 2025. It kept falling only after 2018 and 2021, and stayed flat after 2022.
- ETH/BTC gave back ground after six of the eight windows, most sharply after December 2024 (0.0396 to 0.0256).
- Late-cycle windows ended badly for the whole market. The total crypto market cap was lower 90 days later after 2018, 2022, December 2024 and September 2025 — four of eight — with the last two shrinking by more than 20%.
The practical reading: an altseason is a phase to harvest, not a regime to settle into. The windows that kept running (2017 into early 2018, 2021 into the autumn) were the exception, and both came with a fresh narrative pulling new money into Ethereum.
Why the 2024–2026 Cycle Broke the Old Playbook
If you ran the classic altseason playbook in 2024–2025, it mostly did not work — and understanding why is the most valuable thing in this article.
The spot Bitcoin ETFs that launched in January 2024 changed who the marginal buyer is. Retail in 2017 and 2021 bought on exchanges and rotated profits down the risk curve into ever-smaller alts. Institutional ETF flows in 2024–2026 do the opposite: they concentrate in Bitcoin (and, to a lesser degree, ETH via its own ETF) and do not rotate into small-cap altcoins at all. A pension allocator buying an IBIT-style product is not going to wake up and buy a microcap memecoin.
The result: Bitcoin dominance ground higher through much of 2024–2025 even as total market cap recovered, peaking at 65.1% in June 2025, while ETH/BTC sank to 0.0181 in April 2025 and "altseason" kept being declared and then fizzling. The three index windows of this era lasted 13, 7 and 12 days. The rotation still happened — but it stopped much higher up the quality curve. Capital reached ETH and a handful of large-cap L1s and stalled, rather than cascading all the way to the long tail like it did in 2018 and 2021.
The practical takeaway for 2026: the rotation sequence still holds, but it is shallower and more selective. Expect strength to concentrate in Bitcoin, Ethereum, and a short list of large-cap, narrative-backed alts — and be far more skeptical of the "everything pumps" small-cap blow-off that defined prior cycles. Quality dominance over indiscriminate beta.
How to Track Altseason in Real Time
The hard part is not knowing the signals — it is watching them across 30+ assets, 24/7, without staring at charts all day. That is exactly what SimianX is built for. The crypto leaderboard ranks live AI-model conviction across the major coins, so you can see where multi-model agreement is rotating before the move is obvious on a single dominance chart. When the leaders shift from BTC toward ETH and large-cap L1s, that is your rotation staircase playing out in real time.
For hands-off execution, autopilots let AI agents act on those rotation signals around the clock instead of you trying to catch a 3 a.m. dominance breakdown. And the live AI trading sessions show how the models reason through exactly this kind of regime shift — BTC-led versus alt-led — as it happens.
Pair the three signals above with live multi-model coverage and you stop guessing when altseason starts and start seeing it begin.
Frequently Asked Questions
Is it altcoin season now?
No. On October 16, 2026 the 90-day Altcoin Season Index stood at 59 (Blockchaincenter) and 60 (CoinMarketCap), below the 75 that defines altcoin season. Bitcoin dominance is 59.9% and ETH/BTC is 0.0298. The last altseason day was September 26, 2025, and the index's 2026 high is 67 (August 2). This answer is refreshed each time the page is updated.
What is the Altcoin Season Index?
It is the share of the top 50 coins, excluding stablecoins and asset-backed tokens, that outperformed Bitcoin over the past 90 days. A reading of 75 or more means altcoin season, 25 or less means Bitcoin season. CoinMarketCap publishes a top-100 version with the same 90-day window and thresholds.
When does altseason usually start?
Historically, weeks to a few months after Bitcoin makes a new cycle high and dominance rolls over from a peak. The first confirmation is ETH/BTC turning up; the broad small-cap leg comes last. There is no fixed date — it is driven by the dominance rotation, not the calendar.
What triggers altcoin season?
Every window on record combined falling Bitcoin dominance with a new reason for money to move into Ethereum and the coins built around it: token sales in 2017, yield farming in 2020, the post-all-time-high rotation in 2021 and the Merge in 2022. In 6 of 8 windows ETH/BTC had already been rising for 90 days. Without that Ethereum-led catalyst, rallies stayed short.
What Bitcoin dominance level signals altseason?
There is no magic number. What matters is direction and structure, not the absolute level. Dominance breaking a sustained uptrend from a high (as it did from 71.8% in January 2021) is the signal; the 32.4% and 39.3% troughs of 2018 and 2021 marked altseason tops, not starts.
Is altseason dead after the ETFs?
Not dead, but different. ETF flows concentrate in Bitcoin and do not cascade into small-caps the way retail did, so the 2024–2026 rotation has been shallower and more selective — strong in BTC, ETH, and select large-caps, weak in the long tail.
What is the ETH/BTC ratio telling me?
It is the cleanest single-line read on whether the rotation has begun. A rising, holding ETH/BTC means capital is moving from Bitcoin into the alt complex; a falling ETH/BTC means Bitcoin is still the trade.
Why does dominance sometimes rise during a crash?
Because altcoins fall harder than Bitcoin in a risk-off event (2022's Luna and FTX collapses are the textbook cases). Rising dominance there reflects alts dying, not Bitcoin strength — always cross-check against total market cap.
How long does altcoin season last?
By the index definition, the average run lasts about 17 days. The longest windows were 2017 (120 altseason days, with a 117-day unbroken run) and 2021 (89 days); the three windows since 2024 lasted 13, 7 and 12 days. Across 2017–2026 the market spent 12% of all days in altcoin season. The early ETH-led rotation can grind for longer, but the frantic small-cap leg that everyone remembers is brief and tends to end violently when dominance bottoms.
How should I position for altseason in 2026?
Stage exposure with the staircase, not against it. Hold a Bitcoin core while dominance is still rising, add Ethereum when ETH/BTC bases and turns up, and only then rotate selectively into large-cap, narrative-backed alts. Given the ETF-era caveat above, keep the long-tail allocation small and treat the memecoin leg as a trade to take profit on, not a position to marry. Size for the fact that dominance can reverse fast.
How This Page Is Updated
We refresh the answer box, the "as of" readings and the FAQ answer to "Is it altcoin season now?" at least monthly, and add a new row to the reference table whenever the 90-day Altcoin Season Index closes at 75 or higher. Readings come from the Blockchaincenter and CoinMarketCap altcoin season indexes, CoinMarketCap's daily global metrics (Bitcoin dominance) and daily ETH/BTC closes. Last updated: October 16, 2026.
The Bottom Line
Altseason is a rotation, not a date. Bitcoin leads, dominance peaks, ETH/BTC turns up, and capital cascades down the risk curve until there is nothing lower left to buy. Every cycle from 2017 to 2026 has rhymed with that sequence — and the three signals (a BTC.D trend break, a rising ETH/BTC, and falling stablecoin dominance) have led every genuine altseason, while the famous low-dominance prints marked its end. The data adds a sobering footnote: only 12% of days since 2017 qualified as altcoin season, and Bitcoin usually took the lead back within three months.
The 2024–2026 ETF era added one crucial amendment: the rotation is shallower and more selective now, so favor quality over indiscriminate small-cap beta. Track it live on the crypto leaderboard, let autopilots act on the rotation around the clock, and read more market-structure breakdowns in SimianX Stories. When dominance rolls over and ETH/BTC turns up together — that is when altseason starts.
Related Reading
- Bitcoin Crash Feb 2026: $60K Bottom or More Pain Ahead?
- Crypto Open Interest Spike: What It Really Signals
- How to Trade a Crypto Bear Market: 2026 Survival Playbook
- ETH/BTC Ratio History: Every Cycle and Signal, 2016-2026
- Bitcoin Halving Cycles: Complete Returns Reference 2012-2028
- Every Bitcoin Crash Over 50%: Recovery Times Since 2011
- Bitcoin One Year After Its $126K Peak vs Every Past Cycle
- Bitcoin Quarterly Returns: Full History Table 2013–2026
References
- CoinGecko — BTC Dominance & Market Caps
- Glassnode — On-Chain Market Data
- Investopedia — Altcoin
- SimianX — Live Crypto Leaderboard
- Blockchaincenter — Altcoin Season Index (90-day, top 50)
- CoinMarketCap — Altcoin Season Index (top 100)
- CoinMarketCap — Bitcoin Dominance and Global Market Charts
- Bitfinex — Public Candles API (ETH/BTC daily history)
- Ethereum.org — The Merge