Bitcoin’s 7% Surge Toward $70K: Anatomy of the Rally

Bitcoin’s 7% Surge Toward $70K: Anatomy of the Rally

Treasury buybacks lit the spark, $1B in short liquidations poured fuel, ETF inflows held the floor. A driver-by-driver anatomy of Bitcoin’s run at $70,000.

2026-08-19
·
30 min read
Market Pulse
Listen to article

Anatomy of a Breakout: How Bitcoin Ran From $64K to the $70K Test

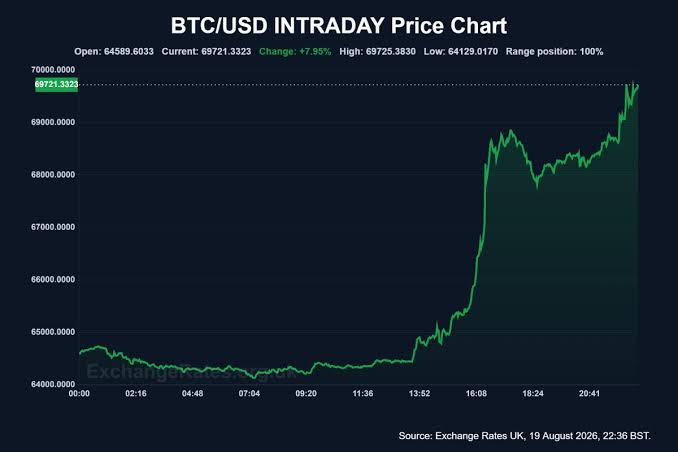
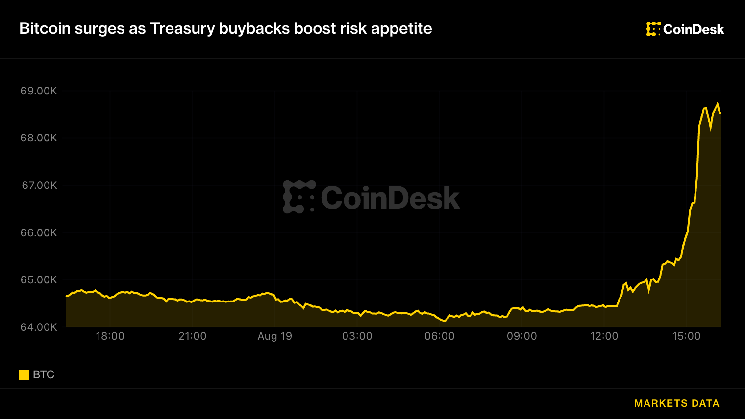
Bitcoin surged roughly 7% toward $70,000 during the August 19–20, 2026 trading session, breaking out of a quiet range and briefly touching the psychologically important $70K area for the first time since June. The move lifted BTC from roughly the mid-$64,000s to an intraday test of $70,000, while forcing a large number of bearish leveraged positions to close.

The simple explanation is that Bitcoin rose because buyers overwhelmed sellers. The more useful explanation is that several catalysts arrived in the right order: a U.S. Treasury announcement improved perceptions of bond-market liquidity, Bitcoin broke through heavily defended resistance, short liquidations created involuntary buying, and improving institutional flows had already made the market less fragile.

This distinction matters. Some drivers appear fundamental, while others are mechanical. A macro catalyst can start a move, but derivatives liquidations can amplify it far beyond the size of the original cash inflow. Investors therefore need to determine whether today’s advance is the beginning of a durable trend or a temporary short squeeze.

This research uses information available as of August 20, 2026, Asia time. Prices and derivatives data can change quickly. Readers can use SimianX AI to follow real-time BTC prices, news, sentiment, technical signals, and multi-agent market analysis as the $70,000 test develops.

SimianX AI Bitcoin price surging toward the $70,000 resistance level
Bitcoin price surging toward the $70,000 resistance level

Bitcoin Rally Today: The Essential Facts

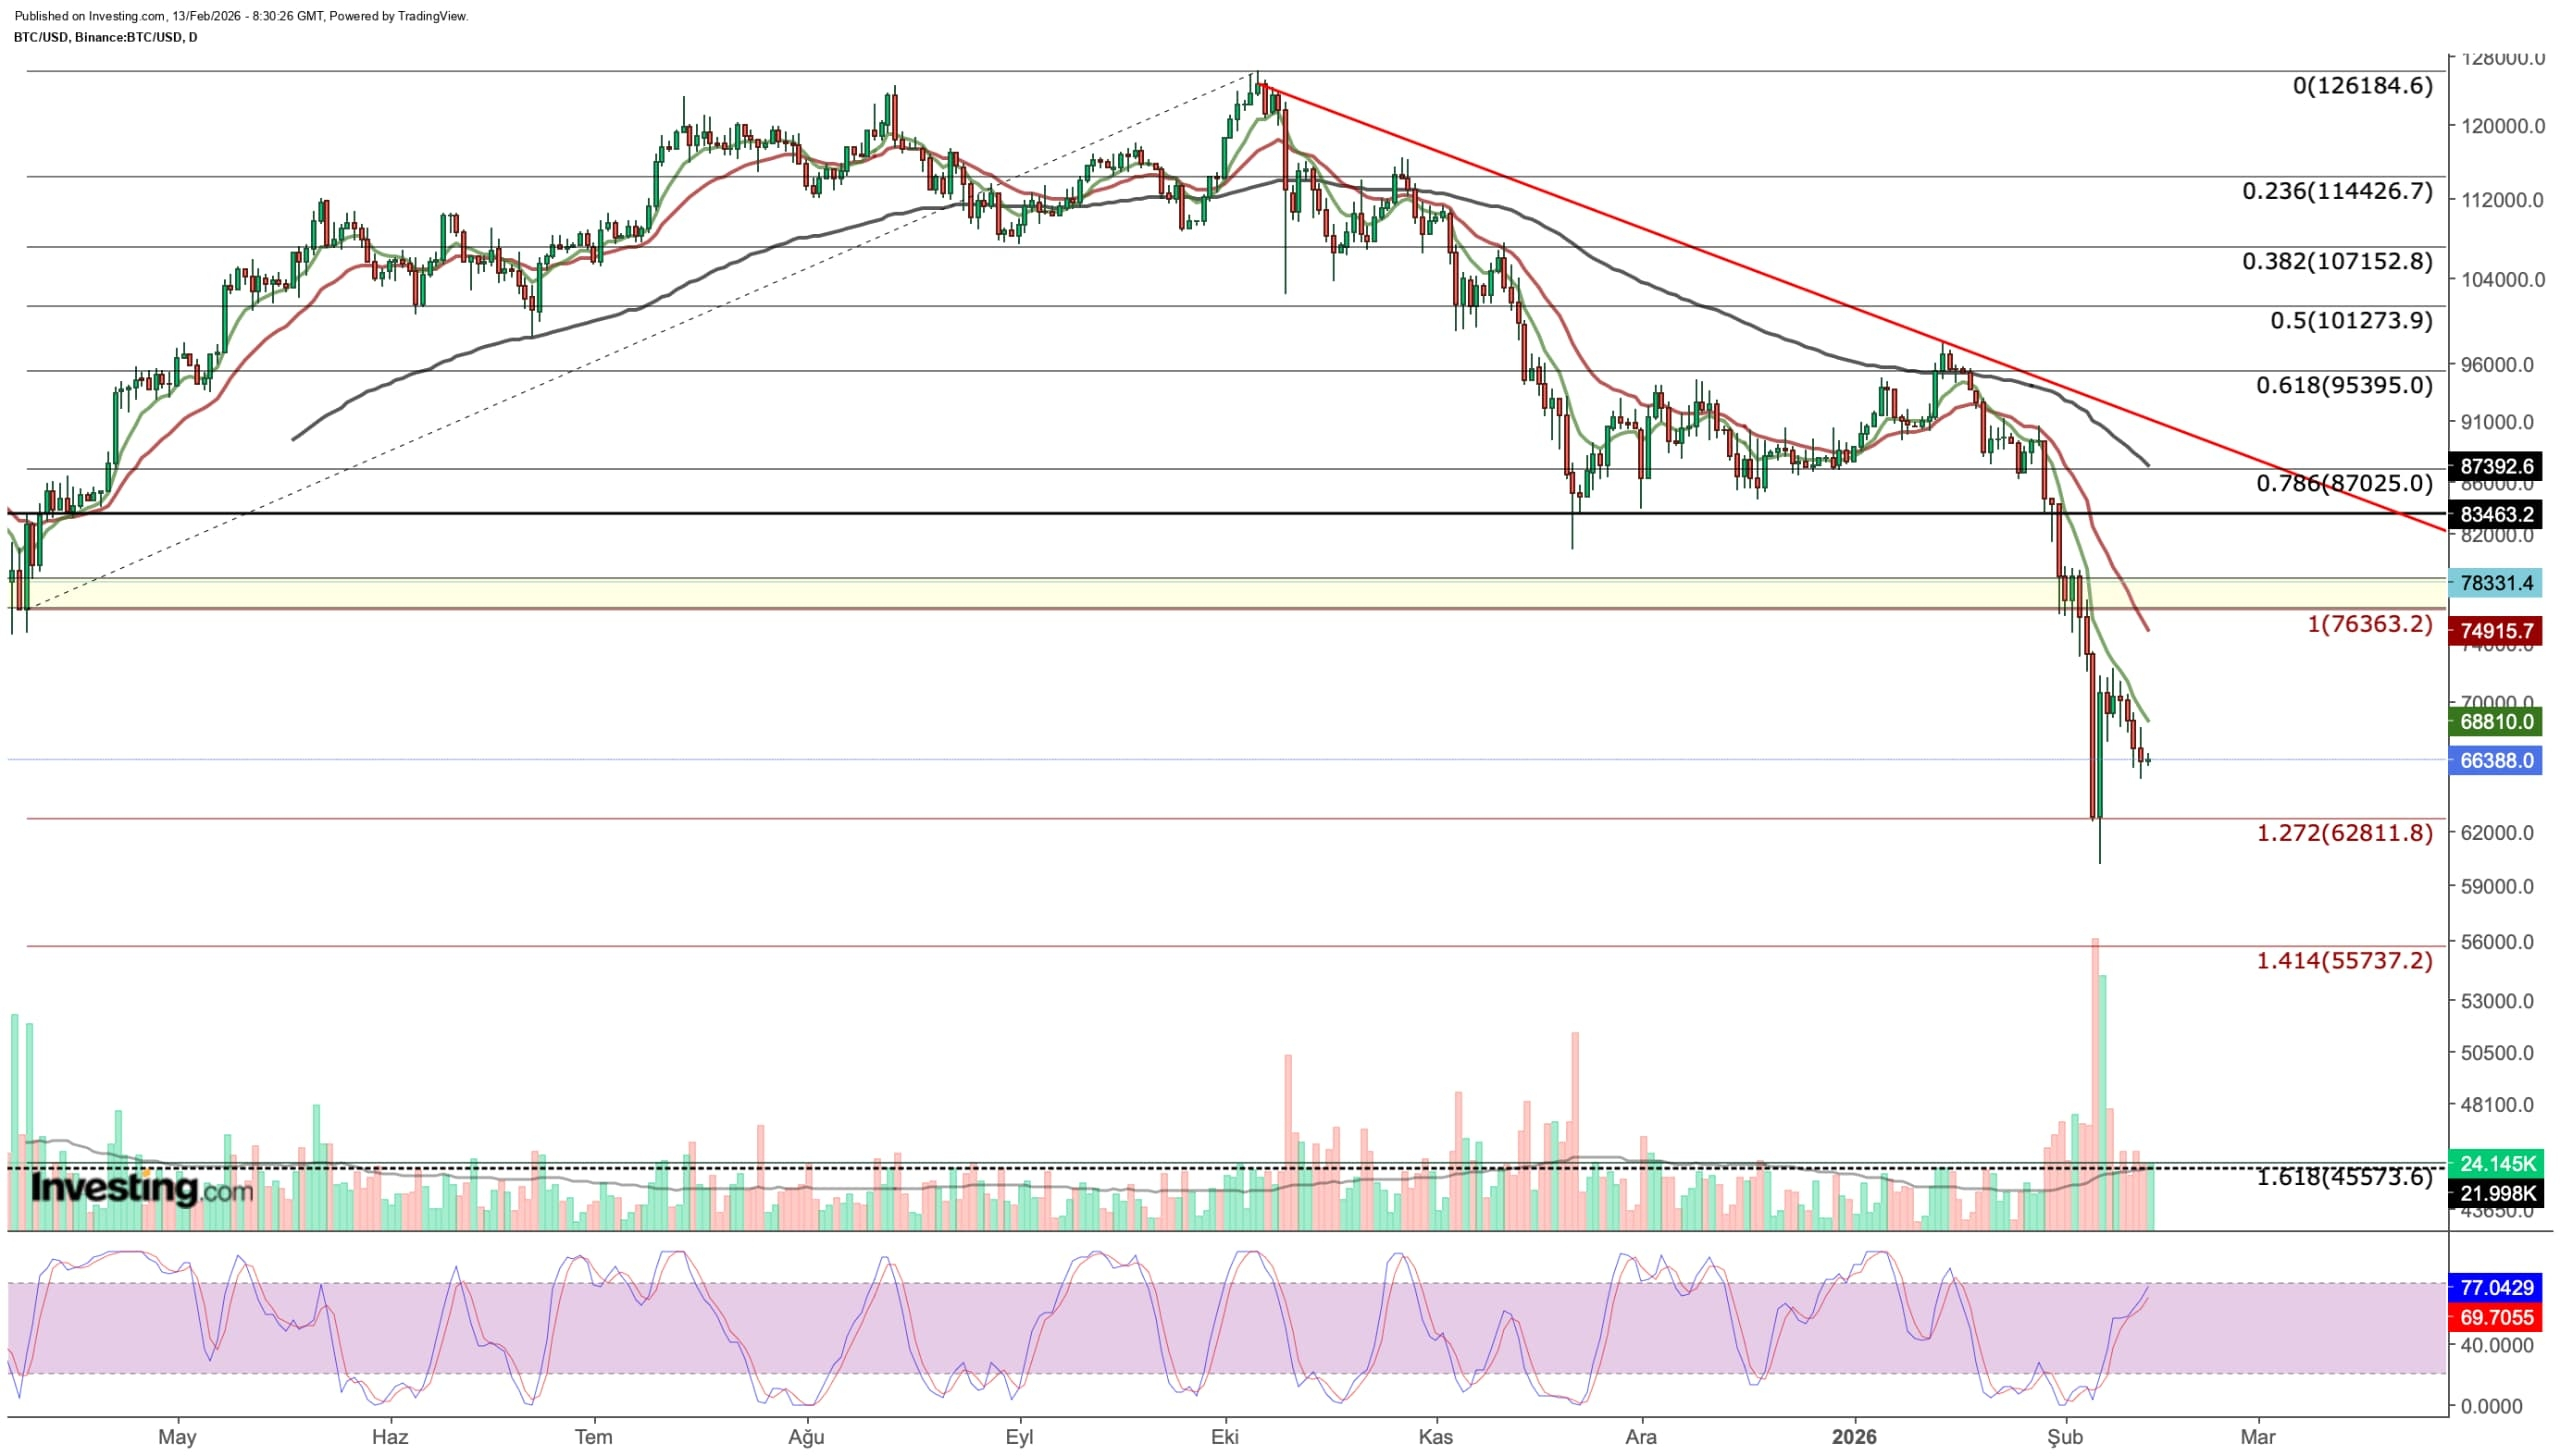
Bitcoin traded near $69,300 after briefly reaching $70,000, representing an approximately 7% 24-hour advance during the main phase of the rally. The move was notable not only for its size but also for its timing: BTC had spent much of early August struggling to close decisively above $65,000. The range followed the volatile base examined in Bitcoin Crash Feb 2026: $60K Bottom or More Pain Ahead?.

Before the breakout, the market had several characteristics that made a sudden move possible:

  • Bitcoin had repeatedly tested resistance without breaking it.
  • Perpetual-futures activity had been unusually subdued.
  • Options volatility was compressed.
  • Many traders expected the range to continue.
  • Bearish positions had accumulated above the market.
  • Large holders appeared to be absorbing supply.
  • Spot ETF flows had shown signs of improvement.

On August 12, Bitcoin slipped below $64,000 after a largely unsurprising U.S. inflation report. At the time, derivatives markets were pricing downside protection more aggressively than upside exposure, although traders were also rebuilding positions targeting $70,000. Analysts cited by The Block identified $68,700 as important overhead resistance, while longer-term support was situated much lower near $58,500. The Block’s August Bitcoin market analysis

Bitcoin’s break through that $68,700 area therefore represented more than a round-number rally. It crossed a level around which traders had placed stop orders, short positions, breakout orders, and options hedges.

Market indicatorBefore the rallyDuring the breakoutInterpretation
BTC price zoneRoughly 63K–65KApproximately 69K–70KA clear escape from the August range
Key resistance$65K, then $68.7KBriefly exceededTriggered stops and momentum buying
24-hour moveMostly range-boundAbout +7%Largest meaningful breakout in weeks
Derivatives positioningShort exposure above resistanceHeavy forced closingShort squeeze amplified the rally
Spot ETF trendTentative return of inflowsSupportive backdropSuggests some institutional demand
Macro catalystHigh yields and liquidity concernsTreasury buyback expansionImproved liquidity expectations

The rally appears to have been triggered by macro news, accelerated by short liquidations, and supported by improving spot demand. No single factor adequately explains the entire move.

1. U.S. Treasury Buybacks Supplied the Initial Macro Catalyst

The most important identifiable catalyst was the U.S. Treasury Department’s decision to increase the size of its liquidity-support buybacks for longer-dated government bonds.

The Treasury said it would at least double the size of certain operations involving securities in the 10-to-20-year and 20-to-30-year maturity sectors. The change was designed to provide greater liquidity support where market participants had consistently submitted high-quality offers.

The announcement mattered because Treasury yields had been rising, creating tighter financial conditions across stocks, bonds, housing, and speculative assets. When yields climb, investors receive a better return from comparatively low-risk government securities. That can reduce demand for non-yielding assets such as Bitcoin.

Treasury buybacks work differently from Federal Reserve quantitative easing:

  1. The Treasury purchases selected outstanding government securities.
  2. It finances its operations through the government’s existing funding structure, including new issuance.
  3. The program can improve trading liquidity in older, less-liquid bonds.
  4. It does not create money in the same way as Federal Reserve asset purchases.
  5. Its direct size is small relative to the overall Treasury market.

TreasuryDirect explains that liquidity-support buybacks provide a regular outlet through which eligible participants can sell certain outstanding securities back to the government. The program aims to improve market functioning and is not automatically equivalent to monetary stimulus. TreasuryDirect buyback program FAQ

According to Axios, bond prices reacted quickly after the August 19 announcement. The Treasury described the increase as a way to provide more liquidity support in longer-dated nominal sectors. However, analysts also emphasized that the purchases remain small relative to the roughly $30 trillion government-debt market. Axios report on the Treasury buyback expansion

The announcement helped stabilize traditional markets as well. The S&P 500 ended a three-day decline with a modest gain, while pressure from the bond market temporarily eased. Associated Press market report

Why did a Treasury-market announcement lift Bitcoin?

Bitcoin is highly sensitive to global liquidity expectations. Traders often respond positively when they believe that:

  • Bond-market stress may decline.
  • Long-term yields may stop rising.
  • Financial conditions may become less restrictive.
  • Policymakers are willing to address market dysfunction.
  • Cash may rotate from low-risk instruments into risk assets.

The critical phrase is liquidity expectations. Treasury buybacks do not directly purchase Bitcoin, and this announcement was not “money printing.” Nevertheless, markets are forward-looking. Traders interpreted the policy change as evidence that officials did not want rising long-term borrowing costs to destabilize markets.

That interpretation provided the spark. Bitcoin’s existing positioning supplied the fuel.

SimianX AI U.S. Treasury bond buybacks and Bitcoin liquidity relationship
U.S. Treasury bond buybacks and Bitcoin liquidity relationship

2. A Crowded Bitcoin Short Squeeze Magnified the Move

A short squeeze happens when traders betting on a price decline are forced to buy the asset back as it rises. In leveraged crypto markets, this process can occur automatically.

Consider a simplified example:

  1. A trader shorts BTC at $65,000.
  2. The trader uses leverage and posts limited collateral.
  3. Bitcoin rises through $66,000 and $67,000.
  4. The exchange closes the position to prevent further losses.
  5. Closing the short requires a market purchase.
  6. That forced purchase pushes BTC higher.
  7. Higher prices liquidate the next group of shorts.

The result can become a feedback loop:

Price increase → short liquidations → forced buying → higher price → more liquidations

Market discussions on August 19 cited more than $1 billion in broad crypto liquidations, with the majority reportedly involving short positions. Exact liquidation totals vary between data providers because exchanges differ in reporting practices, and some platforms do not publish complete data. The number should therefore be treated as an estimate rather than an audited figure.

The market structure before the rally made the squeeze particularly powerful. Bitcoin had repeatedly failed near $65,000, encouraging traders to short each bounce. Liquidity clusters reportedly extended through approximately $67,000–$68,000. When BTC crossed those zones, stop-loss orders and liquidation engines activated in rapid succession.

This helps explain why the move accelerated after it had already begun. Treasury news alone was unlikely to justify an immediate 7% increase in Bitcoin’s fundamental value. But it was strong enough to push BTC into a vulnerable concentration of short positions.

Was the BTC rally only a short squeeze?

Probably not—but the squeeze was a major accelerant.

A pure short squeeze often shows these characteristics:

  • Price rises sharply.
  • Short liquidations dominate activity.
  • Open interest falls as positions close.
  • Spot-market demand remains weak.
  • Price reverses after forced buying ends.

A more durable breakout usually includes:

  • Strong spot trading volume.
  • Persistent ETF inflows.
  • Higher prices with stable or gradually rising open interest.
  • Constructive funding rates rather than extreme positive funding.
  • Daily closes above former resistance.
  • Continued accumulation after the first impulse.

Investors should therefore monitor what happens after the liquidation wave. If BTC holds above $68,700–$70,000 while spot demand remains healthy, the rally has a stronger foundation. If price rapidly falls back below $67,000, the move may have been driven primarily by forced derivatives buying.

A short squeeze can begin a genuine trend, but it cannot sustain that trend indefinitely. Once bearish leverage is cleared, voluntary buyers must take over.

3. The Technical Break Above $65K and $68.7K Changed Market Behavior

Technical analysis does not cause every price move, but heavily watched levels can influence order placement. In Bitcoin’s case, the August range created several clear decision points.

The first barrier: 65,000–66,000

BTC had repeatedly approached the mid-$65,000 region without securing a convincing daily close above it. Repeated rejection encouraged range traders to sell strength and buy weakness.

Once Bitcoin decisively moved through the area, previous resistance could begin functioning as support. Momentum systems that had remained neutral may also have generated buy signals.

The second barrier: approximately $68,700

Analysts had identified roughly $68,700 as a more important overhead supply zone. That level was likely connected to:

  • Recent holder cost bases
  • Previous breakdown levels
  • Options strikes
  • Stop-loss clusters
  • Liquidation levels
  • Profit-taking orders

Crossing it opened a relatively fast path to $70,000 because fewer sellers were positioned between the resistance zone and the round number.

The psychological barrier: $70,000

Round numbers matter because investors remember and discuss them. The $70K mark can attract:

  • Retail breakout buyers
  • Media coverage
  • Limit sell orders
  • Options-related hedging
  • Profit-taking by underwater holders
  • New short positions betting on rejection

The initial test does not confirm a breakout. A brief intraday touch is different from a sustained daily or weekly close.

BTC price zoneTechnical meaningBullish confirmationBearish warning
64K–65KFormer August rangeHolds as deeper supportReturn below suggests failed breakout
66K–67KFirst breakout areaBuyers defend pullbacksFast loss signals weak demand
$68.7KMajor overhead resistanceDaily close and successful retestRejection returns BTC to range
$70KPsychological barrierMultiple closes above itLong upper wick and falling volume
71K–76KPotential holder supplyAbsorption without sharp reversalUnderwater holders sell into strength

The $71,000–$76,000 region deserves particular attention. Earlier August analysis suggested that coins acquired near those levels had aged into longer-term holder categories, with some owners selling at losses. A return to their cost basis could release additional supply. For how holder cohorts have behaved across full cycles, see Bitcoin Halving Cycles: Complete Returns Reference 2012-2028.

SimianX AI Bitcoin technical chart with support at $65K and resistance at $70K
Bitcoin technical chart with support at $65K and resistance at $70K

4. Spot Bitcoin ETF Flows Provided a More Constructive Backdrop

The rally did not begin in a vacuum. U.S. spot Bitcoin exchange-traded funds had shown signs of renewed inflows before the breakout. Retail brokerage rails add a second demand channel, as detailed in Robinhood Stock 2026: Crypto Is Only 8% of HOOD Revenue.

Data published earlier in August indicated several consecutive positive-flow sessions. Reports citing ETF trackers estimated inflows of approximately:

  • $170.1 million on August 3
  • $211.5 million on August 4
  • $244.4 million on August 5
  • $137.6 million on August 6

That represented more than $760 million across four sessions, although different trackers can report slightly different totals because of timing and classification. Later data indicated a smaller positive net flow of approximately $25.4 million on August 17.

ETF inflows matter because authorized participants generally need to source Bitcoin exposure when fund demand exceeds redemptions. Persistent inflows can create a recurring spot bid rather than a temporary derivatives-driven move.

However, investors should avoid overstating the evidence:

  • One week of inflows does not establish a long-term trend.
  • ETF flows can reverse quickly.
  • A large price increase may encourage creations one day and redemptions the next.
  • Some trading activity reflects arbitrage rather than directional conviction.
  • Reported flows arrive with a delay and may be revised.

The correct conclusion is that ETF demand made the market more receptive to a breakout. It was a supportive condition, not necessarily the single cause of the 7% rally.

ETF demand versus derivatives demand

The distinction between spot and leveraged demand is crucial:

Type of demandHow it enters the marketTypical durability
ETF inflowCapital enters regulated spot fundsPotentially persistent
Direct spot purchaseInvestor buys and holds BTCDepends on holder conviction
Futures longLeveraged directional positionSensitive to funding and volatility
Short liquidationForced purchase to close a bearish tradeUsually temporary
Options hedgingDealer buys BTC or futures to manage exposureChanges as price and volatility move

A healthy continuation would ideally show spot and ETF demand replacing liquidation-driven demand after the initial breakout.

5. Whale Accumulation Reduced Available Supply

On-chain analysis before the rally also showed signs that large Bitcoin holders had been accumulating.

Research cited by The Block indicated that entities holding more than 1,000 BTC collectively controlled approximately 3.06 million BTC as of August 8, a 2026 high at the time. While wallet-based classifications are imperfect—an address may belong to an exchange, custodian, fund, or multiple investors—the trend suggested that large holders were absorbing coins sold by weaker hands.

This matters because Bitcoin’s short-term price is determined by the supply available for sale, not merely the total supply ever mined.

If large holders accumulate while:

  • ETF flows turn positive,
  • exchange balances remain controlled,
  • miners do not increase selling sharply, and
  • short sellers become crowded,

then the liquid supply near the market can become thin. Under those conditions, a modest increase in demand may create a disproportionate price response.

The same mechanism works in reverse. If whales distribute into a rally, large sell orders can overwhelm new demand. Investors should therefore track net exchange inflows, large-holder balances, realized profits and losses, and the age of coins being spent.

What on-chain data cannot prove

On-chain metrics do not reveal every investor’s identity or intention. A transfer to an exchange may be collateral management rather than an immediate sale. A decline in exchange balances may reflect custodial restructuring rather than accumulation.

On-chain data is most valuable when combined with:

  • Price and volume
  • ETF creations and redemptions
  • Futures open interest
  • Funding rates
  • Options skew
  • Macroeconomic conditions
  • Confirmed company or fund disclosures

SimianX AI’s multi-source workflow can help investors compare these signals instead of treating one whale alert or blockchain transfer as a complete investment thesis.

SimianX AI Bitcoin whale accumulation and shrinking liquid supply illustration
Bitcoin whale accumulation and shrinking liquid supply illustration

6. Compressed Volatility Made a Large Move More Likely

Before the rally, Bitcoin’s trading environment was unusually quiet. Perpetual-futures activity had reportedly fallen to multi-year lows, while implied volatility sat near the lower end of its historical range.

Low volatility does not predict direction. It indicates that the market expects smaller moves. When that expectation is wrong, traders rush to reposition.

This produces three effects:

  1. Option sellers hedge more aggressively.

Dealers who sold upside options may need to buy BTC or futures as price rises.

  1. Range strategies unwind.

Traders who repeatedly sold the top of the range must close positions.

  1. Momentum systems activate.

Quantitative strategies may add exposure after volatility and price thresholds are crossed.

Coinbase Institutional research for August noted stronger funding, short-term holder profitability moving above its breakeven threshold, and options skew shifting away from heavy downside protection. It also observed that Bitcoin’s leverage ratio had edged lower even while absolute open interest increased. Coinbase Institutional’s August 2026 positioning report

These conditions created a market in which participants were less protected against an upside surprise. Once the macro catalyst arrived, repricing became faster.

7. Softer Inflation and Reduced Rate-Hike Fears Built the Foundation

The immediate rally followed the Treasury announcement, but the broader foundation developed earlier.

July U.S. consumer inflation reportedly slowed to approximately 3.4% year over year, while core inflation eased to about 2.5%. The report was close to expectations and did not initially push Bitcoin out of its range. However, it reduced the urgency for a fresh rate increase.

Bitcoin reacts to interest-rate expectations because:

  • Higher real yields increase the opportunity cost of holding BTC.
  • Tighter policy reduces speculative liquidity.
  • A stronger dollar can pressure dollar-denominated assets.
  • Lower yields can support valuations across risk markets.
  • Policy expectations influence leverage and institutional allocation.

The August 19 Federal Reserve minutes remained a potential counterweight. If policymakers appeared more concerned about inflation than markets expected, yields and the dollar could rise again.

The fact that Bitcoin advanced despite some pressure from yields and volatility makes the move noteworthy, but it also creates risk. If the macro environment remains restrictive, BTC may struggle to retain all of the liquidation-driven gain. Bitcoin’s track record around policy pivots is tabulated in Bitcoin After Every Fed Rate Cut: 2019-2026 Reference.

The Treasury announcement improved market functioning expectations; it did not eliminate inflation risk or guarantee easier Federal Reserve policy.

Is Bitcoin’s 7% Rally a Real Breakout or a Short-Lived Squeeze?

The honest answer is that confirmation requires more time.

Today’s move contains evidence for both interpretations.

Evidence supporting a genuine breakout

  • BTC escaped a multi-week trading range.
  • Price crossed several recognized resistance levels.
  • Spot ETF flows had improved before the rally.
  • Large holders appeared to be accumulating.
  • Volatility expanded after a prolonged compression.
  • The policy catalyst affected multiple asset classes.
  • Bitcoin reached $70,000 despite a complicated macro backdrop.

Evidence supporting a temporary squeeze

  • A large portion of the move appears linked to short liquidations.
  • $70,000 attracted immediate selling.
  • Treasury buybacks are not quantitative easing.
  • Bond yields and inflation concerns remain elevated.
  • ETF flows have not yet established a durable multi-week trend.
  • BTC faces potential supply from holders between $71,000 and $76,000.
  • Rapid vertical rallies often retrace to test the breakout zone.

A sensible investor should avoid making the decision based on one hourly candle. Confirmation should come from the interaction of price, volume, leverage, and spot demand.

What Bitcoin Traders Should Watch Next

1. A daily close above $70,000

A sustained close carries more weight than an intraday touch. Multiple daily closes would show that sellers cannot force BTC back into its previous range.

2. The $68,700 retest

A pullback that holds near former resistance would be constructive. A decisive break below it would not automatically end the rally, but it would weaken the immediate breakout signal.

3. Funding rates

Moderately positive funding can accompany a healthy trend. Extremely positive funding suggests that leveraged longs are becoming crowded, increasing the risk of a long squeeze.

4. Open interest

  • Price up, open interest down: short covering is probably dominant.
  • Price up, open interest stable: leverage is being absorbed.
  • Price up, open interest rising gradually: new exposure is entering.
  • Price up, open interest surging: the rally may be overheating.

5. ETF flows

Continued net inflows would support the argument that institutional spot demand is replacing forced derivatives buying.

6. Treasury yields and the dollar

If long-term yields resume climbing and the dollar strengthens, Bitcoin may face renewed pressure. If yields stabilize, risk assets receive more room to extend.

7. Spot trading volume

A breakout supported by broad spot-market volume is more credible than one concentrated in perpetual futures.

8. The $71,000–$76,000 supply zone

This area may contain sellers waiting to exit near their original purchase prices. BTC must absorb that supply before the market can discuss substantially higher targets with confidence.

Bitcoin Price Scenarios After the $70K Test

ScenarioRequired conditionsPotential pathMain risk
Bullish continuationDaily closes above $70K, positive ETF flows, controlled funding72K–76K becomes the next testLeverage overheats
Constructive consolidationBTC holds 67K–69K while volume coolsMarket builds a base below $70KPatience turns into distribution
Failed breakoutBTC loses $67K and re-enters old rangeReturn toward 65K–64KShort squeeze fully reverses
Deeper risk-off moveYields surge, ETF flows turn negative, BTC loses $64K60K–62K retest becomes possibleMacro stress accelerates
Extreme upside squeeze$70K breaks with heavy spot demand and new short pressureRapid move through $72K toward $76KViolent reversal after euphoria

These scenarios are not price predictions. They are conditional frameworks that help investors respond to evidence rather than headlines. If the failed-breakout path plays out, the defensive frameworks in How to Trade a Crypto Bear Market: 2026 Survival Playbook apply.

SimianX AI Bitcoin bull, base, and bear scenarios after the $70K breakout
Bitcoin bull, base, and bear scenarios after the $70K breakout

How to Analyze a Fast Bitcoin Rally Step by Step

When BTC moves 7% in one session, use the following process:

  1. Verify the price move across several exchanges.

Avoid relying on a single venue where temporary liquidity problems may distort the price.

  1. Identify the first catalyst.

Determine whether the move began after macroeconomic news, regulatory action, an ETF-flow update, or an internal crypto event.

  1. Separate spot buying from forced buying.

Compare spot volume, futures volume, open interest, and liquidation data.

  1. Check whether related markets confirm the story.

Review Treasury yields, the dollar, equities, gold, and volatility.

  1. Map the nearest support and resistance levels.

For this move, the key areas include roughly $65K, $68.7K, $70K, and 71K–76K.

  1. Wait for the close.

Intraday breakouts can disappear before the daily candle completes.

  1. Measure follow-through.

A genuine breakout should attract buyers after the initial liquidation cascade ends.

  1. Define invalidation before taking risk.

Decide what evidence would prove the thesis wrong rather than changing the thesis after price reverses.

Investors can enter BTC in SimianX AI to compare live technical indicators, market news, sentiment, and multiple AI-agent interpretations. This is particularly helpful when a dramatic headline conceals several competing explanations. The underlying workflow is described in Real-Time AI Crypto Command Room: Coinbase, Binance, Bybit, and you can compare how different AI models trade BTC on the SimianX Crypto Leaderboard.

FAQ About Today’s Bitcoin Rally Toward $70K

Why is Bitcoin rallying today?

Bitcoin’s rally appears to have started after the U.S. Treasury expanded liquidity-support buybacks for longer-dated government securities. The move then accelerated as BTC broke resistance and forced crowded short positions to close.

How did short liquidations push Bitcoin higher?

Closing a short position requires buying Bitcoin or an equivalent futures contract. When many leveraged shorts are liquidated together, those forced purchases can push price higher and trigger another round of liquidations.

Did spot Bitcoin ETF inflows cause the 7% rally?

ETF inflows were probably a supportive background factor rather than the sole immediate catalyst. Improving flows reduced selling pressure and indicated renewed institutional interest before the Treasury news and liquidation cascade.

Will Bitcoin break and hold above $70,000?

BTC briefly tested $70,000, but a durable breakout requires daily closes above the level, continued spot demand, and controlled leverage. Failure to hold approximately $68,700 would increase the probability of a return to the previous range.

Is the Treasury buyback program the same as quantitative easing?

No. Treasury buybacks aim to support market liquidity and debt management, while Federal Reserve quantitative easing creates central-bank reserves to purchase securities. Markets may interpret both as liquidity-supportive, but the mechanisms and scale are different.

What could stop the Bitcoin rally?

A renewed rise in Treasury yields, a stronger dollar, negative ETF flows, excessive leveraged-long positioning, or rejection from the $71,000–$76,000 supply area could reverse the move.

Conclusion

Bitcoin’s roughly 7% surge toward $70,000 was not caused by one isolated event. The most plausible sequence is:

  1. The U.S. Treasury expanded long-end bond buybacks, improving perceptions of market liquidity.
  2. Bitcoin broke above $65,000 and $68,700, invalidating bearish range trades.
  3. Short liquidations created forced buying, rapidly accelerating the move.
  4. Recent ETF inflows and whale accumulation provided a more supportive spot-market backdrop.
  5. Compressed volatility and thin positioning magnified the price response.
  6. Reduced fears of an immediate rate hike helped prepare the market for a risk-on reaction.

The key uncertainty is durability. If Bitcoin holds above former resistance, attracts continuing ETF and spot demand, and avoids excessive funding rates, today’s rally may mark a meaningful trend change. If BTC falls back below $67,000–$68,700 after liquidations subside, the move will look more like a macro-triggered short squeeze than a fully confirmed bull-market breakout.

The best response is neither automatic enthusiasm nor automatic skepticism. Track the evidence: price closes, ETF flows, open interest, funding, spot volume, Treasury yields, and holder behavior.

For live monitoring of BTC fundamentals, technical conditions, news sentiment, and multi-agent market interpretations, explore SimianX AI. Use it to reassess the Bitcoin rally as new data determines whether $70,000 becomes support—or remains resistance.

Related Reading

References

Disclaimer: This article is for informational and educational purposes only. It is not financial, investment, tax, or legal advice. Cryptocurrency prices are highly volatile, and leveraged trading can result in rapid losses.

Ready to Transform Your Trading?

Join thousands of investors using AI-powered analysis to make smarter investment decisions

Today's most analyzed — click to enter the Live Command Room