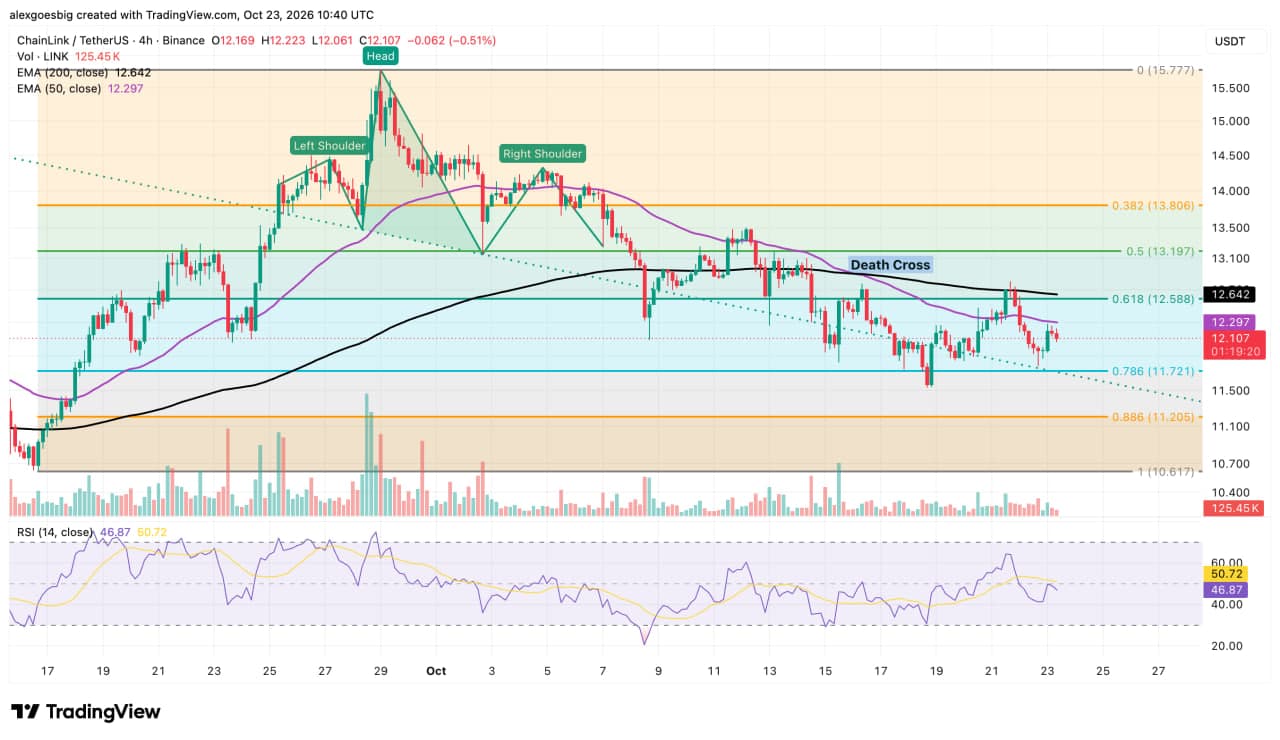
LINK/USDT — 24-Hour Trading Read
As of: 2026-10-23 19:53 UTC
Current price: 11.916 USDT
Overall bias for the next 24 hours: Mildly bearish to neutral
Trade stance: wait / no trade unless price confirms a break or a strong reclaim
Confidence score: 43/100 — this is a directional assessment, not a buy-strength score. The setup has a modest downside lean, but weak volume and nearby support limit conviction.
1. Trend analysis
Short-term trend: bearish. LINK is down 0.64% over 1 hour, 1.13% over 4 hours, and 0.33% over 24 hours. It is also 2.94% lower over 7 days. Price is near the bottom of its 24-hour range of 11.861–12.287, at roughly the 13th percentile, showing that sellers have controlled much of the recent range.
The daily chart reinforces the weak near-term picture:
- Price at 11.916 is below the 12-day EMA (12.359), 26-day EMA (12.628), 50-day EMA (12.386), and 20-day SMA (12.742).
- MACD is below its signal line, with a negative histogram, consistent with downward momentum.
- RSI is 37.47: weak, but not yet deeply oversold. This leaves room for further downside, while also making a short-term bounce possible.
- Recent daily candles show lower trading levels overall, after a retreat from the 14.2–14.3 area.
Broader context: Price remains above the 200-day SMA (9.927), so the longer-term trend is not conclusively broken by the supplied data. That longer-term support does not outweigh the weaker short-term structure for this 24-hour call.
Volume is a caution. Daily volume is below its 20-day average, and the supplied 24-hour volume is 0.64x the 7-day daily average. The decline is not being confirmed by unusually high volume, so the bearish signal is present but not especially forceful.
2. Key support and resistance
Support
- 11.86–11.78: Immediate support zone. It includes the current 24-hour low (11.861) and the previous daily low (11.778). A decisive break would increase the risk of a continuation lower.
- 11.53: Important next support, marked by a recent daily low and the monthly candle low. A move here would represent a material extension of the current decline.
- 11.35: Approximate lower Bollinger Band. It is a secondary downside reference, not a guaranteed floor.
- Near 9.93: The 200-day SMA is a much deeper structural reference and is not the primary 24-hour target.
Resistance
- 12.00–12.09: First nearby reclaim area, including the recent daily open region and local price structure.
- 12.26–12.29: Near-term resistance around the 24-hour high and recent daily highs. A sustained move above this zone would weaken the immediate bearish case.
- 12.35–12.63: Cluster of the 12-day EMA, 50-day EMA, and 26-day EMA. This is a significant moving-average resistance band.
- 12.74: 20-day SMA and Bollinger middle band; a stronger recovery signal would require reclaiming this area.
3. Market structure and sentiment
The short-term structure is weak, with price below several key moving averages and positioned close to the bottom of its daily range. That favors sellers unless LINK quickly recovers the 12.26–12.29 resistance area.
Derivatives positioning is mixed rather than strongly directional:
- Perpetual funding is positive at +0.0100% per 8 hours, above the 7-day average of +0.0038%. Longs are paying shorts, indicating some preference for long exposure despite falling spot prices. This can create vulnerability to long liquidations if support breaks, but funding alone is not extreme evidence of crowded longs.
- Top-trader account long/short ratio is 0.78, while the position-based ratio is 0.92. Both are below 1, suggesting these measures lean short, though not decisively.
- Open-interest change is unavailable, limiting assessment of whether the move is being driven by new positions or position reduction.
Taken together, price action is bearish, while positioning is mixed. The low volume and lack of open-interest data argue against treating the current move as a high-conviction breakdown.
4. Fundamentals and their 24-hour weight
Chainlink’s core role is providing decentralized oracle services that connect blockchains and smart contracts to external data. Its network utility and broad relevance to on-chain infrastructure are important longer-term fundamentals, but the supplied information does not identify a near-term catalyst such as a major announcement, funding event, or positioning extreme.
Fundamental weight for this 24-hour window: backdrop. The call is driven primarily by price structure, momentum, volume, and positioning data—not by a specific near-term fundamental catalyst.
5. Overall directional bias and decision conditions
Bias: mildly bearish to neutral over the next 24 hours. Momentum and market structure favor downside, but immediate support is close, volume is subdued, and positioning indicators do not give a clean confirmation.
- Bearish confirmation: A sustained break below 11.86–11.78, especially with rising volume, would increase the chance of a move toward 11.53.
- Recovery signal: Reclaiming 12.26–12.29 would reduce immediate downside risk. A sustained push through the 12.35–12.63 moving-average band would make the short-term outlook more constructive.
- Practical stance: wait / no trade is preferable while price is caught between nearby support and overhead resistance. The supplied evidence supports only a modest downside lean, not a strong directional position.
This is a short-horizon market assessment based on the data provided, not financial advice. Crypto prices can move sharply, and support or resistance levels are not guaranteed to hold.