B
AI 加密资产分析
BMT
BMT
资产分类 其他
BMT
选择具体交易所与交易对后,直接进入 Live 页并自动启动分析。
这里展示所选交易对最近一次基本面分析与新闻分析,并标注分析时间。
分析时间
暂无该语言的分析,以下显示最新一份(英语)。
Bearish to neutral bias with a bearish short-term tilt. Price remains below multiple key moving averages on 5m-4H timeframes with negative MACD histograms, though it holds above important lows and the 4H SMA200. No trade recommended until a confirmed break of key zones.
Current price: 0.023375 USDT
Exchange: Bybit
Contract: USDT-margined perpetual, maximum leverage 5x
Scope note: The supplied project information is sparse: market cap, supply, blockchain, and description are unavailable. This prevents a meaningful assessment of valuation, tokenomics, adoption, or project-specific catalysts. The analysis below is therefore primarily technical and market-structure based, rather than a full fundamental valuation. It uses the supplied candles and indicators; short-term signals can change quickly.
Short term (1m–15m): weak and consolidating.
The latest price is close to the 1m short-term averages, but below the 5m and 15m EMA/SMA references. The 5m RSI is 36.22, showing weak momentum without being deeply oversold; 15m RSI is 48.12, closer to neutral. The 1m MACD histogram is slightly positive, but the 5m and 15m MACD histograms remain negative. This points to a small intraday bounce attempt within a still-soft short-term trend, not a confirmed reversal.
Intraday (1H): bearish.
Price is below the 1H EMA12 (0.023577), EMA26 (0.023843), SMA20 (0.023809), and SMA50 (0.024008). The 1H MACD is negative and RSI is 36.24. Together, these indicate downside momentum and a price trading beneath nearby trend measures. The lower Bollinger Band at 0.022776 is a potential volatility-based support reference, not a guaranteed floor.
4H: recovery has stalled; structure is mixed-to-bearish.
The broader 4H history shows a sharp run-up toward 0.027159 followed by a pronounced pullback. Price remains below the 4H EMA12 (0.023896), EMA26 (0.024173), SMA20 (0.023805), and SMA50 (0.024310). The 4H MACD histogram is negative, although RSI at 51.52 is neutral. The 4H SMA200 (0.022758) remains below price, so the longer baseline has not fully broken, but the nearer-term averages are overhead resistance.
Daily: corrective phase after a volatile advance.
Daily RSI is 38.42 and the MACD histogram is negative, consistent with weakening momentum. Price is below EMA12 (0.024330) and SMA20 (0.025713), but above EMA26 (0.023685), EMA50 (0.022240), and SMA50 (0.021678). This suggests a correction within a still-elevated broader range rather than clear evidence of a confirmed long-term breakdown. The recent daily candles are volatile, so the longer-term picture remains uncertain.
Trend conclusion: The near-term and intraday trend is bearish; the higher-timeframe picture is corrective and mixed. A sustained recovery above the 0.0238–0.0242 region would improve the short-term structure.
Levels are approximate zones inferred from recent candle highs/lows and indicator references. They should not be treated as exact price barriers.
Support
Resistance
Practical read: A decisive break below 0.02320 would increase the risk of a retest of 0.02300 and then the 0.0228 area. Conversely, reclaiming and holding above 0.0238–0.0240 would be the first meaningful sign that sellers are losing control.
Bias: Bearish to neutral, with a bearish short-term tilt.
The bearish case is based on price sitting below several key 5m–4H moving averages, negative MACD histograms on the principal intraday timeframes, and a corrective structure after the recent rally. The case is not strongly bearish because price remains above important recent lows and the 4H SMA200, while daily price is still above the EMA26 and EMA50. A break and hold above 0.0238–0.0240 would weaken the bearish view; a sustained move below 0.0230 would strengthen it.
Directional label: NO_TRADE until price confirms a break or reclaim of a key zone. Chasing a SHORT near immediate support offers poor confirmation, while a LONG would be countertrend without a sustained reclaim of resistance.
Confidence score: 39/100 — This score reflects a modest bearish tilt, not a high-conviction signal. It is not a probability estimate and is constrained by the short candle history, the lack of project fundamentals, and the absence of funding/open-interest data. Leverage can magnify losses; the stated 5x maximum is not a recommendation to use that leverage.
分析时间
暂无该语言的分析,以下显示最新一份(英语)。
Net bearish pressure from broad crypto selloff, liquidations, and liquidity contraction is expected to drive BMTUSDT lower over the next 24-72 hours, only partially offset by equities rally and regulatory relief.
Current price anchor: $0.023554
The news flow is net bearish for BMTUSDT over the next 24–72 hours. Broad crypto selling, a major liquidation wave, and shrinking stablecoin liquidity increase the chance of continued risk reduction across altcoins. BMT may be more vulnerable than larger assets if traders reduce exposure to smaller or less liquid tokens.
That pressure is partly offset by a sharp rally in U.S. equities and the withdrawal of a proposed, more restrictive crypto transfer rule. These are supportive signals, but they do not yet outweigh the evidence of stress in crypto markets.
| News | Likely BMTUSDT effect | Timing |
|---|---|---|
| Stablecoin market cap down $21B from its May 2026 peak | Bearish: contraction can mean less readily available liquidity and weaker buying capacity for crypto, potentially amplifying BMT selling. | Days to weeks |
| U.S. regulators withdraw the $250 Travel Rule proposal and crypto language | Mildly bullish: removes a potential compliance burden and reduces a regulatory overhang. It may support sentiment, but is unlikely by itself to reverse a market-wide selloff. | Short term to weeks |
| U.S. equities rally; major indexes up around 1.3%–2% | Bullish for risk appetite and potentially supportive of a relief bounce in crypto and BMT. The boost is less reliable if crypto-specific selling persists. | Immediate to 1–2 days |
| France’s 10-year yield falls | Slightly supportive if it reflects easing rate pressure, but the connection to BMT is indirect and uncertain. | Days |
| Report of a $1B crypto flash crash and rising capitulation risk | Bearish: signals fragile sentiment and a heightened risk of sharp, liquidity-driven moves. | Immediate |
| Bitcoin falls below $74K, with the broader crypto market losing over $80B | Strongly bearish: broad market declines typically pressure altcoins, including BMT, through correlated selling and reduced risk appetite. | Immediate to several days |
| BTC, ETH, and XRP fall amid roughly $1B in liquidations | Strongly bearish: liquidations can force additional sales and create cascading volatility, which may weigh disproportionately on thinner markets. | Immediate |
| China factory inflation rises ahead of U.S. CPI | Cautiously bearish: inflation uncertainty can lift rate concerns and reduce willingness to hold risky assets. U.S. CPI is the more direct near-term catalyst. | Next 1–2 days |
| Strong U.S. jobs data raises December rate-hike expectations | Bearish: expectations of tighter financial conditions can weigh on speculative assets and limit rebound attempts. | Days to weeks |
No prediction-market data is available, so there is no Polymarket sentiment signal to assess. This should be treated as missing information—not as evidence of either confidence or uncertainty about BMT’s direction.
Bias: cautious / bearish; avoid assuming the equity rally means crypto has bottomed.
No BMT-specific support, resistance, volume, or volatility data was provided, so precise price targets or levels beyond the current $0.023554 anchor would be speculative.
BIRB и IRYS водят фючърсните индекси с близо 200% ръст, докато MAGMA и JCT падат с 39%
Фючърсите на криптовалутите се покачват рязко: BIRB и IRYS скочиха с близо 200%, докато MAGMA падна с 39% Пазарите на безсрочни фючърси отчетоха изключителна волатилност през последните 24 часа, като няколко контракта с ниска капитализация отбелязаха трицифрени процентни печалби, докато други претърпяха резки двуцифрени спадове. BIRB и IRYS поведоха покачването с ралита съответно от приблизително 195% и 191%, което подчертава силно спекулативния характер на по-малките безс...
查看原文DXY Hits 19-Month High: Was the ‘Dollar Is Dying’ Crowd Wrong?
The US dollar hit a 19-month high on Wednesday. Traders are betting the Federal Reserve will raise interest rates again in December. It is a sharp reversal from 2025. In the first half of that year, the dollar fell more than 10%, its worst start to a year since 1973. Some saw that slide as a sign America was losing its financial might. US Dollar Index (DXY) Performance. Source: TradingView Why Is the Dollar Rising Again? The US Dollar Index (DXY), which tracks...
查看原文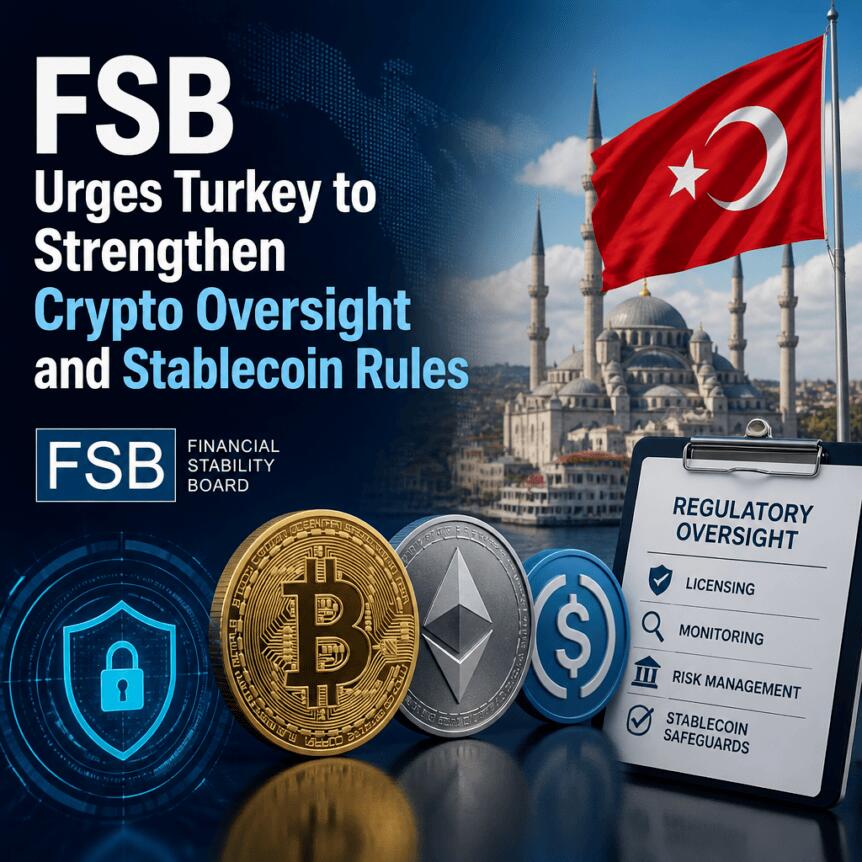
FSB Urges Turkey to Strengthen Crypto Oversight and Stablecoin Rules
Turkey received fresh scrutiny from the Financial Stability Board (FSB), which urged Turkish authorities to further tighten oversight of crypto markets and move toward dedicated regulation for stablecoins. The call comes in a peer review published this week by the global financial watchdog. The FSB said Turkey has already made progress by building a regulatory framework for crypto service providers, including registration and licensing requirements. Still, it warned that g...
查看原文
Stablecoin supply shrinks by $14.2B in 30 days, Glassnode says
The stablecoin supply contraction signals investor caution and potential volatility, impacting broader crypto market dynamics and confidence. The post Stablecoin supply shrinks by $14.2B in 30 days, Glassnode says appeared first on Crypto Briefing.
查看原文按交易所与现货 / 永续查看可立即启动的分析入口。
按当前筛选查看 BMT 在不同模型下的表现。
暂无 BMT 的交易数据
这里会把 BMT 的模型表现、可交易市场和最新分析放在一起,方便你直接比较不同交易所和交易对。
如果你准备开始分析,这个页面可以直接带你进入具体市场。
继续浏览其他高关注度的资产页面。
这里展示的是当前支持直接分析的 BMT 市场,覆盖不同交易所,以及现货和永续两种类型。你可以先比较,再直接打开自己真正想看的那个市场。
点击后会直接进入所选市场的 Live 分析页,并自动开始分析。这样你不用再手动搜索交易对,可以从当前页面直接进入具体市场。
不一定。某个模型在 BMT 上整体表现好,并不代表所有交易所、所有合约类型都一样适合。这个页面会同时给你看整体模型表现和具体可交易市场,方便你自己判断。