P
AI Crypto Asset Analysis
PROM
PROM
Sep 28, 12:49 AM
Category Other
PROM
Choose an exchange-specific pair and open Live with analysis auto-started for that market.

Binance
Avg Win Rate
50.0%
Best Timeframe
5m
The selected pair shows the latest fundamental and news analysis, together with analyzed time.
Analyzed
Aug 13, 12:25 PM
Higher-timeframe daily trend is bullish with price above all major moving averages, but short-term 1-hour structure is corrective and 4-hour momentum has weakened. Bias is cautiously bullish/neutral-bullish while price holds above 2.37-2.40, with stronger continuation requiring reclaim of 2.50-2.55.
Current price: ~2.432 USDT
Primary data window: 1-minute through daily candles
Important limitation: The supplied dataset contains almost no fundamental information—no verified market capitalization, supply figures, project description, tokenomics, unlock schedule, development activity, or derivatives positioning. Therefore, this is primarily a technical and market-structure assessment, not a conventional fundamental valuation.
Because PROM is trading in a perpetual swap with substantial recent volatility, leverage and liquidation risk appear especially important.
The daily chart shows a strong broader uptrend:
This indicates that the larger trend remains constructive despite the recent pullback.
However, the daily structure is not a smooth trend. The recent move from roughly 1.85 to 3.46, followed by a sharp retracement toward 2.37, represents a highly speculative and unstable price expansion. Such conditions increase the probability of large stop runs and rapid reversals.
The 4-hour chart is more neutral-to-bullish:
This suggests that the larger 4-hour uptrend has not fully broken, but momentum has weakened and the market is consolidating after a major impulse.
The 1-hour structure remains bearish-to-neutral:
The recent hourly sequence shows a decline from the 2.78 area to a low near 2.37, followed by a modest bounce. This is currently better described as a relief rebound within a short-term correction, rather than a confirmed reversal.
The 1-minute and 5-minute indicators show a short-term recovery:
The latest buying activity was accompanied by elevated 1-minute volume, including roughly 35,612 PROM in the latest completed 1-minute candle versus a 20-period average near 13,568. That supports the rebound, although short-term volume spikes in a volatile perpetual contract can also reflect short covering rather than durable spot accumulation.
The market is therefore in a higher-timeframe bullish trend undergoing a medium- and short-term correction/rebound cycle.
This is the most important nearby zone:
A sustained hold above this area would keep the current rebound intact.
This area is significant because:
A decisive break below 2.37 would weaken the recovery and suggest that sellers are regaining control.
This zone is supported by:
A move into this area would represent a deeper retracement but would not necessarily invalidate the larger daily uptrend.
This is a more distant but important level:
A loss of this area would materially damage the medium-term bullish thesis.
This zone aligns with:
A decline below 1.90–1.92 would indicate that much of the recent bullish trend has been retraced.
This is the first hurdle:
A clean break above 2.45, ideally with sustained volume, would improve short-term structure.
This is a dense resistance zone:
This is likely the most important recovery barrier. Reclaiming 2.55 would provide stronger evidence that the short-term correction is ending.
This area corresponds to:
A recovery into this region would likely encounter profit-taking from traders who bought the earlier impulse.
This zone contains:
A break above 2.79 would create a path toward retesting the major high.
This is the dominant resistance region:
Given the magnitude of the earlier rally, this zone is likely to contain substantial trapped supply and profit-taking.
The broad structure remains bullish because:
Nevertheless, the short-term structure has deteriorated:
Thus, the market currently has a bullish higher-timeframe structure but bearish short-term internal momentum.
Volume expanded dramatically during the large breakout:
This confirms that the move was not low-volume drift. However, high volume during a parabolic move can represent both aggressive buying and distribution. The sharp retracement from the highs suggests that at least part of the expansion was speculative and that late buyers may be trapped above current price.
Recent short-term volume is mixed:
The rebound therefore has some support, but confirmation is incomplete.
The available data suggests:
The 1-hour RSI near 30 indicates that the market experienced meaningful short-term selling pressure. This can support a bounce, but RSI alone does not establish a trend reversal.
The daily RSI near 63 shows that bullish momentum remains present, but the asset is no longer deeply discounted relative to its recent trend. The monthly high near 3.63 and the recent daily high near 3.46 demonstrate substantial upside volatility, but also significant overhead risk.
Volatility is a central feature of this market:
This makes tight leverage and narrow stop-losses particularly vulnerable to liquidation or stop hunting. A directional signal has lower reliability when the market is moving through such wide ranges.
The dominant evidence favors a cautiously bullish bias:
However, this is not a strong immediate long signal because:
The bullish case would strengthen if price:
Potential upside levels after confirmation would be:
The bullish thesis would weaken substantially if price:
Below 2.31, the next important downside area is approximately 2.13–2.15, followed by 1.92–2.01.
At approximately 2.432, PROM is sitting close to immediate resistance rather than at a clearly favorable support location.
Because this is a perpetual swap with extreme recent volatility, conservative leverage and wider invalidation levels are more appropriate than aggressive position sizing.
| Category | Assessment |
|---|---|
| Overall trend | Bullish on daily; corrective on 1H |
| Short-term momentum | Recovering but not confirmed |
| Medium-term structure | Bullish, with weakening momentum |
| Key support | 2.40–2.42, then 2.37, 2.34–2.31 |
| Key resistance | 2.43–2.45, then 2.50–2.55 |
| Market sentiment | Speculative, volatile, cautiously bullish |
| Directional bias | Neutral-bullish / cautiously bullish |
This score reflects a modest bullish bias, not a strong buy signal. The score is supported by the positive daily structure and bullish moving-average alignment, but reduced by the bearish 1-hour trend, negative 4-hour momentum shift, unresolved overhead resistance, and extreme volatility.
Practical conclusion: The larger trend favors buyers while price holds above roughly 2.37–2.40, but a stronger bullish continuation signal requires a reclaim of 2.50–2.55. A breakdown below 2.37 would shift the near-term bias bearish.
Analyzed
Aug 13, 12:31 PM
Nasdaq ETF options expansion provides structural bullish floor while immediate PPI outcome will dictate short-term direction, with net bias tilted higher due to institutional flows outweighing regulatory noise.
Current Price: $2.407 | Date: August 13, 2026
What happened: Nasdaq filed for a rule change to allow wider options trading on crypto ETFs, even as the CLARITY Act legislative effort remains stalled in Congress.
Impact on PROMUSDT: BULLISH (+)
This is a structural adoption story. Expanded ETF options activity means deeper institutional participation, tighter spreads around crypto ETFs, and a broader derivatives ecosystem — all of which typically drag spot crypto prices higher. History shows: every expansion of regulated crypto derivatives since 2024 (options, options on ETFs, etc.) has been followed by institutional inflows and upward pressure on digital assets. The CLARITY Act stall is a caveat, but the private-sector momentum continues regardless.
Key price signal: This drives a positive drift bias over the 12-72 hour window, providing a floor under downside.
What happened: Today at 14:30 CET, the US Producer Price Index prints. Markets are pausing — a strong/weak PPI reading will move the Dollar.
Impact on PROMUSDT: HIGH VOLATILITY EVENT (Bullet to watch)
This is the single most important catalyst in the next 24 hours for PROMUSDT because of the Dollar inverse relationship:
At $2.407, the market is positioned in a narrow waiting range — expect a break once the print hits at 14:30 CET.
What happened: 57 of 69 economists expect the ECB to raise deposit rates to 2.50% in September.
Impact on PROMUSDT: NEUTRAL to MILDLY BULLISH (−/+ )
Here's the nuance: ECB hiking is traditionally bearish for risk assets (tighter liquidity). However:
Key price signal: Not a near-term mover today, but a September medium-term tailwind for the Dollar-weakening trade.
What happened: SEC, CFTC, and OCC are actively pursuing new rules for digital assets, prediction markets, tokenization, and bank charters — while Congress is on recess.
Impact on PROMUSDT: SLIGHTLY BEARISH (−) [Uncertainty Premium]
Agency rulemaking without Congressional oversight creates binary risk. Two scenarios:
The market is currently discounting this as a slow-burn risk factor — it contributes to the "awaiting clarity" sentiment at conferences (see below). No immediate trigger, but it caps upside momentum.
What happened: The conference in Las Vegas described the current state as an ongoing "crypto winter" with market participants "awaiting clarity."
Impact on PROMUSDT: NEUTRAL to SLIGHTLY BEARISH (−)
Sentiment reads as subdued and cautious. No bullish catalysts emerge from this — institutional attendees appear to be waiting on the sidelines. However, with a low value score, the direct price impact is minimal. It confirms the prevailing wait-and-see posture rather than spurring new selling.
| Factor | Direction | Weight | Near-term Impact |
|---|---|---|---|
| Nasdaq ETF Options Expansion | 🟢 Bullish | Medium | +0.5-1.5% drift higher |
| PPI / Dollar Catalyst (14:30 CET) | ⚡ Binary | High | ±2-3% breakout |
| ECB September Hike | 🟡 Neutral-Positive | Low | Delayed / priced in |
| Agency Crypto Rulemaking | 🟡 Slightly Bearish | Medium | Caps upside / risk premium |
| Conference Sentiment (Crypto Winter) | 🟡 Cautious | Low | No material impulse |
Price framework (anchored to $2.407):
🕐 For the next 24-72 hours:
WAIT for the 14:30 CET PPI print. Do not enter a directional position before it. The current $2.407 price is a midpoint trap — entering now means paying the volatility premium with zero information edge.
If PPI cools (bullish scenario):
If PPI is hot (bearish scenario):
Position sizing: With binary PPI risk and regulatory uncertainty, keep leverage below 2x. The asymmetric setup favors buying the dip near $2.35 rather than chasing breakouts above $2.45 — the structural upside (ETF expansion) outweighs the macro noise.
Bottom line: PROMUSDT sits at $2.407 in a neutral holding zone. The ETF options expansion is the quiet structural bull case; the PPI print is the near-term ignition switch. The most probable path over 72 hours: a 2-4% directional move triggered by PPI, with the upside breakout toward $2.48-$2.55 slightly favored over the downside flush toward $2.33-$2.28 on the back of the Nasdaq adoption signal.
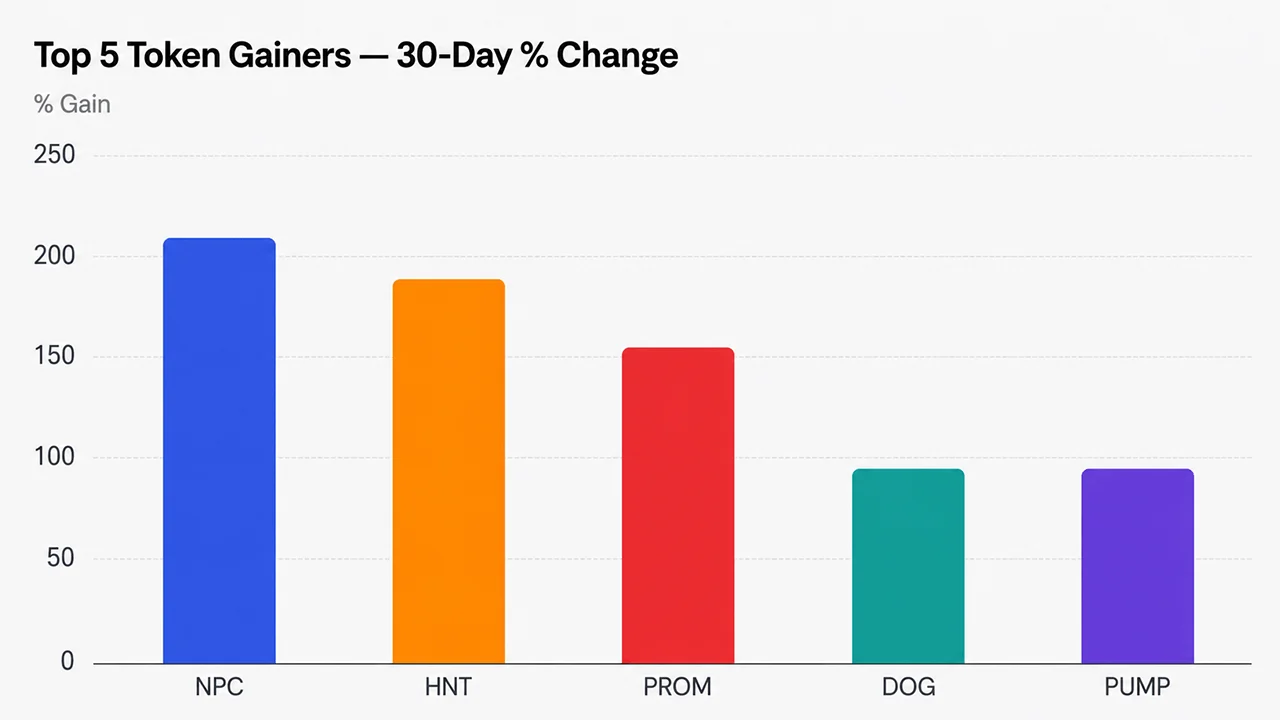
August’s Crypto Market Winners Explode as September Danger Looms
The post August’s Crypto Market Winners Explode as September Danger Looms appeared on BitcoinEthereumNews.com. Key Takeaways NPC’s price logged a massive August movement, jumping 206% and even outpacing HNT’s 188.70% price gain. KAITO went the other way, as the coin dropped 67.87% despite August being a strong month for much of the crypto economy. September could be a tougher ride for all coins. Bitcoin has finished lower in 8 of the past 13 Septembers, which could p...
Open source
PROM surges over 300% – Investors need to stay cautious as rally accelerates
The post PROM surges over 300% – Investors need to stay cautious as rally accelerates appeared on BitcoinEthereumNews.com. Prom [PROM] remains one of the leading crypto assets in the market, with the asset delivering a 48% gain in the past 24 hours alone. The surge in gains has been a build-up of weeks of bullish performance in the market. To put this into perspective, the asset has accrued a 176% gain in the past seven days, while that figure nearly doubled to 326%...
Open sourcePROM surges over 300% – Investors need to stay cautious as rally accelerates
Investors have channeled capital into long positions on PROM, but they need to watch for bears sneaking into the market.
Open source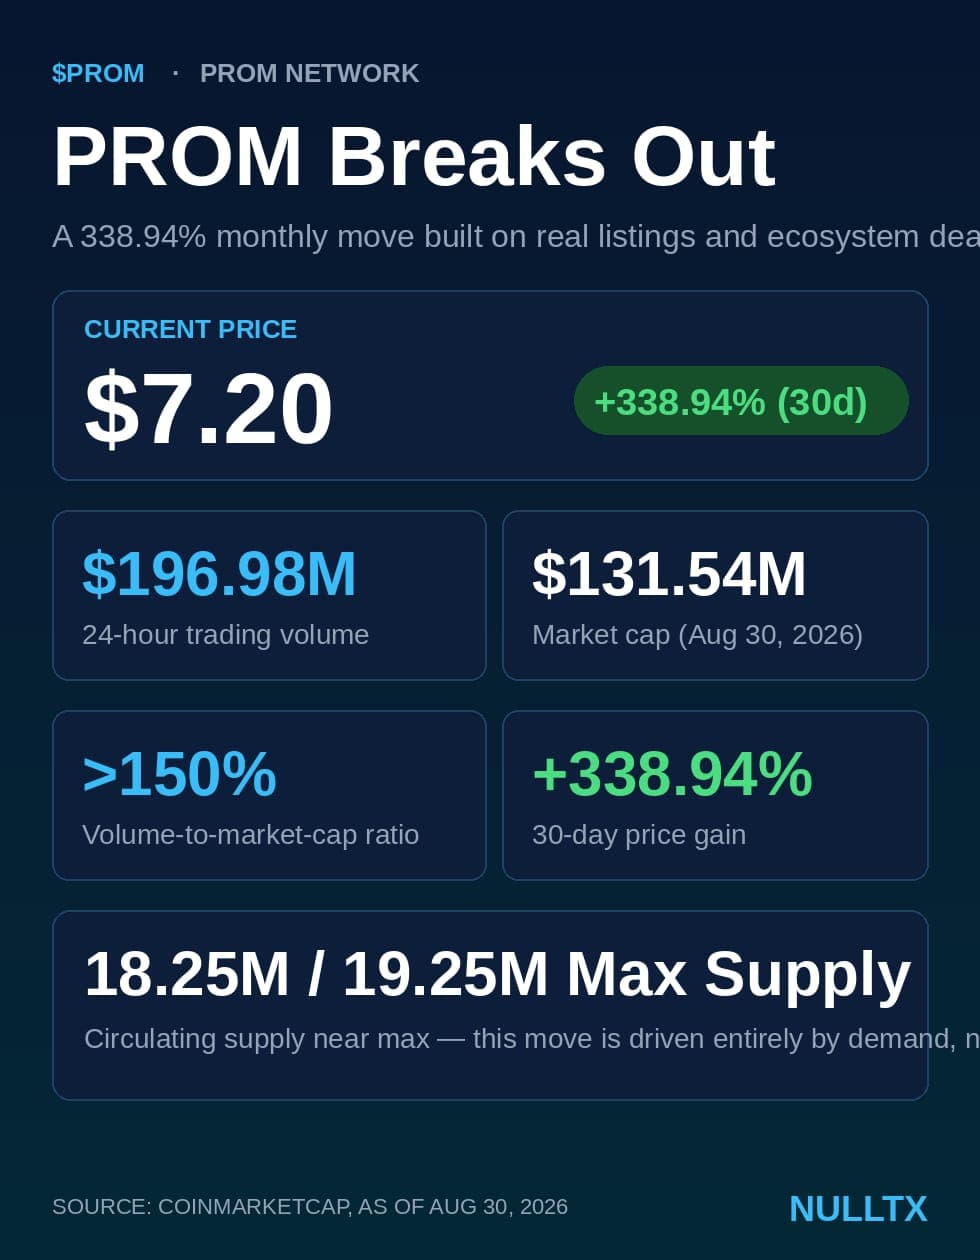
Prom (PROM) Just Went Vertical, and This Time the Old "GameFi Coin" Story Isn't the One Explaining It
I've watched a lot of old Layer 2 tokens like PROM try to manufacture a pump with a vague "AI narrative" tweet and a logo refresh, but this isn't that. PROM has been shipping actual commits and actual partnership announcements toward a specific, checkable thesis since the spring, and the chart just decided to catch up.Start with what's on the tape right now. PROM sits at $7.20, up 338.94% over the past month, with today's volume alone hitting $196.98 million against a mark...
Open sourceBrowse every supported spot and perpetual market by exchange, then launch analysis immediately.
Review how PROM performs across models under the current filter.
No trading data available for PROM
See how AI models perform on PROM, compare live markets by exchange, and choose the exact pair you want to open.
Use this page when you want to move from asset-level ranking into a specific live market.
Continue into other closely watched asset pages.
They are the live PROM markets currently available across supported exchanges. Use them to compare spot and perpetual choices, then open the market you actually want to analyze.
You will open Live with the selected market already filled in, and analysis will begin automatically. That lets you move straight from this page into the market you want to review.
Not always. A strong model on PROM does not mean every exchange and contract type behaves the same way, so this page shows both the overall model ranking and the specific markets you can open.


