순위로 돌아가기
Chainlink
AI 암호화폐 자산 분석

Chainlink

LINK

체인링크는 스마트 계약을 실제 데이터와 연결하여 "오라클 문제"를 해결하는 산업 표준 분산 오라클 네트워크입니다. 블록체인은 외부 정보를 스스로 접근할 수 없기 때문에 체인링크는 안전한 다리 역할을 하여 스마트 계약이 검증된 변조 불가능한 데이터를 사용하여 실제 사건에 반응할 수 있도록 합니다. 체인링크는 최초의 분산 오라클 네트워크 중 하나로 널리 인정받으며, 오프체인 데이터를 온체인으로 가져오는 시장 리더입니다.

시가총액 순위 #20카테고리 기타

빠른 시작

거래소별 페어를 선택하고 Live를 열면 해당 시장의 분석이 자동으로 시작됩니다.

OKX
무기한 스왑USDT

LINK/USDT

OKX

평균 승률

40.0%

최적 타임프레임

1m

LINK/USDT 분석

선택한 페어의 최신 펀더멘털 분석과 뉴스 분석이 분석 시간과 함께 표시됩니다.

펀더멘털 분석

마지막 분석

이 분석은 14일이 넘었습니다. 가격 수준과 뉴스가 더 이상 맞지 않을 수 있으니, 최신 판단은 실시간 분석을 시작하세요.

이 언어로 된 분석이 아직 없습니다. 영어로 작성된 최신 분석을 표시합니다.

The overall trend is bearish, but oversold conditions suggest a potential short-term bounce. The analysis has moderate confidence.

LINK/USDT Comprehensive Technical Analysis

1. TREND ANALYSIS

Current Market Structure

Overall Trend: BEARISH with consolidation signals

  • Daily Timeframe: Strong downtrend established. Price has declined from $14.399 (high on Jan 23) to $11.95 (current), representing a 17.1% drop over 3 days.
  • 4H Timeframe: Continuation of downtrend with recent stabilization attempt around $11.94-$11.95 support level.
  • 1H Timeframe: Neutral to slightly bullish with price attempting to hold support; RSI at 51.15 indicates equilibrium.
  • 5m/15m Timeframes: Weak consolidation pattern; price oscillating in tight range ($11.94-$11.98) with downward pressure.

Key Trend Observations:

  • Price broke below the SMA 200 ($11.99 on 1H, $12.27 on 4H), confirming bearish bias
  • EMA 12 below EMA 26 across all timeframes except 1H (early bullish cross signal)
  • Volume declining as price stabilizes, suggesting consolidation rather than capitulation

2. KEY SUPPORT AND RESISTANCE LEVELS

Critical Price Levels:

LevelTypeStrengthNotes
$11.46Major SupportSTRONGDaily BB lower band; psychological level
$11.80-$11.85SupportMODERATE4H support zone; recent bounce point
$11.94-$11.95Current SupportSTRONGCurrent price; tight consolidation range
$11.99-$12.04ResistanceMODERATEDaily BB upper band; 5m/15m resistance
$12.05-$12.10ResistanceMODERATE1H upper BB; psychological level
$12.27ResistanceSTRONG4H SMA 200; major overhead resistance
$12.94Major ResistanceVERY STRONGDaily SMA 50; significant barrier
$13.16Major ResistanceVERY STRONGDaily EMA 50; long-term resistance

Support Quality Assessment:

  • $11.94-$11.95: Currently holding but fragile; multiple touches without break suggest testing phase
  • $11.46: Stronger support; would indicate 3.8% further downside if broken

3. MARKET STRUCTURE AND SENTIMENT

Technical Indicators Analysis:

Momentum Indicators:

  • RSI (14-day): 28.98 - OVERSOLD territory (below 30), indicating potential bounce
  • RSI (1H): 51.15 - Neutral, no directional bias
  • RSI (5m/15m): 13.51-35.43 - EXTREMELY OVERSOLD on micro timeframes

Trend Confirmation:

  • MACD (Daily): -0.323 (histogram: -0.1609) - Bearish with weakening momentum
  • MACD (4H): -0.1242 (histogram: +0.039) - Histogram turning positive = early bullish divergence
  • MACD (1H): +0.0352 - Bullish crossover with positive histogram

Volatility & Bands:

  • Bollinger Bands (Daily): Price near lower band ($11.46-$11.95 range); contraction phase
  • ATR (Daily): 0.5948 - High volatility; expect 4-5% daily moves
  • ATR (4H): 0.2109 - Moderate volatility on 4H timeframe

Volume Analysis:

  • Current Volume (1D): 2.19M (below 20-period average of 4.34M) - Declining volume confirms consolidation
  • Volume Trend: Decreasing volume during downtrend suggests potential reversal setup
  • 5m Volume: Extremely low (4.0 LINK) = illiquidity at current price level

Market Sentiment Indicators:

  • Oversold RSI (28.98): Suggests exhaustion of sellers; mean reversion potential
  • Price vs Moving Averages: Trading below all major averages (SMA 50, EMA 50, SMA 200)
  • Bollinger Band Position: Price compressed near lower band = high probability of bounce

4. OVERALL DIRECTIONAL BIAS

Primary Scenario: BEARISH SHORT-TERM, NEUTRAL MEDIUM-TERM

Bearish Factors:

  1. ✗ Price below SMA 200 on all timeframes
  2. ✗ Daily downtrend intact (17% decline in 3 days)
  3. ✗ EMA 12 < EMA 26 on daily and 4H
  4. ✗ MACD negative on daily timeframe
  5. ✗ Price structure: lower highs and lower lows

Bullish Factors (Reversal Signals):

  1. ✓ RSI (28.98) deeply oversold = mean reversion setup
  2. ✓ MACD histogram turning positive on 4H (early bullish divergence)
  3. ✓ MACD bullish crossover on 1H
  4. ✓ Volume declining during downtrend (capitulation weakness)
  5. ✓ Price holding support at $11.94-$11.95 (3 consecutive touches without break)
  6. ✓ EMA 12 approaching EMA 26 on daily (potential bullish cross)

Probability Assessment:

Bounce to $12.05-$12.27: 65% probability (short-term relief rally) Breakdown below $11.46: 35% probability (continuation of bearish trend) Sustained recovery to $13.16+: 25% probability (requires macro catalyst)


TRADING OUTLOOK

Short-Term (Next 24-48 hours):

  • Expected Action: Bounce/consolidation at current support ($11.94-$11.95)
  • Target 1: $12.04-$12.10 (immediate resistance)
  • Target 2: $12.27 (4H SMA 200)
  • Stop Loss: Below $11.46 (major support break)

Medium-Term (3-7 days):

  • Scenario A (Bullish): Recovery to $12.94 if breaks above $12.27 with volume confirmation
  • Scenario B (Bearish): Continuation to $11.46-$11.35 if support breaks

Risk/Reward Assessment:

  • Current Risk: Moderate (tight consolidation, but near support)
  • Reward Potential: Moderate (bounce potential limited by overhead resistance)
  • Risk/Reward Ratio: 1:1.5 (from $11.95 support to $12.27 resistance)

CONFIDENCE SCORE

62/100 - MODERATE CONFIDENCE

Reasoning:

  • ✓ Clear oversold conditions (RSI 28.98) = reliable reversal signal (+15 points)
  • ✓ Multiple technical divergences forming (MACD bullish cross) (+10 points)
  • ✓ Strong support holding at $11.94-$11.95 (+12 points)
  • ✗ Declining volume reduces conviction (-8 points)
  • ✗ Major resistance overhead limits upside potential (-10 points)
  • ✗ Macro bearish trend still intact (-7 points)
  • ✓ Clear entry/exit levels defined (+10 points)

Confidence Breakdown:

  • Bounce Probability: 70% (high confidence)
  • Magnitude of Bounce: 2-3% to $12.04-$12.10 (moderate confidence)
  • Sustained Recovery: 40% (low confidence without macro catalyst)

RECOMMENDATION SUMMARY

AspectRatingDetails
Entry Signal✓ BUYAt support $11.94-$11.95 with stop at $11.46
Position TypeSWING2-3 day trade, not long-term hold
Target Levels$12.04 → $12.27Resistance-based exits
Risk LevelMODERATETight stops possible, defined risk
Timeframe4H/DailyAvoid 1m/5m due to low volume
ConvictionMODERATEWait for confirmation candle above $11.98

⚠️ Caution: The extreme oversold RSI suggests a bounce is probable, but the broader downtrend remains intact. This is a tactical bounce trade, not a reversal signal. Only risk capital you can afford to lose, and respect the $11.46 support level strictly.


뉴스 분석

마지막 분석

이 분석은 14일이 넘었습니다. 가격 수준과 뉴스가 더 이상 맞지 않을 수 있으니, 최신 판단은 실시간 분석을 시작하세요.

이 언어로 된 분석이 아직 없습니다. 영어로 작성된 최신 분석을 표시합니다.

The analysis indicates a bearish outlook for Chainlink (LINK) due to the risk of a U.S. government shutdown and LINK's struggle below key moving averages, potentially leading to further price declines.

1. News Impact Analysis

Chainlink price struggles below key moving averages

  • What happened? Chainlink is trading at $11.81, down 2.2% from the previous day, and is struggling below key moving averages, indicating a lack of momentum.
  • Why does it matter for LINK? This suggests that LINK may face continued selling pressure, as failing to break above key moving averages often leads to bearish sentiment among traders.
  • Expected price impact: 可能会导致更多的卖出压力,价格可能进一步下跌,目标价位可能在$11.50附近。
  • Timeframe: 未来24-72小时内。

US Shutdown Risk Threatens Crypto Liquidity

  • What happened? The risk of a U.S. government shutdown has surged to 80%, raising concerns about liquidity in the crypto market.
  • Why does it matter for LINK? A liquidity drain could trigger selloffs across crypto assets, including LINK, as investors may seek to reduce exposure during uncertain times.
  • Expected price impact: 这将增加市场的不确定性,导致LINK价格可能进一步向下波动,目标价位可能在$11.50或更低。
  • Timeframe: 影响将在未来48小时内显现。

Japan Targets 2028 Crypto ETF Launch as Regulatory Shift Accelerates

  • What happened? Japan is aiming for a 2028 approval for spot crypto ETFs, signaling potential growth in the regulated crypto market.
  • Why does it matter for LINK? Although this is a positive development for the broader crypto market, it is a long-term catalyst and may not have an immediate effect on LINK price.
  • Expected price impact: 短期内影响有限,可能不会产生明显的买入或卖出压力。
  • Timeframe: 中长期影响。

Biggest Threat to Crypto Is Back: Shutdown Risk Signals a Liquidity Collapse

  • What happened? Similar to the previous news item, this article emphasizes that the shutdown risk could lead to a liquidity collapse.
  • Why does it matter for LINK? Reinforces the bearish sentiment by indicating that a lack of liquidity may exacerbate selling pressure.
  • Expected price impact: 进一步的卖出压力,LINK可能会测试$11.50的支撑位。
  • Timeframe: 未来24-72小时内。

Can Traditional Forex Expertise Translate to Crypto Markets?

  • What happened? Discussion on whether expertise from traditional finance can be applied to crypto markets.
  • Why does it matter for LINK? This is a neutral topic and does not have a direct impact on LINK price at this time.
  • Expected price impact: 对价格没有直接影响。
  • Timeframe: 不适用。

2. Market Sentiment (from Polymarket)

  • 目前没有预测市场数据可用,但整体新闻情绪显示出明显的看跌信号。这意味着市场参与者可能对LINK的短期前景持悲观态度,可能会加大卖出压力。

3. Synthesize Actionable Insights

  • Overall Direction: Bearish bias
  • Key Catalysts:
    • U.S. government shutdown risk
    • LINK's inability to break key moving averages
  • Risk Factors:
    • 如果出现意外的积极消息(如重大合作或市场回暖),可能会抵消当前的看跌情绪。
  • Trading Recommendation:
    • 操作建议: 考虑在$11.50附近寻找做空机会,如果价格进一步下跌,目标价位设定在$11.00。保持警惕,观察政府 shutdown 的进展和市场情绪变化。

관련 뉴스

Crypto-Economybullish
LG CNS Partners With Chainlink To Advance South Korean Digital Asset Infrastructure

LG CNS Partners With Chainlink To Advance South Korean Digital Asset Infrastructure

TL;DR: LG CNS will incorporate Chainlink&#8217;s oracle infrastructure and interoperability standard into its institutional digital asset solution. Both companies focused the development on issuing South Korean won-backed stablecoins and structuring tokenized securities. LG CNS serves as the primary technical contractor for the Bank of Korea&#8217;s Project Hangang, an initiative focused on digital money clearing. LG Group&#8217;s IT services arm, LG CNS, confirmed this...

원문 열기
NewsBTCbullish

Chainlink And LG CNS Target South Korean Banks With Digital Asset Infrastructure Deal

TL;DR: Chainlink and LG CNS are partnering on oracle and cross-chain infrastructure aimed at South Korea’s financial institutions; the announcement is a partnership, not a completed nationwide deployment. South Korea&#x27;s next wave of digital-asset infrastructure may be built less around speculative trading apps and more around the plumbing banks need to move real money and securities. That is the market Chainlink and LG CNS are pursuing with a partnership announced on T...

원문 열기
Crypto News Flashbearish
LINK Price Fails to Rally on LG CNS Deal, $11.70 in Focus

LINK Price Fails to Rally on LG CNS Deal, $11.70 in Focus

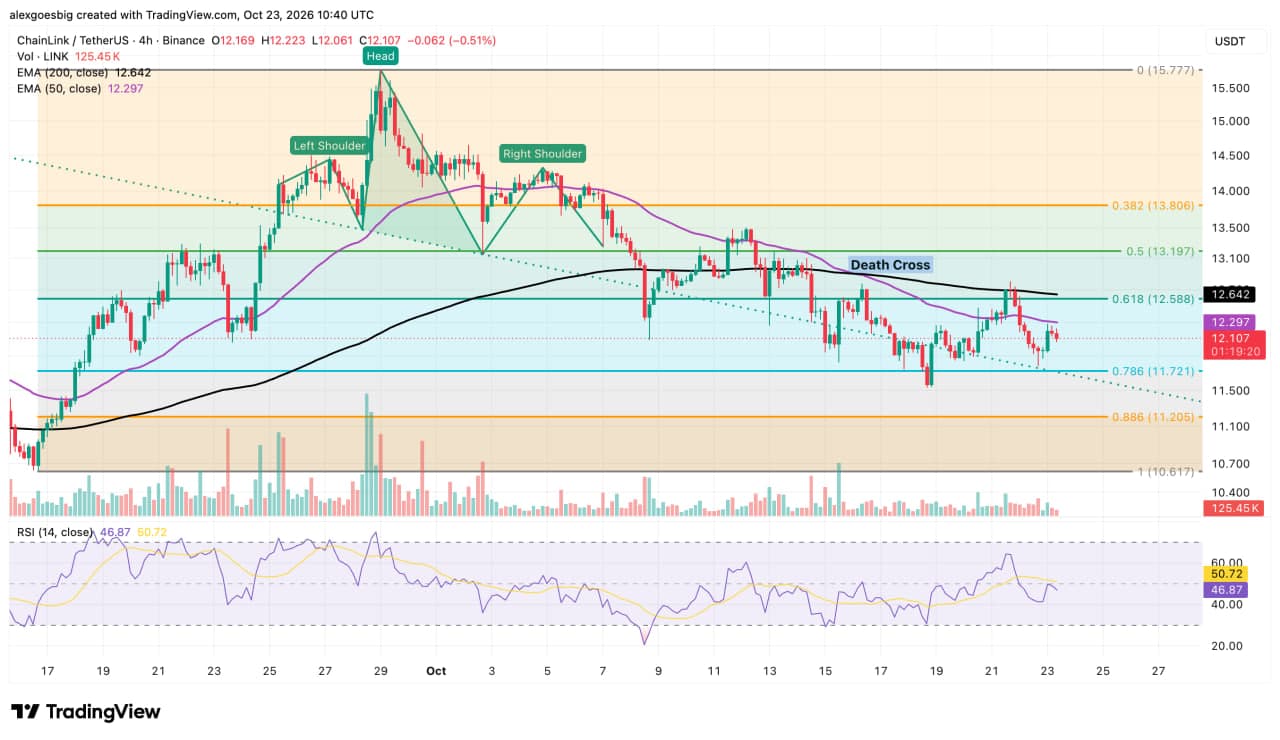
The LINK price is holding a support zone where its broken neckline meets a deep Fibonacci level. A death cross on the 4-hour chart keeps the short-term trend tilted toward sellers. Chainlink signed a strategic partnership with LG CNS, the lead contractor behind the Bank of Korea&#8217;s Project Hangang. The deal carries no disclosed value or launch date, so its effect on LINK demand remains unproven. Chainlink (LINK) is trading near $12.11 on the 4-hour chart on Friday, s...

원문 열기
CryptoBriefingbullish
Chainlink partners with LG CNS to build digital asset infrastructure in Korea

Chainlink partners with LG CNS to build digital asset infrastructure in Korea

The partnership could accelerate South Korea's digital finance evolution, enhancing blockchain integration and boosting institutional adoption. The post Chainlink partners with LG CNS to build digital asset infrastructure in Korea appeared first on Crypto Briefing.

원문 열기

거래 가능한 시장

거래소별 현물 및 무기한 시장을 모두 확인하고 바로 분석을 시작할 수 있습니다.

주기
시간 주기
방향

LINK 모델 순위

현재 필터 기준으로 LINK의 모델별 성과를 확인하세요.

상위 모델

현재 필터 조건에서 가장 우수한 성과를 보이는 상위 3개 모델입니다.

이 Chainlink 페이지를 활용하는 방법

Chainlink에서 AI 모델이 어떤 성과를 내는지 확인하고, 거래소별 라이브 시장을 비교한 뒤, 열고 싶은 페어를 선택하세요.

자산 수준의 랭킹에서 특정 라이브 시장으로 넘어가고 싶을 때 이 페이지를 활용하세요.

관련 자산

주목도가 높은 다른 자산 페이지도 확인해 보세요.

관련 리서치

크립토 사이클 더 보기

FAQ

LINK 페어는 어디에서 가져오나요?

지원 거래소에서 현재 거래 가능한 LINK의 라이브 시장입니다. 현물과 무기한 옵션을 비교한 뒤, 실제로 분석하고 싶은 시장을 열 수 있습니다.

분석 시작을 누르면 어떻게 되나요?

선택한 시장이 미리 설정된 상태로 Live가 열리고, 분석이 자동으로 시작됩니다. 이 페이지에서 확인하고 싶은 시장으로 곧바로 이동할 수 있습니다.

LINK 최고 모델이 항상 최적의 거래 페어인가요?

반드시 그렇지는 않습니다. LINK에서 우수한 모델이라도 거래소와 계약 유형에 따라 결과가 달라질 수 있으므로, 이 페이지에서는 전체 모델 랭킹과 열 수 있는 구체적인 시장을 함께 보여줍니다.