Bitcoin cinsinden Ether'ın on yıllık verisi aslında ne söylüyor
30 Temmuz 2026'da bir Ether 0,02963 Bitcoin değerindeydi. ETH/BTC oranının tamamı bu: dolar fiyatı değil, piyasa değeri değil, yalnızca tek bir Ether'in kaç Bitcoin satın aldığı. Kulağa niş bir sayı gibi geliyor. Oysa pratikte kripto dünyasının en çok tartışılan rakamı, çünkü Bitcoin yerine Ethereum tutmanın doğru karar olup olmadığını bu sayı belirliyor.
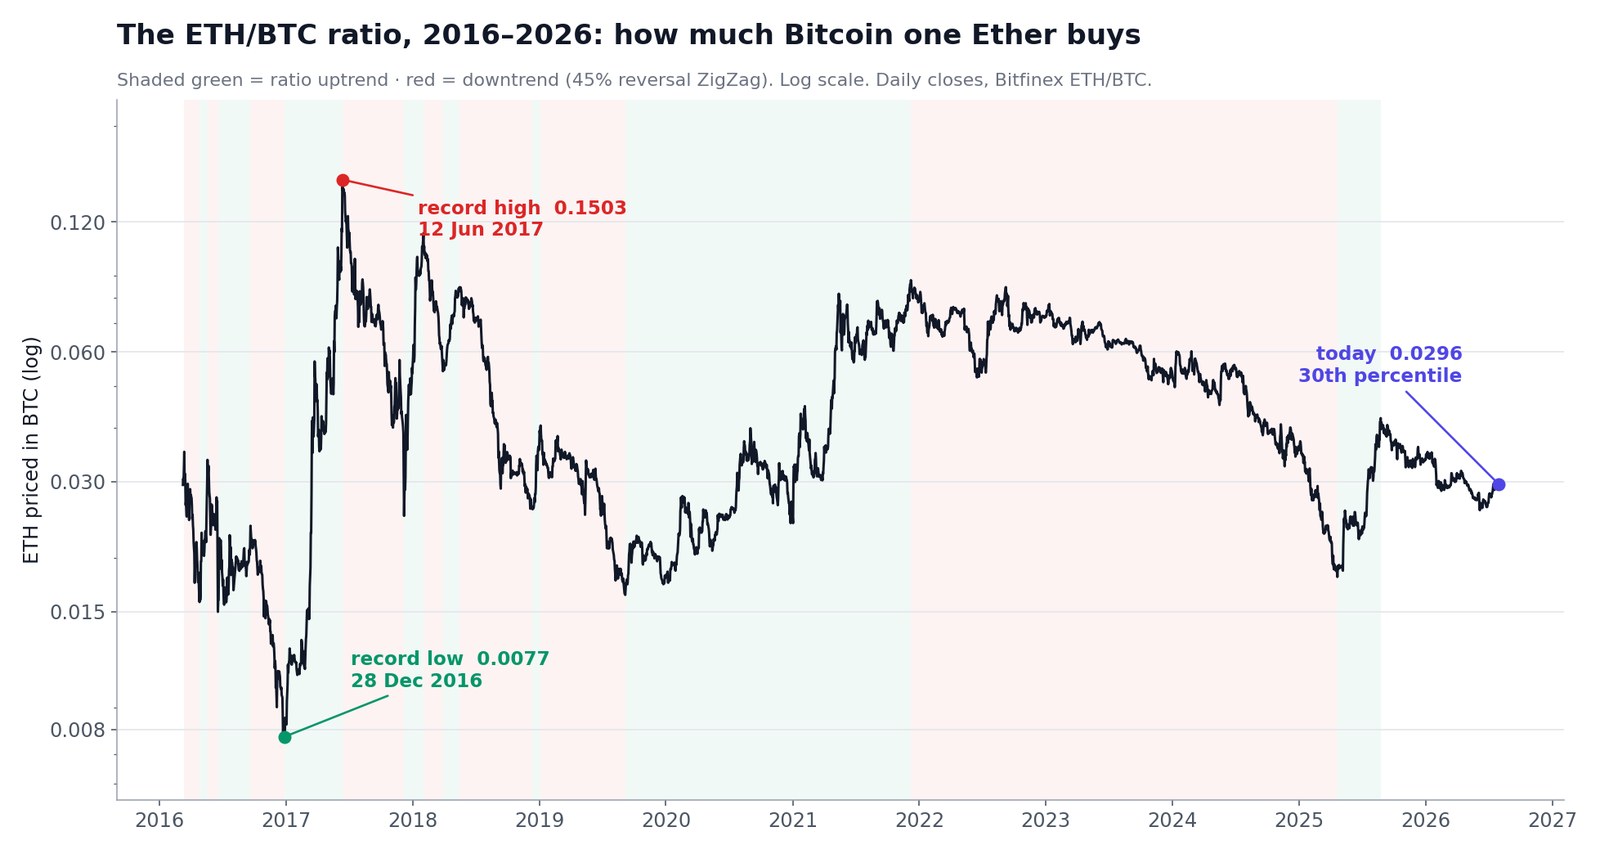
Bugünkü okuma, Mart 2016'dan bu yana bütün seansların 30. yüzdelik diliminde duruyor — son on yılın %70'inden daha ucuz ve 12 Haziran 2017'de kaydedilen tüm zamanların zirvesinin %80,3 altında. Ether uzun süredir Bitcoin karşısında ucuz ve akla gelen soru şu: bunun bir anlamı var mı?
Bu bir veri yazısı, tahmin yazısı değil. Aşağıdaki her rakam günlük kapanışlardan hesaplandı ve yöntem sonda açıkça anlatılıyor; kendiniz yeniden üretebilirsiniz.
ETH/BTC oranı gerçekte neyi ölçüyor
Oran basitçe ETH fiyatının BTC fiyatına bölümü. Yükseldiğinde Ether Bitcoin'i geçiyor; düştüğünde Bitcoin kazanıyor. İki bacak da kripto olduğu için oran, her dolar grafiğine hâkim olan unsuru — genel kripto döngüsünü — devre dışı bırakıyor ve geriye yalnızca göreli soruyu bırakıyor.
Bu da onu, yatırımcıların gerçekten önemsediği birkaç konuda elimizdeki en temiz okuma hâline getiriyor:
- Kripto içindeki risk iştahı. Sermayenin Bitcoin'den Ether'a (oradan da daha küçük varlıklara) rotasyonu tarihsel olarak önce burada görünür. Bitcoin hâkimiyet döngüleri ve altseason'ın ne zaman başladığına dair referansımız aynı rotasyonu hâkimiyet tarafından izliyor.
- "Ethereum öldü" ifadesinin fiyat mı yoksa ağ hakkında mı olduğu. Oran bir fiyat ifadesidir. Kullanım, ücretler ya da Ethereum yol haritası hakkında hiçbir şey söylemez.
- Göreli değer girişleri. Nasılsa kripto tutacaksanız, oran size piyasanın çiftin hangi tarafını iskonto ettiğini söyler.
Ölçmediği şey ise kârdır. Bu ayrım sanılandan çok daha önemli çıkıyor; aşağıda ona geri döneceğiz.
2016'dan bu yana her büyük ETH/BTC döngüsü
Aşağıda tam döngü tablosu var. Dönüm noktaları günlük kapanışlar üzerinde %45 dönüş eşiğine sahip ZigZag ile belirlendi: bir salınım zirvesi ancak oran oradan %45 gerilediğinde, bir salınım dibi ancak %45 yükseldiğinde onaylanıyor. Bu eşik bilerek kaba seçildi: sıradan dalgalanmayı yok sayıp aralığı gerçekten yeniden tanımlayan hareketleri yalıtıyor. On altı bacak bu ölçütü karşılıyor.
| # | Yön | Başlangıç | Bitiş | Gün | Oran | Oran değişimi | ETH dolar | BTC dolar |
|---|---|---|---|---|---|---|---|---|
| 1 | Düşüş | 13 Mar 2016 | 26 Nis 2016 | 44 | 0,0352 → 0,0158 | −%55,1 | −%48,7 | +%13,7 |
| 2 | Yükseliş | 26 Nis 2016 | 19 May 2016 | 23 | 0,0158 → 0,0337 | +%113,5 | +%98,1 | −%7,2 |
| 3 | Düşüş | 19 May 2016 | 18 Haz 2016 | 30 | 0,0337 → 0,0150 | −%55,5 | −%23,1 | +%74,3 |
| 4 | Yükseliş | 18 Haz 2016 | 20 Eyl 2016 | 94 | 0,0150 → 0,0237 | +%58,3 | +%26,2 | −%20,8 |
| 5 | Düşüş | 20 Eyl 2016 | 28 Ara 2016 | 99 | 0,0237 → 0,0077 | −%67,5 | −%46,6 | +%63,6 |
| 6 | Yükseliş | 28 Ara 2016 | 12 Haz 2017 | 166 | 0,0077 → 0,1503 | +%1.851,1 | +%4.980,2 | +%161,8 |
| 7 | Düşüş | 12 Haz 2017 | 07 Ara 2017 | 178 | 0,1503 → 0,0250 | −%83,4 | +%7,3 | +%546,4 |
| 8 | Yükseliş | 07 Ara 2017 | 01 Şub 2018 | 56 | 0,0250 → 0,1129 | +%351,6 | +%149,4 | −%44,7 |
| 9 | Düşüş | 01 Şub 2018 | 29 Mar 2018 | 56 | 0,1129 → 0,0541 | −%52,1 | −%62,9 | −%22,7 |
| 10 | Yükseliş | 29 Mar 2018 | 16 May 2018 | 48 | 0,0541 → 0,0847 | +%56,6 | +%84,0 | +%17,5 |
| 11 | Düşüş | 16 May 2018 | 12 Ara 2018 | 210 | 0,0847 → 0,0259 | −%69,4 | −%87,0 | −%57,6 |
| 12 | Yükseliş | 12 Ara 2018 | 05 Oca 2019 | 24 | 0,0259 → 0,0405 | +%56,2 | +%72,3 | +%10,6 |
| 13 | Düşüş | 05 Oca 2019 | 06 Eyl 2019 | 244 | 0,0405 → 0,0164 | −%59,5 | +%7,0 | +%163,4 |
| 14 | Yükseliş | 06 Eyl 2019 | 08 Ara 2021 | 824 | 0,0164 → 0,0879 | +%435,8 | +%2.522,3 | +%390,1 |
| 15 | Düşüş | 08 Ara 2021 | 21 Nis 2025 | 1.230 | 0,0879 → 0,0181 | −%79,5 | −%64,4 | +%73,2 |
| 16 | Yükseliş | 21 Nis 2025 | 24 Ağu 2025 | 125 | 0,0181 → 0,0421 | +%133,2 | +%203,2 | +%30,0 |
Bu tablodan dört şey doğrudan çıkıyor.
Düşüş bacakları yükseliş bacaklarının yaklaşık iki katı sürüyor. Medyan yükseliş bacağı 75 gün sürüp +%123 getirdi; medyan düşüş bacağı 139 gün sürüp −%64 kaybettirdi. Ether'ın üstün performansı kısa ve şiddetli patlamalarla gelir; geride kalışı ise yavaş yavaş öğütür.
2021–2025 düşüşü bambaşka bir canlıydı. 15. bacak 1.230 gün sürdü — 1'den 13'e kadarki bacakların toplamından uzun — ve oranı %79,5 aşağı çekti. Kayıtlarda süre bakımından buna yaklaşan başka bir bacak yok. ETH/BTC'ye dair zihinsel modeliniz Aralık 2021'den sonra oluştuysa yalnızca tek bir rejim gördünüz demektir.
Rekor zirve ile rekor dip arasında altı ay var. Oran 28 Aralık 2016'da 0,0077 ile dip yaptı ve 12 Haziran 2017'de 0,1503 ile zirve gördü — 166 günde 19,5 katlık bir hareket. Oranın "olması gereken" seviyesine dair her iddia, altı ay içinde 19 katlık bir aralığı kat etmiş olması gerçeğine dayanmak zorunda.
7. bacak, ezberlenmesi gereken bacak. Haziran–Aralık 2017 arasında oran %83,4 düştü — kayıtlardaki en kötü ikinci çöküş — ve bu sırada Ether dolar bazında %7,3 yükseldi. O dönemde ETH tutan herkes aynı anda hem para kazandı hem de geride kaldı. Bu da bizi bu veri setindeki en faydalı bulguya götürüyor.
Düşen oran, para kaybetmekle aynı şey değildir
ETH/BTC yorumlarının çoğu tam burada yanılıyor. Gerileyen oran, Ether'ın kötü bir pozisyon olduğunun kanıtı sayılıyor; oysa söylediği tek şey Ether'ın Bitcoin'den daha kötü bir pozisyon olduğu.
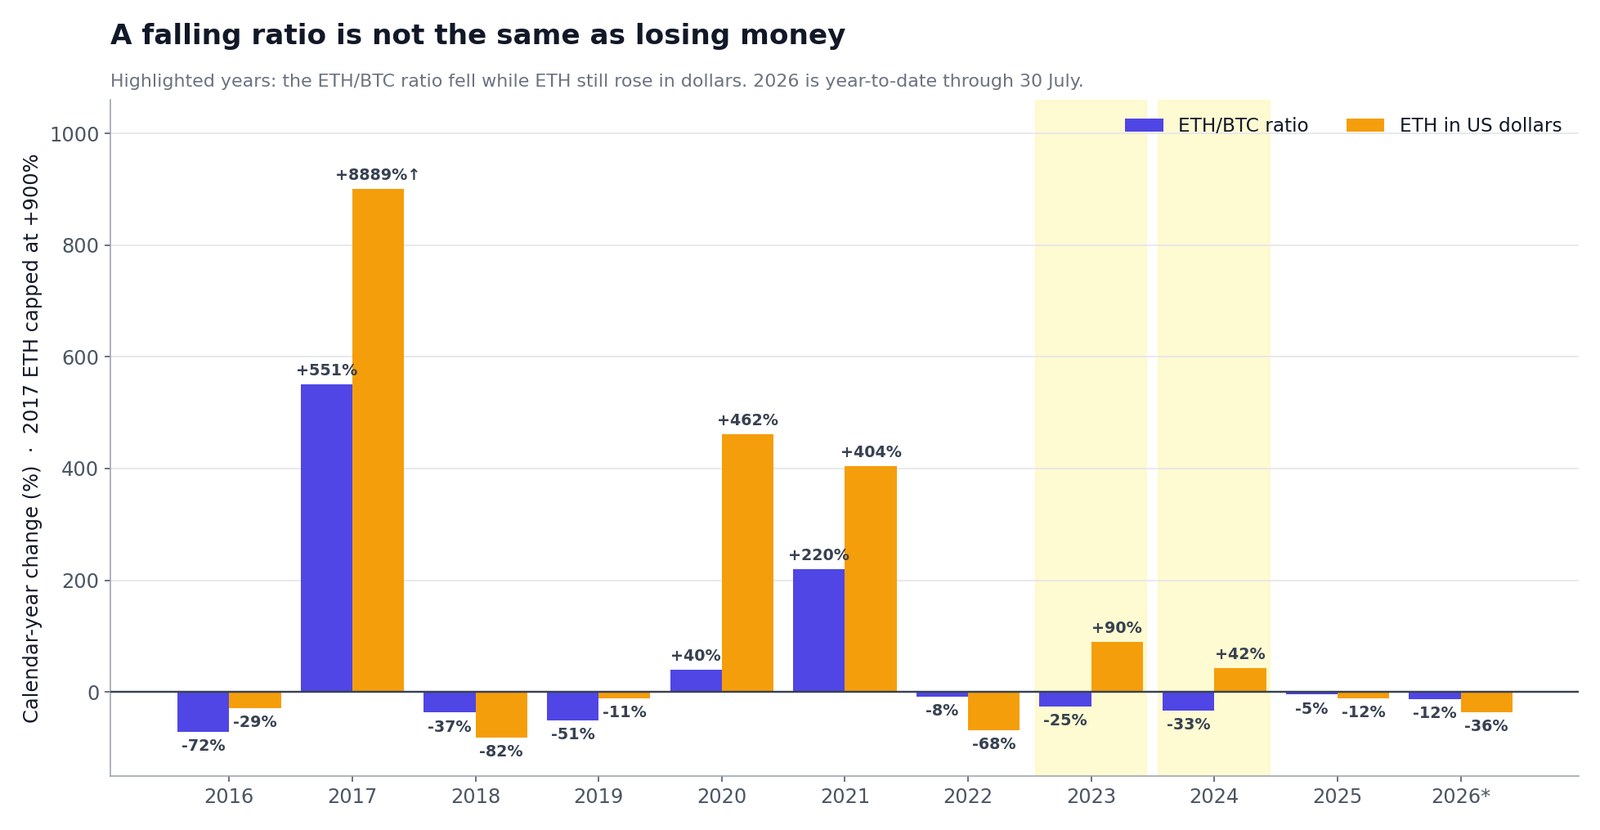
2016'dan bu yana her 365 günlük kayan pencereyi ölçtük. Bunların 1.912'sinde oran düştü. Ve bu pencerelerin 891'inde — %47'sinde — Ether aynı pencerede dolar bazında yine de yükselmişti. Neredeyse yarı yarıya, "ETH, BTC karşısında kan kaybediyor" ile "ETH tutanlar para kazandı" aynı anda doğruydu.
Takvim yılı görünümü bunu somutlaştırıyor:
| Yıl | ETH/BTC oranı | ETH dolar | BTC dolar |
|---|---|---|---|
| 2016 | −%71,7 | −%28,5 | +%134,0 |
| 2017 | +%551,0 | +%8.889,4 | +%1.278,3 |
| 2018 | −%36,9 | −%81,9 | −%71,4 |
| 2019 | −%50,9 | −%10,7 | +%81,9 |
| 2020 | +%40,0 | +%462,0 | +%301,2 |
| 2021 | +%220,3 | +%404,2 | +%57,5 |
| 2022 | −%8,4 | −%68,2 | −%65,3 |
| 2023 | −%25,3 | +%90,1 | +%154,3 |
| 2024 | −%33,0 | +%42,3 | +%112,2 |
| 2025 | −%4,5 | −%11,6 | −%7,4 |
| 2026 yılbaşından beri* | −%12,4 | −%36,1 | −%27,0 |
30 Temmuz 2026 itibarıyla.
2023 ve 2024'te oran sırasıyla dörtte bir ve üçte bir düştü — ve Ether dolar bazında +%90,1 ile +%42,3 getirdi. Bir ETH sahibinin yaşadığı daha iyi iki yıl, oran grafiğinde kesintisiz bir kayışın parçasıydı.
Tablonun diğer yarısı daha az rahatlatıcı: oran son 11 takvim yılının 8'inde düştü, yalnızca üçünde yükseldi. Bu, sabit bir merkez etrafında ortalamaya dönen bir osilatör değil; tüm örneklem boyunca, ara sıra patlamalı karşı hareketler içeren düşüş yönlü bir seri.
Yüzdelik dilim kuralı: oranın seviyesi neyi öngördü
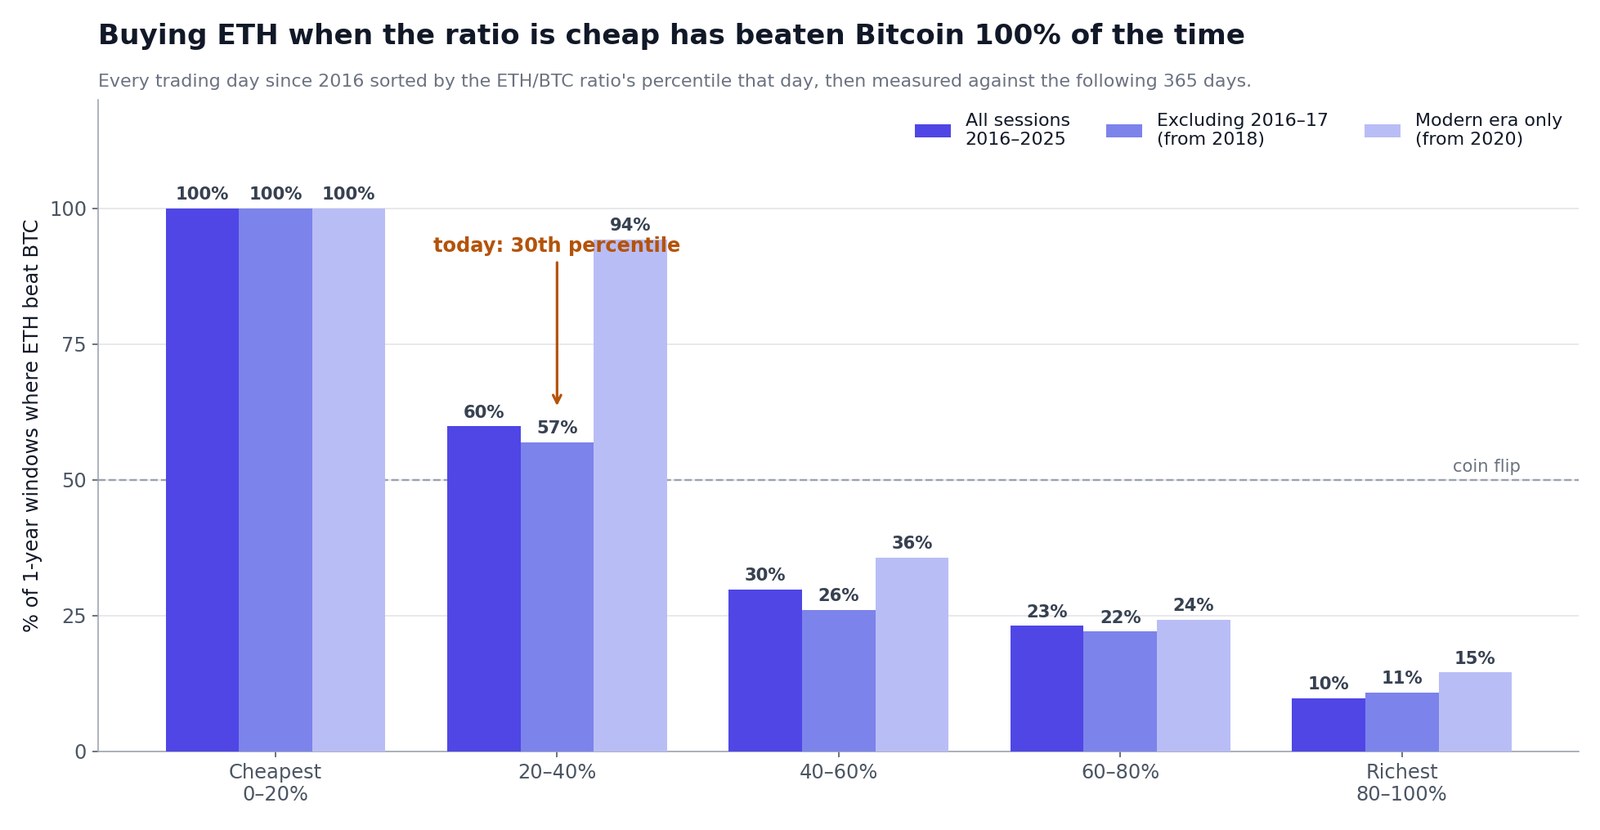
Oran bir göreli değer ölçüsüyse, dürüst sınama şudur: seviyesi, göreli performansı öngördü mü? Bunu doğrudan test ettik: 2016'dan bu yana her işlem gününü alıp o günkü oranı tüm tarihe göre sıraladık, beş yüzdelik dilime ayırdık ve sonraki 365 günü ölçtük.
| Girişteki oran dilimi | Pencere | Sonraki yıl ETH'nin BTC'yi geçme oranı | ETH +1y medyan | BTC +1y medyan |
|---|---|---|---|---|
| En ucuz %0–20 | 758 | %100 | +%873,2 | +%284,6 |
| %20–40 | 543 | %60 | +%62,8 | +%68,4 |
| %40–60 | 608 | %30 | +%25,5 | +%55,6 |
| %60–80 | 758 | %23 | +%21,6 | +%65,3 |
| En pahalı %80–100 | 757 | %10 | −%31,4 | +%23,0 |
İlişki monoton ve eğimi dik. Oran en ucuz beşte birindeyken Ether almak, sonraki yıl 758 pencerenin tamamında istisnasız Bitcoin'i geçti. En pahalı beşte birde almak Bitcoin'i %10 oranında geçti ve vakaların %61'inde doğrudan zarar ettirdi.
Akla gelen itiraz, en ucuz dilimin 2017 çılgınlığının hemen öncesine denk gelen 2016 tarihleriyle dolu olması. Haklı bir itiraz; bu yüzden erken yılları çıkarıp testi iki kez daha çalıştırdık:
| Örneklem | En ucuz %20 BTC'yi geçti | En pahalı %20 BTC'yi geçti |
|---|---|---|
| Tüm seanslar (2016–2025 girişleri) | %100 | %10 |
| 2016–17 hariç (2018'den itibaren girişler) | %100 | %11 |
| Yalnızca modern dönem (2020'den itibaren) | %100 | %15 |
| — 2016/17 hariç ETH +1y medyan | +%117,3 | −%39,8 |
2017 çıkarılınca büyüklükler epey küçülüyor — 2016/17 hariç medyan +%873'ten +%117'ye iniyor — ama yön her kesitte ayakta kalıyor. Oran ucuzsa ETH öne geçiyor; pahalıysa geride kalıyor. Bulgu bu.
Oran şu anda nerede
Bugünkü 0,02963, 30. yüzdelik dilime — yani %20–40 dilimine — düşüyor. Tarihsel olarak bu dilim yazı turaya yakın: Ether sonraki bir yılda Bitcoin'i tüm örneklemde %60, 2016–17 hariç %57 oranında geçti. Yazı turadan iyi ama en ucuz dilimin tam isabetiyle kıyaslanamaz.
Son dönemki güzergâh da önemli. Oran 24 Ağustos 2025'te 0,0421 ile zirve yaptı, 6 Haziran 2026'da 0,02578 ile dip gördü (−%38,8) ve o dipten bu yana +%14,9 toparladı. Hâlâ Ağustos 2025 zirvesinin %29,7 altında; yani mevcut bacak hiçbir yönde %45 eşiğini aşmış değil — çözülmüş bir döngü değil, açık ve teyit edilmemiş bir salınım. Son 30 günde oran +%10,5, Ether +%22,2, Bitcoin +%10,6.
Dolar tarafındaki bağlam: 30 Temmuz 2026'da Ether 1.920,90 dolardan, Bitcoin 64.840 dolardan kapandı. İkisi de yılbaşından beri ekside — ETH −%36,1, BTC −%27,0 — şahin bir Fed'in ve savaş kaynaklı risk priminin hâkim olduğu bir piyasada; Bitcoin'in 66 bin doların üzerine dönüşünde ve CLARITY Yasası'nın getirdiği düzenleyici sıfırlamada izlediğimiz aynı güçler.
İşaretlenmeye değer üç seviye
| Seviye | Nedir | Neden önemli |
|---|---|---|
| 0,02578 | 6 Haziran 2026 dibi | Mevcut bacağın tabanı; altında bir günlük kapanış 2025'in 0,0181 diplerini yeniden açar |
| 0,0296 | Bugün | 30. yüzdelik dilim — "ölçülü ucuz" diliminin sınırı |
| 0,0421 | 24 Ağustos 2025 zirvesi | Üzerinde bir kapanış 16. bacağın yeniden başladığını teyit eder ve 2025–26 düşüşünü bitirir |
0,0332'nin üzerinde oran %20–40 diliminden çıkıp aralığının orta üçte birine girer; orada tarihsel üstünlük Ether'ın aleyhine döner. 0,0421'in üzerinde 16. bacak doğrudan yeniden başlar. 0,0250'nin altında en ucuz dilime geri düşer — 758 pencerelik örneklemde bir yıllık ölçekte Bitcoin'e hiç yenilmemiş tek dilim — ve 0,0181'in altında on yılın en düşüğünü kaydeder.
Bunu bütün gün grafiğe bakmadan nasıl takip edersiniz
Oran önce yavaş, sonra bir anda hareket eder; bu tam da izlemek yerine otomatikleştirilmesi gereken türden bir şey.
- SimianX AI çiftin iki bacağında da çok ajanlı analiz çalıştırır — teknik, temel, haber ve bir karar ajanı — böylece ETH ile BTC'yi birbirinden kopuk iki grafik penceresi yerine aynı çerçeveden okursunuz.
- Yapay Zekâ Model Liderlik Tablosu — 6 sağlayıcıdan 30 yapay zekâ modeli gerçek pozisyonlarla işlem yapıyor; duyguyu tahmin etmek yerine hangi modellerin gerçekten ETH tarafında, hangilerinin BTC tarafında olduğunu görebilirsiniz.
- Canlı analiz oturumu — ETH-USDT veya BTC-USDT üzerinde bir oturum başlatın ve ajanların yukarıda listelenen seviyeleri tek tek işlemesini izleyin.
- SimianX Autopilot analizi sizin belirlediğiniz takvimde yeniden çalıştırır ve "oran 0,0421'in üzerinde kapanır" gibi bir koşul gerçekten oluştuğunda haber verir.
- Piyasa Nabzı kripto ve hisse tarafındaki 52 haftalık ve 30 günlük uç değerleri oluştukları anda işaretler.
Bu tür kararlarda tarihsel olarak hangi modellerin haklı çıktığını merak ediyorsanız, tam skor tablosunu Hangi yapay zekâ modeli en iyi trader? yazısında, düşüşlerdeki davranışlarına dair incelemeyi ise Yapay zekâ modelleri çöküşte panikle satar mı? yazısında yayımladık.
Sık sorulan sorular
ETH/BTC oranında hangi seviyeden almak iyi olur?
Tarihsel olarak aralığın en ucuz beşte biri — mevcut örneklemde 0,0250'nin altı — bir yıllık ölçekte Bitcoin'i %100 oranında geçen tek dilim oldu. Bugünkü 0,0296, Bitcoin'i yaklaşık %57–60 oranında geçmiş olan %20–40 diliminde. Bu bir üstünlüktür, garanti değil.
ETH/BTC oranı bu kadar uzun bir düşüşten daha önce toparlandı mı?
2021–2025 düşüşü 1.230 gün sürdü ve 125 günde %133'lük bir ralliyle sona erdi. Ondan önce 2019 düşüşü 244 gün sürdü ve ardından 824 günlük, +%436'lık bir yükseliş geldi. Uzun düşüşler bitiyor, ama hiçbir zaman yalnızca grafiğe bakarak öngörülebilecek bir takvimle bitmedi.
Düşen ETH/BTC oranı Ethereum'un başarısız olduğu anlamına mı geliyor?
Hayır. Ether'ın Bitcoin'in gerisinde kaldığı anlamına geliyor. Oranın düştüğü kayan bir yıllık pencerelerin %47'sinde Ether dolar bazında yine de yükseldi — 2023 ve 2024'te ise oran %25 ve %33 gerilerken Ether +%90 ve +%42 getirdi.
ETH/BTC'nin tüm zamanların zirvesi neydi?
Günlük kapanış bazında 12 Haziran 2017'deki 0,15029. Bugünkü oran o seviyenin %80,3 altında, 3.335 gün sonra.
Oran ortalamaya döner mi?
Sabit bir seviyenin etrafında dönmez. Son 11 takvim yılının 8'inde düştü; dolayısıyla herhangi bir rakamı "gerçeğe uygun değer" saymanın dayanağı yok. Yüzdelik dilim çerçevesi tam da varsayılan bir merkeze değil, gerçekleşmiş aralığa göreli olduğu için daha iyi çalışıyor.
Bu, Bitcoin'in kendi döngüleriyle nasıl kıyaslanıyor?
Bitcoin'in düşüş ve toparlanma kaydı Bitcoin'in %50'yi aşan tüm çöküşleri yazısında, mevsimsel örüntüsü Bitcoin'in çeyreklik getirileri yazısında, arz döngüsü çerçevesi ise Bitcoin halving döngüleri yazısında.
Yöntem ve sınırlar
Fiyatlar, ETH/BTC, ETH/USD ve BTC/USD için Bitfinex genel API'sinden alınan günlük kapanışlardır; 9 Mart 2016 – 30 Temmuz 2026 aralığını, tam oran serisine sahip 3.789 seansı kapsar. Bitfinex, büyük borsalar arasında en uzun kesintisiz ETH/BTC geçmişini tuttuğu için seçildi; güncel okuma OKX (0,02963) ve CoinGecko (1.918,78 / 64.754 dolardan türetilen 0,029631) ile karşılaştırıldı ve beş ondalık basamağa kadar uyuşuyor.
Döngü dönüm noktaları kapanışlar üzerinde %45 dönüş eşikli ZigZag kullanır. Yüzdelik dilimler her seansın oranını tüm örnekleme göre sıralar ve sonraki 365 takvim gününü ölçer; önünde tam bir yıl bulunmayan pencereler dışlanır, giriş örnekleminin 2025 ortasında bitmesinin nedeni budur.
Açıkça söylenmesi gereken üç sınır var. Pencere örtüşmesi — ardışık günlük girişler gelecek yıllarının neredeyse tamamını paylaşır, dolayısıyla bir dilimdeki 758 pencere 758 bağımsız gözlemden çok uzaktır; bu yüzdeleri anlamlılık testi değil, betimleyici istatistik olarak değerlendirin. Rejim bağımlılığı — en ucuz dilim büyük ölçüde 2016, 2019, 2020 ve 2025'e dayanıyor; bunlar birbirinden çok farklı dört piyasa. Çerçevenin kendi hayatta kalma yanlılığı — oranın seviyesi pek çok girdiden yalnızca biri; Merge, ETF onayları ve 2026'nın düzenleyici değişimleri, dayanak varlıkları bir fiyat oranının yakalayamayacağı biçimlerde değiştirdi.
Bunların hiçbiri yatırım tavsiyesi değildir. Hesapları açıkta duran bir referans tablosudur.
İlgili yazılar
- Bitcoin hâkimiyet döngüleri: Altseason ne zaman başlıyor 2017-2026
- Bitcoin'in %50'yi aşan tüm çöküşleri: 2011'den bu yana toparlanma süreleri
- BTC, ETH ve SOL: 2026 kripto düşüşünde en iyi alım bölgeleri
- Bitcoin'in çeyreklik getirileri: 2013–2026 tam geçmiş tablosu
- Bitcoin halving döngüleri: 2012-2028 tam getiri referansı
- Her Fed faiz indiriminden sonra Bitcoin: 2019-2026 referansı
- Tüm büyük stablecoin sapmaları: tam referans tablosu
- SimianX'in tüm piyasa referans tablolarına göz atın
Kaynaklar
- Bitfinex — tüm fiyat geçmişi için kullanılan genel mum API'si
- OKX — ETH-BTC spot piyasası, çapraz doğrulama için kullanıldı
- CoinGecko — ETH ve BTC için bağımsız fiyat referansı
- Ethereum.org — resmî Ethereum belgeleri ve yol haritası
- Etherscan — Ethereum ağ gezgini ve zincir üstü istatistikler
- Investopedia — göreli güç ve oran analizi açıklaması