
Qual ano do mandato presidencial realmente pagou ao investidor
Todo mandato presidencial americano dura quatro anos, e o folclore do mercado atribuiu a cada um deles uma personalidade: o primeiro é o ano das reformas, o segundo é o ano doloroso, o terceiro é aquele em que a Casa Branca mais quer a economia acelerada, o quarto é o da eleição. É uma história arrumada. A pergunta útil é se os retornos sustentam isso.
Sustentam — com mais nitidez do que quase qualquer outro padrão de calendário da bolsa americana. Ao longo de 98 anos de retorno total do S&P 500, de 1928 a 2025, o terceiro ano do mandato rendeu em média +17,8% e fechou positivo em 92% dos casos. O segundo — o ano das eleições de meio de mandato — rendeu em média +7,1% e fechou positivo 58% das vezes. O mesmo índice, o mesmo século, dez pontos percentuais por ano de diferença conforme apenas onde o calendário caía dentro do ciclo eleitoral.
Isso importa agora por um motivo específico. 2026 é um ano de meio de mandato. A eleição é em 3 de novembro de 2026. No instante em que ela passa, o ciclo entra no terceiro ano.
Este é um texto de dados, não de previsão. Todos os números vêm de um único conjunto de dados público, a metodologia está detalhada no fim, e os pontos em que o padrão é mais fraco do que parece são ditos abertamente, não escondidos.
O que é de fato o ciclo presidencial
A teoria do ciclo presidencial (ou "ciclo eleitoral") remonta ao Stock Trader's Almanac de Yale Hirsch, nos anos 1960. A tese é simples: a política fiscal e monetária não se distribui de modo uniforme ao longo de um mandato, então os retornos das ações também não.
As quatro posições, na convenção usada em todo o artigo:
- Ano 1 — pós-eleição. O ano seguinte a uma eleição presidencial (2025, 2021, 2017…). Novo governo, nova agenda, muitas vezes a metade menos amigável ao mercado.
- Ano 2 — meio de mandato. Eleições legislativas de meio de mandato (2026, 2022, 2018…). A incerteza política atinge o pico e o partido do presidente costuma perder cadeiras.
- Ano 3 — pré-eleitoral. (2027, 2023, 2019…) O ano em que um governo mais quer crescimento, emprego e preços de ativos andando na direção certa antes da próxima campanha.
- Ano 4 — ano eleitoral. A própria eleição presidencial (2028, 2024, 2020…).
Medimos o retorno total do ano civil — variação de preço mais dividendos reinvestidos — porque é o que o investidor de fato ganha e porque é o que o conjunto de dados de origem publica.
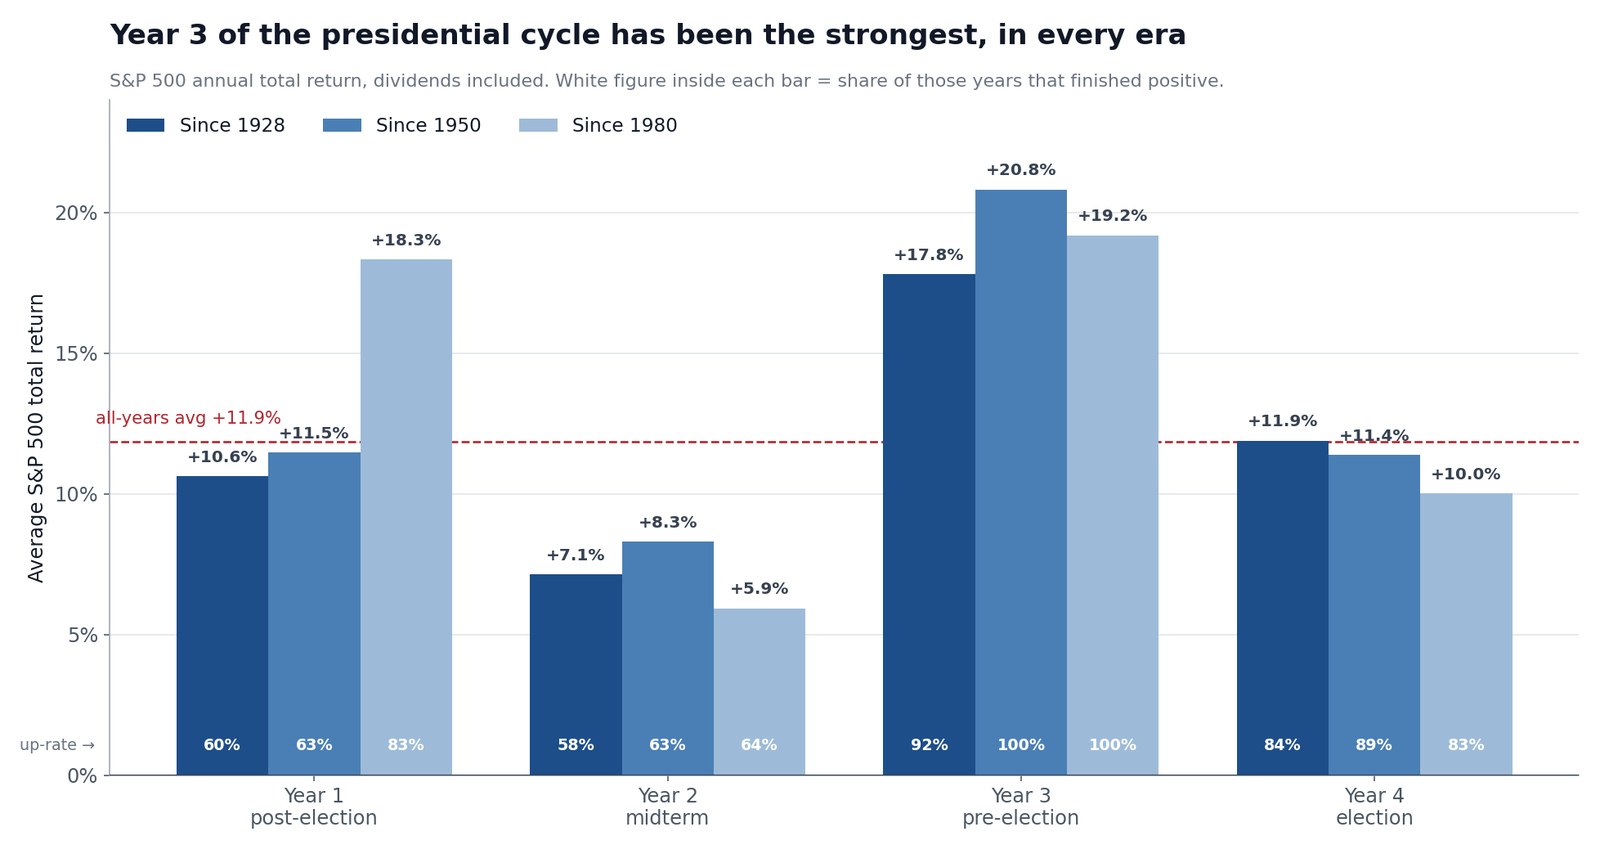
Cada posição do ciclo desde 1928: a tabela de referência
| Posição no ciclo | Anos | Média | Mediana | Positivos | Pior | Melhor |
|---|---|---|---|---|---|---|
| Ano 1 · pós-eleição | 25 | +10,6% | +12,4% | 60% | −35,3% (1937) | +50,0% (1933) |
| Ano 2 · meio de mandato | 24 | +7,1% | +5,0% | 58% | −25,9% (1974) | +52,6% (1954) |
| Ano 3 · pré-eleitoral | 24 | +17,8% | +22,5% | 92% | −43,8% (1931) | +46,7% (1935) |
| Ano 4 · eleitoral | 25 | +11,9% | +15,9% | 84% | −36,5% (2008) | +43,8% (1928) |
| Todos os anos | 98 | +11,9% | +15,2% | 73% | −43,8% | +52,6% |
A ordem é inequívoca: ano 3 > ano 4 > ano 1 > ano 2. E não é uma esquisitice causada pelos anos da Depressão sentados no começo da amostra. Corte o registro em três:
| Posição no ciclo | Desde 1928 | Desde 1950 | Desde 1980 |
|---|---|---|---|
| Ano 1 · pós-eleição | +10,6% · 60% em alta | +11,5% · 63% em alta | +18,3% · 83% em alta |
| Ano 2 · meio de mandato | +7,1% · 58% em alta | +8,3% · 63% em alta | +5,9% · 64% em alta |
| Ano 3 · pré-eleitoral | +17,8% · 92% em alta | +20,8% · 100% em alta | +19,2% · 100% em alta |
| Ano 4 · eleitoral | +11,9% · 84% em alta | +11,4% · 89% em alta | +10,0% · 83% em alta |
O ano 3 não só sobrevive ao corte — ele melhora. Desde 1950 e desde 1980, todo ano pré-eleitoral fechou positivo. O ano 2 é a única posição que piora na era moderna, com apenas +5,9% de média desde 1980.
Ano 3: o mais forte, e as duas vezes em que se quebrou
Estes são todos os anos pré-eleitorais da amostra:
1931 −43,8% · 1935 +46,7% · 1939 −1,1% · 1943 +25,1% · 1947 +5,2% · 1951 +23,7% · 1955 +32,6% · 1959 +12,1% · 1963 +22,6% · 1967 +23,8% · 1971 +14,2% · 1975 +37,0% · 1979 +18,5% · 1983 +22,3% · 1987 +5,8% · 1991 +30,2% · 1995 +37,2% · 1999 +20,9% · 2003 +28,4% · 2007 +5,5% · 2011 +2,1% · 2015 +1,4% · 2019 +31,2% · 2023 +26,1%
Dois anos negativos em vinte e quatro. 1931 (−43,8%, o pior ano isolado de toda a amostra de 98 anos) e 1939 (−1,1%, o ano da invasão alemã da Polônia). Desde 1939 são 21 anos pré-eleitorais positivos consecutivos, com média de +20,3%.
Essa sequência é a estatística mais citada em todo comentário sobre o ciclo presidencial, e merece o asterisco que raramente recebe: 1931 está neste mesmo balde. O grupo do ano 3 contém ao mesmo tempo a maior taxa de acerto e o buraco mais fundo do registro. Uma média de +17,8% com uma cauda de −43,8% é um objeto muito diferente de um +17,8% estável.
Os três sobreviventes mais apertados da sequência também ensinam: 2011 (+2,1%), 2015 (+1,4%) e 2007 (+5,5%). Todos positivos, todos longe de +20%, e 2007 foi seguido imediatamente pelos −36,5% de 2008. "Positivo" e "bom" não são a mesma afirmação.
O ano 2 é o mais fraco — e é o ano em que estamos
O ano de meio de mandato é a criança-problema do ciclo: +7,1% de média, +5,0% de mediana, positivo em apenas 58% das vezes, e a única posição que se deteriorou na amostra moderna. Nossa referência complementar sobre anos de eleição de meio de mandato e a bolsa desmonta esse ano em detalhe: a queda intra-anual mais profunda que a média, a zona de fundo de setembro-outubro e o que o próprio resultado significou — e não significou.
O que aquele texto não cobre, e o que completa o quadro, é o revezamento.
O revezamento do ano 2 para o ano 3
| Ano de meio de mandato | Naquele ano | Ano pré-eleitoral seguinte |
|---|---|---|
| 1930 | −25,1% | −43,8% |
| 1934 | −1,2% | +46,7% |
| 1938 | +29,3% | −1,1% |
| 1942 | +19,2% | +25,1% |
| 1946 | −8,4% | +5,2% |
| 1950 | +30,8% | +23,7% |
| 1954 | +52,6% | +32,6% |
| 1958 | +43,7% | +12,1% |
| 1962 | −8,8% | +22,6% |
| 1966 | −10,0% | +23,8% |
| 1970 | +3,6% | +14,2% |
| 1974 | −25,9% | +37,0% |
| 1978 | +6,5% | +18,5% |
| 1982 | +20,4% | +22,3% |
| 1986 | +18,5% | +5,8% |
| 1990 | −3,1% | +30,2% |
| 1994 | +1,3% | +37,2% |
| 1998 | +28,3% | +20,9% |
| 2002 | −22,0% | +28,4% |
| 2006 | +15,6% | +5,5% |
| 2010 | +14,8% | +2,1% |
| 2014 | +13,5% | +1,4% |
| 2018 | −4,2% | +31,2% |
| 2022 | −18,0% | +26,1% |
Nos 24 pares, o ano pré-eleitoral foi positivo 22 vezes (92%), com média de +17,8%.
O corte condicional é mais afiado. Nos 10 casos em que o próprio ano de meio de mandato fechou negativo, o ano pré-eleitoral seguinte foi positivo 9 vezes em 10 e rendeu em média +20,7% — acima da média incondicional. 1930→1931 é a única exceção, e está dentro da Grande Depressão. Os exemplos recentes são marcantes: 2018 (−4,2%) → 2019 (+31,2%), e 2022 (−18,0%) → 2023 (+26,1%).
A imagem espelhada vale o mesmo: depois de um ano de meio de mandato forte, o ano 3 foi muitas vezes medíocre. 1938 (+29,3%) → 1939 (−1,1%). 1986 (+18,5%) → 1987 (+5,8%). 2006 (+15,6%) → 2007 (+5,5%). 2010 (+14,8%) → 2011 (+2,1%). 2014 (+13,5%) → 2015 (+1,4%). O ciclo parece menos uma garantia de calendário e mais uma reversão à média vestida de calendário.
A diferença dos juros compostos
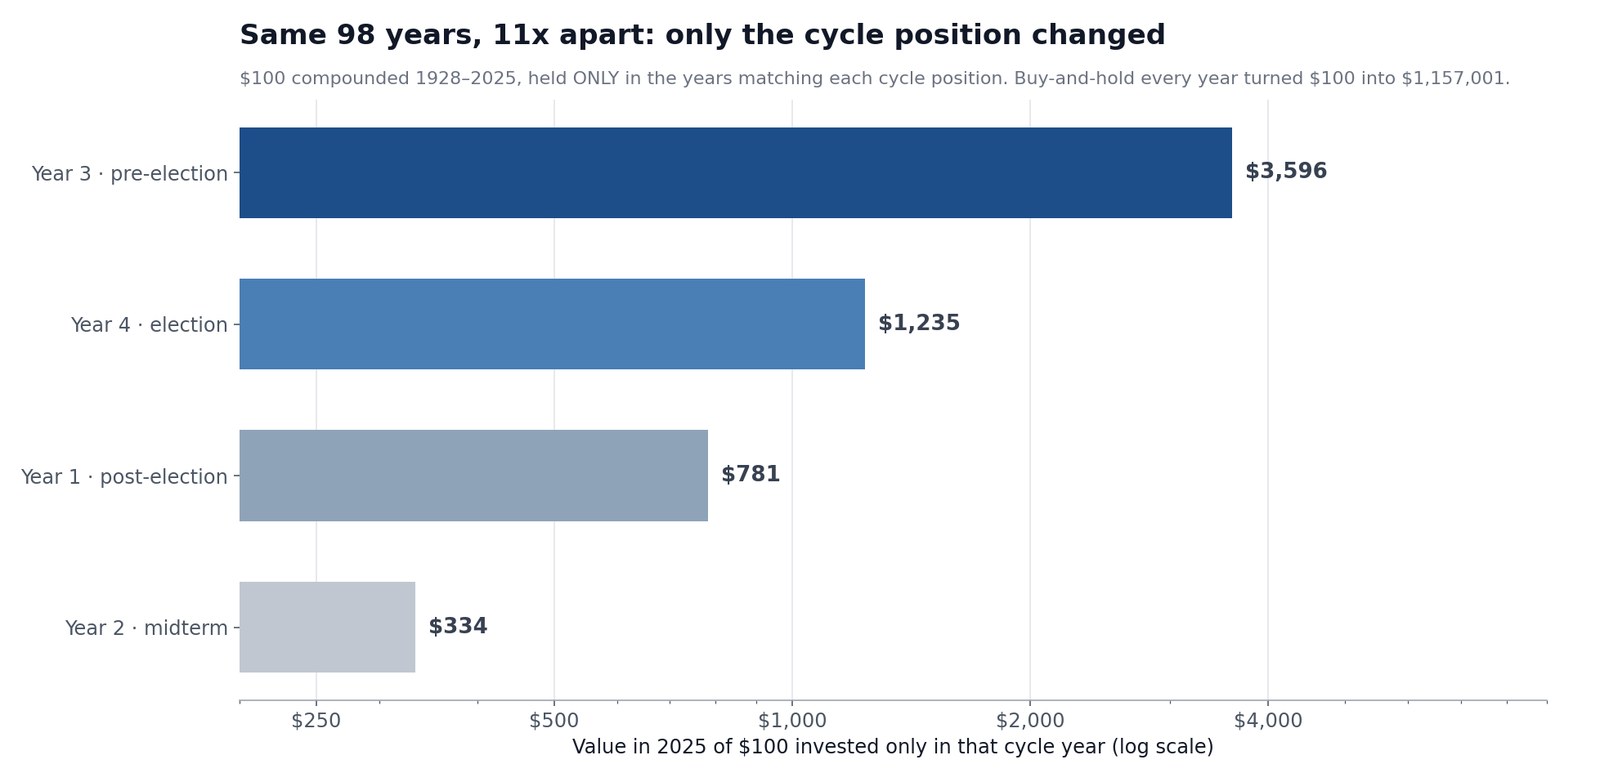
Leve a aritmética até o fim. Comece com US$ 100 em 1928 e mantenha o S&P 500 apenas nos anos que correspondem a uma posição do ciclo, ficando em caixa no resto do tempo:
| Estratégia | US$ 100 viram |
|---|---|
| Só ano 3 · pré-eleitoral | US$ 3.596 |
| Só ano 4 · eleitoral | US$ 1.235 |
| Só ano 1 · pós-eleição | US$ 781 |
| Só ano 2 · meio de mandato | US$ 334 |
| Comprar e manter todos os anos | US$ 1.157.001 |
Onze vezes de diferença entre o melhor e o pior quarto do calendário, no mesmo índice e nos mesmos 98 anos. E o número que deveria impedir qualquer um de levar isso ao pé da letra: comprar e manter todos os anos transformou US$ 100 em US$ 1.157.001 — 322 vezes a melhor estratégia de posição única. O ciclo diz algo sobre a distribuição dos retornos. Não diz para ficar fora do mercado três anos em cada quatro.
A dispersão que as médias escondem
Quatro médias calculadas com 24 ou 25 observações cada são uma base fina, e um gráfico de barras as embeleza. Plote em vez disso cada ano individual e aparece o quadro honesto: forte sobreposição entre os grupos, caudas gordas nas duas direções e um balde de ano 3 que abriga a pior observação de todo o conjunto.
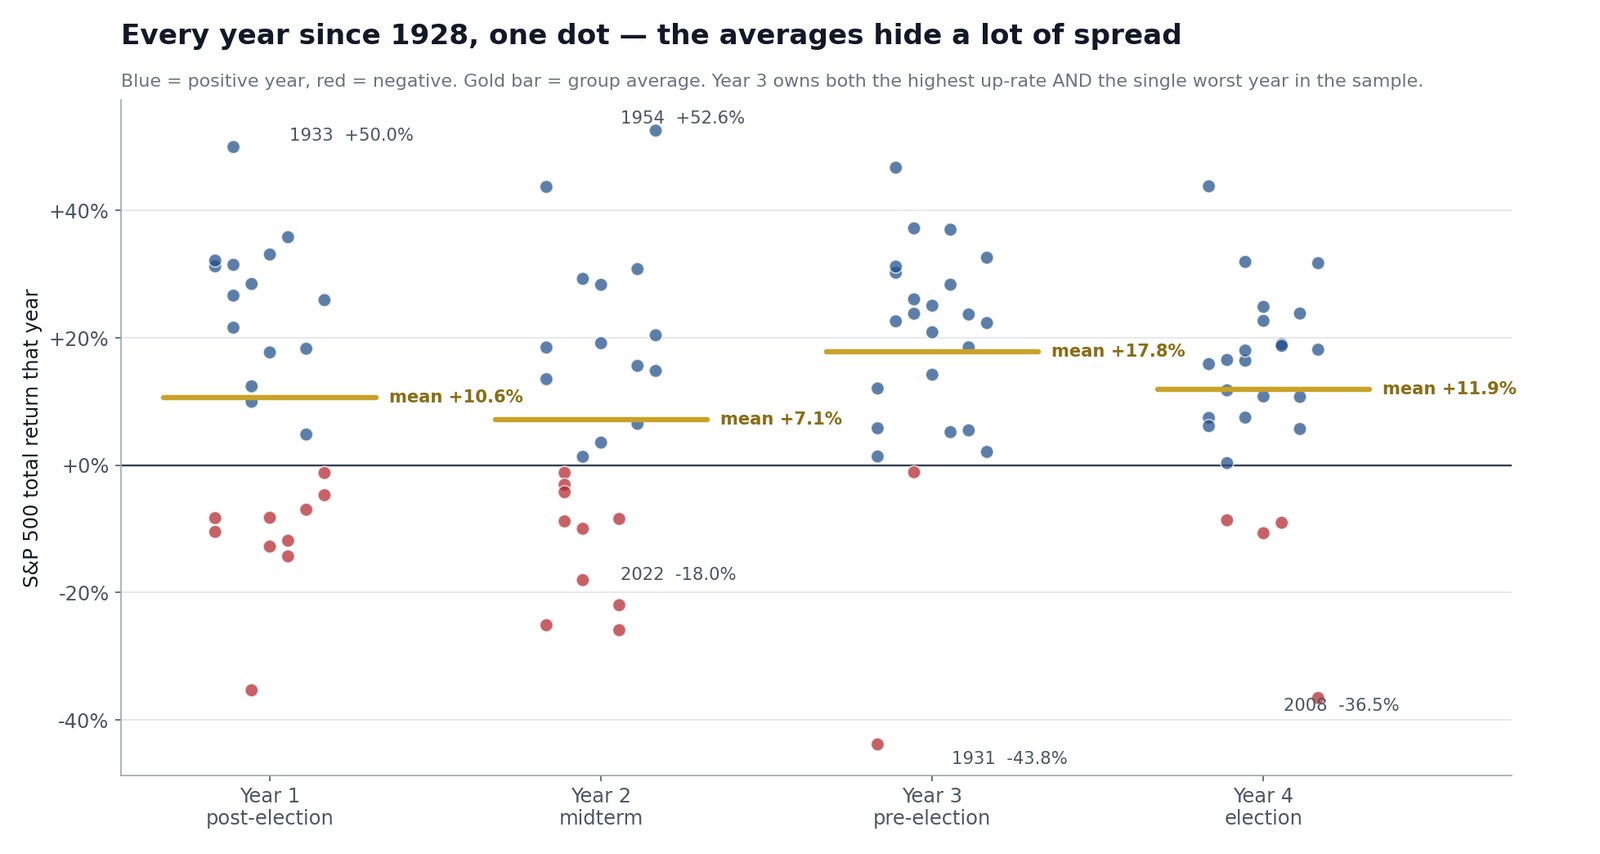
O ano 1 merece nota própria, porque é a posição mais mal compreendida. Na amostra completa parece medíocre — 10 anos negativos em 25, a maior contagem de todas as posições. Mas desde 1980 ele rendeu em média +18,3% e fechou positivo 83% das vezes. Quase todos os seus anos perdedores se concentram antes de 1982: 1929, 1937, 1941, 1953, 1957, 1969, 1973, 1977, 1981, depois 2001, e nada desde então. O que quer que "o ano 1 é o ano ruim" tenha descrito um dia, não descreveu as últimas quatro décadas.
Onde o ciclo está em 2026
- 2025 foi ano 1. O S&P 500 rendeu +17,7%.
- 2026 é ano 2, o de meio de mandato. Até 30 de julho de 2026, o SPY acumula +8,8% no ano em base de preço — já acima da mediana de +5,0% dos anos de meio de mandato, com cinco meses e uma eleição ainda pela frente.
- 2027 será ano 3.
Ou seja, o cenário não bate com o modelo clássico. O ano de meio de mandato de manual é irregular e termina em um dígito ou no negativo, preparando a retomada do ano 3; 2026, em vez disso, passou sete meses subindo apesar de um Fed duro e de um prêmio de risco geopolítico — as mesmas correntes cruzadas que acompanhamos no IPC de julho e no desmonte do momentum de IA.
Isso importa por causa do achado condicional acima. O ano 3 foi mais forte depois de anos de meio de mandato fracos (+20,7%, 9 de 10) e claramente medíocre depois dos fortes (1939, 1987, 2007, 2011 e 2015 vieram todos após anos de meio de mandato de dois dígitos). Se 2026 terminar onde está agora, os análogos históricos mais próximos são o segundo grupo, não o primeiro.
Por que o padrão pode existir — e por que pode não existir
A favor: governos têm motivo e instrumentos. Estímulo fiscal, desregulamentação e medidas tributárias tendem a ser calibrados para a segunda metade do mandato. O Fed é nominalmente independente, mas o ciclo econômico e o político historicamente rimam. E a incerteza — que o mercado precifica diretamente — é máxima antes do meio de mandato e mínima depois de conhecida a composição do Congresso.
Contra, com mais força do que a maioria dos textos admite:
- A amostra é minúscula. Vinte e quatro observações por balde. Um único 1931 move a média do ano 3 em mais de 1,8 ponto percentual sozinho.
- O padrão é público. Está no Stock Trader's Almanac desde os anos 1960. Anomalias de calendário muito conhecidas costumam se erodir; o fato de o ano 3 não ter se erodido é ou prova de que o motor é real, ou de que a amostra é pequena demais para detectar o desgaste.
- Confundidores por toda parte. Os +26,1% de 2023 foram um rali de megacaps puxado por IA e uma operação de desinflação. Chamar isso de retorno "de ano pré-eleitoral" dá ao calendário crédito por algo que ele não fez.
- Posição no ciclo não é mecanismo. É um rótulo no eixo x. O mecanismo, se existe, são política e juros — e por isso as referências sobre os ciclos de alta e corte de juros do Fed acompanham melhor esta tabela do que qualquer narrativa política.
Trate o ciclo como taxa-base e contexto, não como sinal.
Acompanhar o ciclo sem operar um calendário
Efeitos de calendário são uma hipótese de partida. O que decide uma posição real é o que a tela e os fundamentos estão fazendo agora.
- SimianX AI roda análise multiagente — técnica, fundamentalista, notícias e um agente de decisão — sobre o mesmo ativo a partir de um só arcabouço, para que uma probabilidade sazonal seja testada contra a evidência ao vivo em vez de substituí-la.
- Sessão de análise ao vivo — abra uma sessão no SPY ou em qualquer papel e acompanhe os agentes trabalhando os níveis reais.
- SimianX Autopilot repete essa análise no seu horário e avisa quando algo que lhe importa — uma decisão do Fed, um rompimento, um balanço — realmente acontece.
- Pulso do Mercado sinaliza extremos de 52 semanas e 30 dias em ações e cripto no instante em que aparecem.
- Ranking de Modelos de IA — 30 modelos de 6 provedores operando posições reais, de modo que a competência é medida por resultado e não afirmada.
Para o resto do mapa do calendário, nossa referência de sazonalidade do S&P 500 cobre o padrão mês a mês que fica por baixo do ciclo de quatro anos.
Perguntas frequentes
Qual ano do ciclo presidencial é melhor para as ações?
O ano 3, o pré-eleitoral. Desde 1928 rendeu em média +17,8% com 92% dos anos positivos; desde 1950, todo ano pré-eleitoral fechou positivo, com média de +20,8%.
Qual é o pior?
O ano 2, de meio de mandato: +7,1% de média, +5,0% de mediana, positivo em 58% das vezes — e apenas +5,9% de média desde 1980.
O que acontece com as ações depois de uma eleição de meio de mandato?
O ano pré-eleitoral seguinte foi positivo em 22 de 24 casos (92%), com média de +17,8%. Depois de um ano de meio de mandato negativo, foi positivo 9 vezes em 10 e rendeu em média +20,7%.
Algum ano pré-eleitoral já foi negativo?
Duas vezes em 24: 1931 (−43,8%) e 1939 (−1,1%). Nenhuma desde 1939 — 21 anos pré-eleitorais positivos seguidos.
Importa qual partido ocupa a Casa Branca?
Não de um jeito que estes dados possam resolver. Com pouco mais de uma dúzia de mandatos por partido desde 1928, os cortes partidários produzem amostras pequenas demais para separar do ciclo econômico. Nossa referência sobre anos eleitorais presidenciais trabalha diretamente os cortes por partido e por reeleição.
Em que ponto do ciclo estamos agora?
2026 é ano de meio de mandato (ano 2). A eleição é em 3 de novembro de 2026 e 2027 será ano pré-eleitoral (ano 3).
Devo mesmo operar isso?
A tabela dos juros compostos argumenta contra. Manter só os anos 3 transformou US$ 100 em US$ 3.596 desde 1928; manter todos os anos transformou em US$ 1.157.001. O ciclo é útil como taxa-base do que é um ano normal em cada posição — não como instrução para ficar em caixa 75% do tempo.
Metodologia e limitações
Os retornos são retornos totais anuais do S&P 500 (valorização mais dividendos reinvestidos) do conjunto de dados históricos da NYU Stern mantido por Aswath Damodaran, cobrindo 1928–2025 — 98 anos civis completos. Esse conjunto é a referência acadêmica padrão para retornos de longo prazo de ativos americanos e é de livre consulta, então todos os números aqui são reprodutíveis.
A posição no ciclo é atribuída aritmeticamente pelo ano civil: ano 4 (eleitoral) é qualquer ano divisível por 4; ano 1 é o seguinte, e assim por diante. O número de 2026 no ano é uma medição à parte — retorno de preço do SPY do fechamento de US$ 681,92 em 31 de dezembro de 2025 ao fechamento de US$ 741,69 em 30 de julho de 2026, tirado do próprio repositório de candles diários da SimianX. Exclui dividendos e por isso fica cerca de 0,7 a 1,0 ponto abaixo do equivalente em retorno total, e é um ano parcial, não um ano.
Quatro limitações que devem viajar com qualquer uso desta tabela:
Tamanho da amostra. De 24 a 25 observações por balde. São estatísticas descritivas, não testes de significância, e nenhum valor-p está implícito.
Caudas gordas. As médias se apoiam em distribuições que contêm −43,8% e +52,6%. A mediana é a estimativa central mais honesta para todos os baldes, e o gráfico de pontos acima é um resumo mais honesto do que qualquer barra.
Sobreposição de regimes. A era mais forte para o ano 3 (de 1950 em diante) é também a da expansão do pós-guerra, da desinflação de Volcker e de quatro décadas de juros em queda. Separar "ano pré-eleitoral" de "regime de juros em queda" não é possível com 24 pontos de dados.
Sobrevivência do próprio recorte. A teoria do ciclo presidencial ficou famosa porque o padrão era forte na amostra que a produziu. Parte da força aparente é seleção.
Nada disso é recomendação de investimento. É uma tabela de referência com as contas à mostra.
Leituras relacionadas
- Anos de eleição de meio de mandato e a bolsa: 1950–2026
- O S&P 500 em anos eleitorais presidenciais: dados 1928-2024
- Sazonalidade do S&P 500: os melhores e piores meses 1950–2026
- Todos os mercados de baixa do S&P 500 desde 1929: duração e recuperação
- Quanto tempo cada mercado de baixa levou para se recuperar: 1929-2022
- Todos os ciclos de alta de juros do Fed desde 1983: S&P 500 e semicondutores
- Todos os ciclos de corte de juros do Fed desde 1980: ações, títulos e ouro
- Os 20 piores dias da história do S&P 500 e o que veio depois
- Explore todas as tabelas de referência de mercado da SimianX
Referências
- NYU Stern — retornos históricos anuais de ações, títulos e letras, de Damodaran
- Wikipédia — o índice S&P 500, composição e história
- Investopedia — a teoria do ciclo eleitoral presidencial explicada
- Stock Trader's Almanac — a pesquisa original de Yale Hirsch sobre o ciclo de quatro anos
- Federal Reserve — calendário do FOMC e comunicados de política
- Câmara dos Representantes dos EUA — histórico de mudanças de cadeiras no meio de mandato