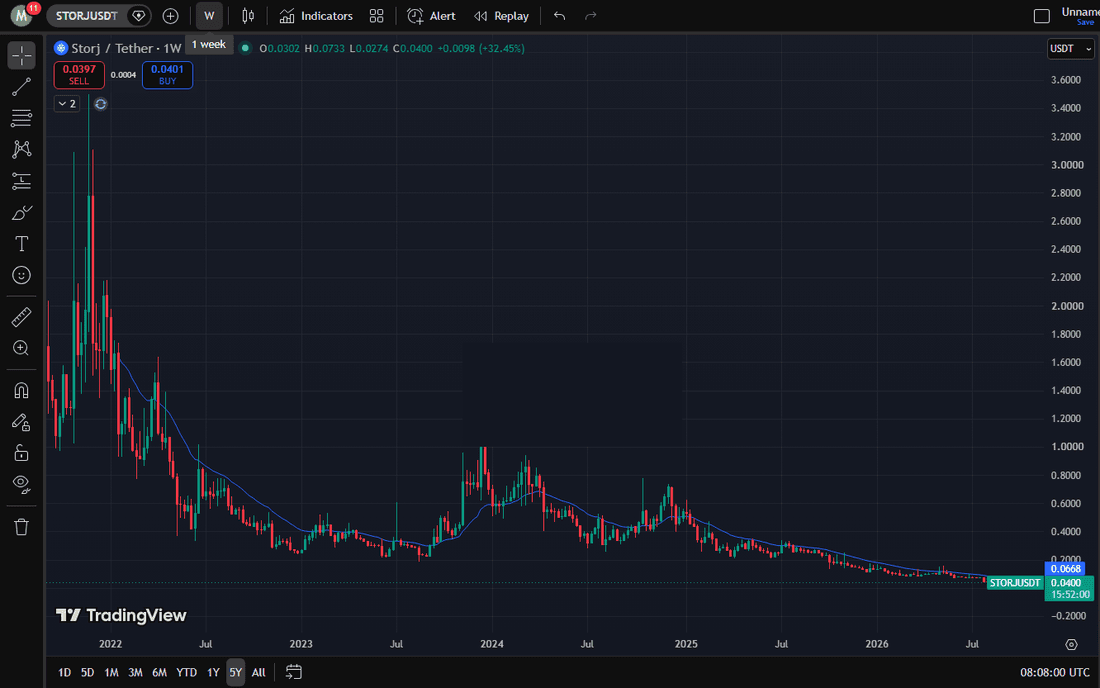
STORJ/USDT analysis
Scope: The supplied market data contains 21 daily candles and daily indicators, but no broader-market comparison, funding/open-interest data, order book, or current project-development metrics. The analysis is therefore strongest on the short-term price structure, not on a full fundamental valuation. The timestamps also indicate data from October 2026; conclusions apply to that supplied snapshot.
1. Trend analysis
Overall trend: bearish.
- STORJ has fallen from $0.03237 at the start of the displayed period to $0.02645, a decline of about 18%.
- The daily closes show a general sequence of lower highs and lower lows. Recent closes have weakened from $0.02960 to $0.02745, $0.02709, and $0.02645.
- Price is below the 12-day EMA ($0.02878), 26-day EMA ($0.03045), 20-day SMA ($0.02989), and 50-day SMA ($0.03227). These averages are overhead and reinforce the downtrend.
- The MACD is negative and below its signal line, with a negative histogram: momentum remains bearish.
- The RSI of 19.82 indicates deeply oversold short-term conditions. That raises the chance of a relief bounce, but it does not by itself confirm a trend reversal.
- The latest daily volume, 28.2 million STORJ, is around 2.8 times the 20-day average. Heavy volume alongside a sharp decline suggests strong activity during the selloff; without order-flow data, it is not possible to tell whether this represents capitulation or continued distribution.
Reading: The dominant trend is down. Oversold conditions make a short-term rebound plausible, but bulls would need to reclaim nearby resistance and establish higher lows before the trend can be considered improved.
2. Key support and resistance
Levels are approximate and based on the supplied candles and indicators.
Support
- $0.0262–$0.0268: Immediate support zone. The recent low was $0.02533, while the Bollinger lower band is near $0.02677. The current price is just below that band, so this area is under pressure.
- Around $0.0253: The clearest recent swing low. A decisive daily close below it would weaken the chart further and expose the price to lower, untested levels. The supplied data is insufficient to identify reliable support below this point.
Resistance
- $0.0271–$0.0281: First recovery hurdle, encompassing the last two daily closes and the recent rebound high.
- $0.0288–$0.0299: Important overhead zone, containing the 12-day EMA and 20-day SMA. A sustained move back above it would be an initial sign of stabilization.
- $0.0304–$0.0323: Stronger resistance, defined by the 26-day EMA and 50-day SMA, plus prior trading activity. Reclaiming this zone would materially improve the short-term structure.
- Around $0.0330: Upper Bollinger band; a more distant reference if price stages a substantial recovery.
The $0.0253 swing low and the $0.0288–$0.0299 moving-average zone are the most important near-term levels to watch.
3. Market structure and sentiment
Structure: Bearish, with lower highs/lows and price below the main short- and medium-term moving averages. The most recent session made a fresh low at $0.02533 and closed at $0.02645, so buyers did recover from the low intraday, but the supplied data does not yet show a confirmed reversal.
Sentiment: The combination of a very low RSI, a close near the recent low, and elevated volume points to substantial selling pressure and potentially stretched downside conditions. That can produce sharp countertrend moves, particularly in a leveraged perpetual market, but no funding, open interest, liquidation, or positioning data is provided to assess whether traders are crowded on one side.
Fundamental context: Storj’s stated use case is decentralized, encrypted cloud storage. The information provided does not include current adoption, network usage, revenue, token demand, unlocks, or development milestones, so it is not enough to judge whether fundamentals support the price. Supply information also deserves caution: circulating supply is about 143.8 million versus total supply of 425 million. The difference alone does not establish the timing or impact of future issuance, but it is a relevant dilution risk to investigate.
4. Overall directional bias
Bias: Bearish, with elevated risk of a short-term oversold bounce.
The downtrend and negative MACD outweigh the RSI-based rebound signal for now. A daily close below $0.0253 would strengthen the bearish case. Conversely, recovery above $0.0288–$0.0299, followed by sustained trade above that zone, would provide the first meaningful evidence of stabilization; reclaiming $0.0304–$0.0323 would be a stronger improvement.
Confidence score: 32/100
This is a directional score, where 0 = strongly bearish and 100 = strongly bullish. The low score reflects bearish trend evidence, offset by deeply oversold RSI and the possibility of a rebound. Confidence is limited by the short price history provided and the absence of broader market, derivatives-positioning, and current project-fundamental data.
This is an analytical snapshot, not a guarantee or personalized trading recommendation. STORJ perpetual futures can move sharply, and leverage magnifies both gains and losses.