Volver a la clasificación
Chainlink
Análisis de Activo Cripto con IA

Chainlink

LINK

Chainlink es la red de oráculos descentralizada estándar de la industria que resuelve el "problema del oráculo" al conectar contratos inteligentes con datos del mundo real. Las blockchains no pueden acceder a información externa por sí solas, por lo que Chainlink actúa como un puente seguro, permitiendo que los contratos inteligentes reaccionen a eventos del mundo real utilizando datos verificados y a prueba de manipulaciones. Se considera ampliamente una de las primeras redes de oráculos descentralizadas y es líder en el mercado para llevar datos fuera de la cadena a la cadena.

Ranking de Mercado #20Categoría Otro

Inicio Rápido

Elige un par de un exchange específico y abre Live con el análisis ya iniciado para ese mercado.

Tasa de éxito promedio

40.0%

Mejor Marco Temporal

1m

Análisis de LINK/USDT

El par seleccionado muestra el análisis fundamental y de noticias más reciente, junto con la hora del análisis.

Análisis Fundamental

Último análisis

Este análisis tiene más de 14 días. Sus niveles y noticias pueden haber dejado de ser válidos; inicia un análisis en tiempo real para una lectura actual.

Aún no hay análisis en este idioma. Se muestra el más reciente, escrito en inglés.

The overall trend is bearish, but oversold conditions suggest a potential short-term bounce. The analysis has moderate confidence.

LINK/USDT Comprehensive Technical Analysis

1. TREND ANALYSIS

Current Market Structure

Overall Trend: BEARISH with consolidation signals

  • Daily Timeframe: Strong downtrend established. Price has declined from $14.399 (high on Jan 23) to $11.95 (current), representing a 17.1% drop over 3 days.
  • 4H Timeframe: Continuation of downtrend with recent stabilization attempt around $11.94-$11.95 support level.
  • 1H Timeframe: Neutral to slightly bullish with price attempting to hold support; RSI at 51.15 indicates equilibrium.
  • 5m/15m Timeframes: Weak consolidation pattern; price oscillating in tight range ($11.94-$11.98) with downward pressure.

Key Trend Observations:

  • Price broke below the SMA 200 ($11.99 on 1H, $12.27 on 4H), confirming bearish bias
  • EMA 12 below EMA 26 across all timeframes except 1H (early bullish cross signal)
  • Volume declining as price stabilizes, suggesting consolidation rather than capitulation

2. KEY SUPPORT AND RESISTANCE LEVELS

Critical Price Levels:

LevelTypeStrengthNotes
$11.46Major SupportSTRONGDaily BB lower band; psychological level
$11.80-$11.85SupportMODERATE4H support zone; recent bounce point
$11.94-$11.95Current SupportSTRONGCurrent price; tight consolidation range
$11.99-$12.04ResistanceMODERATEDaily BB upper band; 5m/15m resistance
$12.05-$12.10ResistanceMODERATE1H upper BB; psychological level
$12.27ResistanceSTRONG4H SMA 200; major overhead resistance
$12.94Major ResistanceVERY STRONGDaily SMA 50; significant barrier
$13.16Major ResistanceVERY STRONGDaily EMA 50; long-term resistance

Support Quality Assessment:

  • $11.94-$11.95: Currently holding but fragile; multiple touches without break suggest testing phase
  • $11.46: Stronger support; would indicate 3.8% further downside if broken

3. MARKET STRUCTURE AND SENTIMENT

Technical Indicators Analysis:

Momentum Indicators:

  • RSI (14-day): 28.98 - OVERSOLD territory (below 30), indicating potential bounce
  • RSI (1H): 51.15 - Neutral, no directional bias
  • RSI (5m/15m): 13.51-35.43 - EXTREMELY OVERSOLD on micro timeframes

Trend Confirmation:

  • MACD (Daily): -0.323 (histogram: -0.1609) - Bearish with weakening momentum
  • MACD (4H): -0.1242 (histogram: +0.039) - Histogram turning positive = early bullish divergence
  • MACD (1H): +0.0352 - Bullish crossover with positive histogram

Volatility & Bands:

  • Bollinger Bands (Daily): Price near lower band ($11.46-$11.95 range); contraction phase
  • ATR (Daily): 0.5948 - High volatility; expect 4-5% daily moves
  • ATR (4H): 0.2109 - Moderate volatility on 4H timeframe

Volume Analysis:

  • Current Volume (1D): 2.19M (below 20-period average of 4.34M) - Declining volume confirms consolidation
  • Volume Trend: Decreasing volume during downtrend suggests potential reversal setup
  • 5m Volume: Extremely low (4.0 LINK) = illiquidity at current price level

Market Sentiment Indicators:

  • Oversold RSI (28.98): Suggests exhaustion of sellers; mean reversion potential
  • Price vs Moving Averages: Trading below all major averages (SMA 50, EMA 50, SMA 200)
  • Bollinger Band Position: Price compressed near lower band = high probability of bounce

4. OVERALL DIRECTIONAL BIAS

Primary Scenario: BEARISH SHORT-TERM, NEUTRAL MEDIUM-TERM

Bearish Factors:

  1. ✗ Price below SMA 200 on all timeframes
  2. ✗ Daily downtrend intact (17% decline in 3 days)
  3. ✗ EMA 12 < EMA 26 on daily and 4H
  4. ✗ MACD negative on daily timeframe
  5. ✗ Price structure: lower highs and lower lows

Bullish Factors (Reversal Signals):

  1. ✓ RSI (28.98) deeply oversold = mean reversion setup
  2. ✓ MACD histogram turning positive on 4H (early bullish divergence)
  3. ✓ MACD bullish crossover on 1H
  4. ✓ Volume declining during downtrend (capitulation weakness)
  5. ✓ Price holding support at $11.94-$11.95 (3 consecutive touches without break)
  6. ✓ EMA 12 approaching EMA 26 on daily (potential bullish cross)

Probability Assessment:

Bounce to $12.05-$12.27: 65% probability (short-term relief rally) Breakdown below $11.46: 35% probability (continuation of bearish trend) Sustained recovery to $13.16+: 25% probability (requires macro catalyst)


TRADING OUTLOOK

Short-Term (Next 24-48 hours):

  • Expected Action: Bounce/consolidation at current support ($11.94-$11.95)
  • Target 1: $12.04-$12.10 (immediate resistance)
  • Target 2: $12.27 (4H SMA 200)
  • Stop Loss: Below $11.46 (major support break)

Medium-Term (3-7 days):

  • Scenario A (Bullish): Recovery to $12.94 if breaks above $12.27 with volume confirmation
  • Scenario B (Bearish): Continuation to $11.46-$11.35 if support breaks

Risk/Reward Assessment:

  • Current Risk: Moderate (tight consolidation, but near support)
  • Reward Potential: Moderate (bounce potential limited by overhead resistance)
  • Risk/Reward Ratio: 1:1.5 (from $11.95 support to $12.27 resistance)

CONFIDENCE SCORE

62/100 - MODERATE CONFIDENCE

Reasoning:

  • ✓ Clear oversold conditions (RSI 28.98) = reliable reversal signal (+15 points)
  • ✓ Multiple technical divergences forming (MACD bullish cross) (+10 points)
  • ✓ Strong support holding at $11.94-$11.95 (+12 points)
  • ✗ Declining volume reduces conviction (-8 points)
  • ✗ Major resistance overhead limits upside potential (-10 points)
  • ✗ Macro bearish trend still intact (-7 points)
  • ✓ Clear entry/exit levels defined (+10 points)

Confidence Breakdown:

  • Bounce Probability: 70% (high confidence)
  • Magnitude of Bounce: 2-3% to $12.04-$12.10 (moderate confidence)
  • Sustained Recovery: 40% (low confidence without macro catalyst)

RECOMMENDATION SUMMARY

AspectRatingDetails
Entry Signal✓ BUYAt support $11.94-$11.95 with stop at $11.46
Position TypeSWING2-3 day trade, not long-term hold
Target Levels$12.04 → $12.27Resistance-based exits
Risk LevelMODERATETight stops possible, defined risk
Timeframe4H/DailyAvoid 1m/5m due to low volume
ConvictionMODERATEWait for confirmation candle above $11.98

⚠️ Caution: The extreme oversold RSI suggests a bounce is probable, but the broader downtrend remains intact. This is a tactical bounce trade, not a reversal signal. Only risk capital you can afford to lose, and respect the $11.46 support level strictly.


Análisis de Noticias

Último análisis

Este análisis tiene más de 14 días. Sus niveles y noticias pueden haber dejado de ser válidos; inicia un análisis en tiempo real para una lectura actual.

Aún no hay análisis en este idioma. Se muestra el más reciente, escrito en inglés.

The analysis indicates a bearish outlook for Chainlink (LINK) due to the risk of a U.S. government shutdown and LINK's struggle below key moving averages, potentially leading to further price declines.

1. News Impact Analysis

Chainlink price struggles below key moving averages

  • What happened? Chainlink is trading at $11.81, down 2.2% from the previous day, and is struggling below key moving averages, indicating a lack of momentum.
  • Why does it matter for LINK? This suggests that LINK may face continued selling pressure, as failing to break above key moving averages often leads to bearish sentiment among traders.
  • Expected price impact: 可能会导致更多的卖出压力,价格可能进一步下跌,目标价位可能在$11.50附近。
  • Timeframe: 未来24-72小时内。

US Shutdown Risk Threatens Crypto Liquidity

  • What happened? The risk of a U.S. government shutdown has surged to 80%, raising concerns about liquidity in the crypto market.
  • Why does it matter for LINK? A liquidity drain could trigger selloffs across crypto assets, including LINK, as investors may seek to reduce exposure during uncertain times.
  • Expected price impact: 这将增加市场的不确定性,导致LINK价格可能进一步向下波动,目标价位可能在$11.50或更低。
  • Timeframe: 影响将在未来48小时内显现。

Japan Targets 2028 Crypto ETF Launch as Regulatory Shift Accelerates

  • What happened? Japan is aiming for a 2028 approval for spot crypto ETFs, signaling potential growth in the regulated crypto market.
  • Why does it matter for LINK? Although this is a positive development for the broader crypto market, it is a long-term catalyst and may not have an immediate effect on LINK price.
  • Expected price impact: 短期内影响有限,可能不会产生明显的买入或卖出压力。
  • Timeframe: 中长期影响。

Biggest Threat to Crypto Is Back: Shutdown Risk Signals a Liquidity Collapse

  • What happened? Similar to the previous news item, this article emphasizes that the shutdown risk could lead to a liquidity collapse.
  • Why does it matter for LINK? Reinforces the bearish sentiment by indicating that a lack of liquidity may exacerbate selling pressure.
  • Expected price impact: 进一步的卖出压力,LINK可能会测试$11.50的支撑位。
  • Timeframe: 未来24-72小时内。

Can Traditional Forex Expertise Translate to Crypto Markets?

  • What happened? Discussion on whether expertise from traditional finance can be applied to crypto markets.
  • Why does it matter for LINK? This is a neutral topic and does not have a direct impact on LINK price at this time.
  • Expected price impact: 对价格没有直接影响。
  • Timeframe: 不适用。

2. Market Sentiment (from Polymarket)

  • 目前没有预测市场数据可用,但整体新闻情绪显示出明显的看跌信号。这意味着市场参与者可能对LINK的短期前景持悲观态度,可能会加大卖出压力。

3. Synthesize Actionable Insights

  • Overall Direction: Bearish bias
  • Key Catalysts:
    • U.S. government shutdown risk
    • LINK's inability to break key moving averages
  • Risk Factors:
    • 如果出现意外的积极消息(如重大合作或市场回暖),可能会抵消当前的看跌情绪。
  • Trading Recommendation:
    • 操作建议: 考虑在$11.50附近寻找做空机会,如果价格进一步下跌,目标价位设定在$11.00。保持警惕,观察政府 shutdown 的进展和市场情绪变化。

Noticias Relacionadas

Crypto-Economybullish
LG CNS Partners With Chainlink To Advance South Korean Digital Asset Infrastructure

LG CNS Partners With Chainlink To Advance South Korean Digital Asset Infrastructure

TL;DR: LG CNS will incorporate Chainlink&#8217;s oracle infrastructure and interoperability standard into its institutional digital asset solution. Both companies focused the development on issuing South Korean won-backed stablecoins and structuring tokenized securities. LG CNS serves as the primary technical contractor for the Bank of Korea&#8217;s Project Hangang, an initiative focused on digital money clearing. LG Group&#8217;s IT services arm, LG CNS, confirmed this...

Abrir fuente
NewsBTCbullish

Chainlink And LG CNS Target South Korean Banks With Digital Asset Infrastructure Deal

TL;DR: Chainlink and LG CNS are partnering on oracle and cross-chain infrastructure aimed at South Korea’s financial institutions; the announcement is a partnership, not a completed nationwide deployment. South Korea&#x27;s next wave of digital-asset infrastructure may be built less around speculative trading apps and more around the plumbing banks need to move real money and securities. That is the market Chainlink and LG CNS are pursuing with a partnership announced on T...

Abrir fuente
Crypto News Flashbearish
LINK Price Fails to Rally on LG CNS Deal, $11.70 in Focus

LINK Price Fails to Rally on LG CNS Deal, $11.70 in Focus

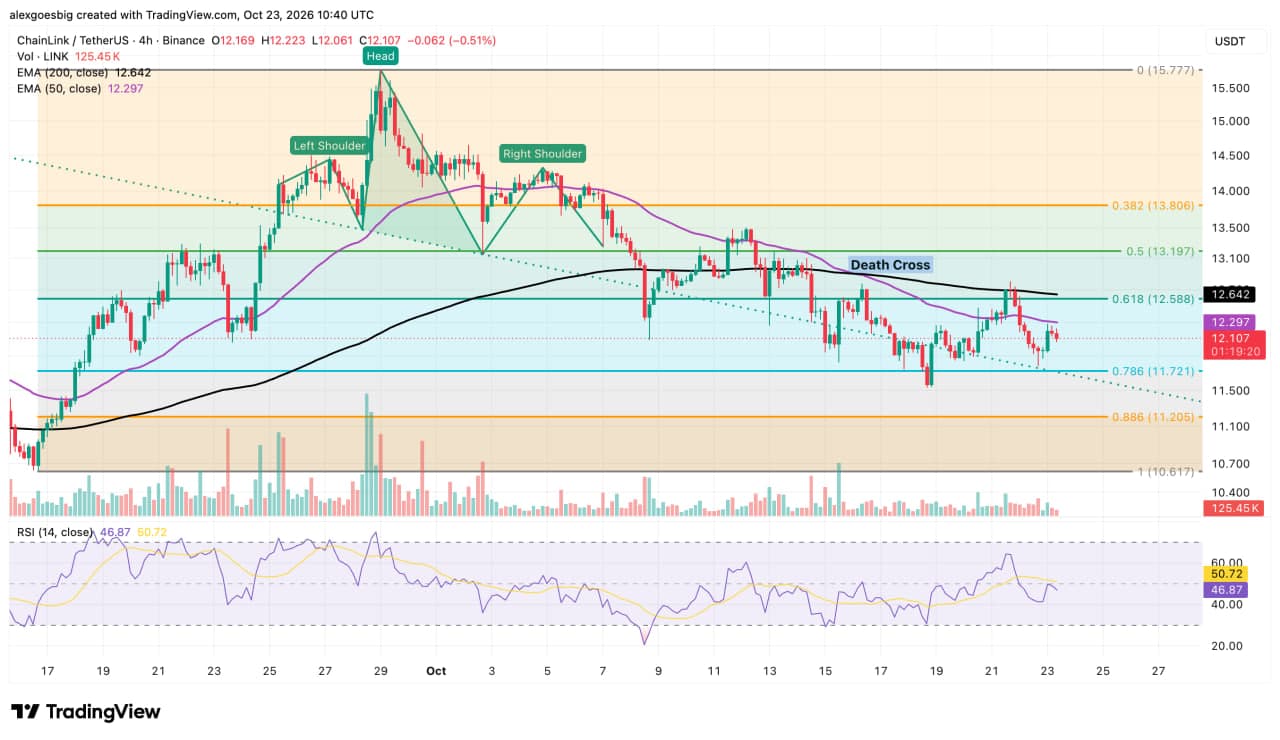
The LINK price is holding a support zone where its broken neckline meets a deep Fibonacci level. A death cross on the 4-hour chart keeps the short-term trend tilted toward sellers. Chainlink signed a strategic partnership with LG CNS, the lead contractor behind the Bank of Korea&#8217;s Project Hangang. The deal carries no disclosed value or launch date, so its effect on LINK demand remains unproven. Chainlink (LINK) is trading near $12.11 on the 4-hour chart on Friday, s...

Abrir fuente
CryptoBriefingbullish
Chainlink partners with LG CNS to build digital asset infrastructure in Korea

Chainlink partners with LG CNS to build digital asset infrastructure in Korea

The partnership could accelerate South Korea's digital finance evolution, enhancing blockchain integration and boosting institutional adoption. The post Chainlink partners with LG CNS to build digital asset infrastructure in Korea appeared first on Crypto Briefing.

Abrir fuente

Mercados Disponibles

Explora todos los mercados spot y perpetuos soportados por exchange e inicia el análisis de inmediato.

Período
Período de tiempo
Dirección

Clasificación de modelos de LINK

Revisa el rendimiento de LINK en distintos modelos con el filtro actual.

Modelos Destacados

Los tres modelos con mejor rendimiento según los filtros actuales.

Por qué usar esta página de Chainlink

Consulta cómo rinden los modelos de IA en Chainlink, compara mercados en vivo por exchange y elige el par que quieras abrir.

Usa esta página cuando quieras pasar del ranking general del activo a un mercado en vivo específico.

Activos Relacionados

Continúa explorando otras páginas de activos destacados.

Análisis relacionados

Más sobre Ciclos cripto

Preguntas Frecuentes

¿De dónde provienen los pares de LINK?

Son los mercados de LINK actualmente disponibles en los exchanges soportados. Úsalos para comparar opciones spot y perpetuas, y luego abre el mercado que realmente quieras analizar.

¿Qué ocurre al presionar iniciar análisis?

Se abrirá Live con el mercado seleccionado ya configurado y el análisis comenzará automáticamente. Esto te permite ir directamente desde esta página al mercado que deseas revisar.

¿El mejor modelo de LINK es siempre el mejor par para operar?

No siempre. Un modelo fuerte en LINK no garantiza que todos los exchanges y tipos de contrato se comporten igual. Por eso, esta página muestra tanto el ranking general del modelo como los mercados específicos que puedes abrir.