Bumalik sa Ranking
Solana
AI Crypto Asset Analysis

Solana

SOL

Ang Solana ay isang mataas na functional na open source na proyekto na umaasa sa walang pahintulot na katangian ng blockchain technology upang magbigay ng mga solusyon sa decentralized finance (DeFi). Ito ay isang layer 1 network na nag-aalok ng mabilis na bilis at abot-kayang gastos. Habang ang ideya at paunang trabaho sa proyekto ay nagsimula noong 2017, ang Solana ay opisyal na inilunsad noong Marso 2020 ng Solana Foundation na may punong-tanggapan sa Geneva, Switzerland.

Market Rank #7Kategorya Smart Contract Platform

Quick Start

Pumili ng exchange-specific pair at buksan ang Live na may auto-start na analysis para sa market na iyon.

Average na Win Rate

51.4%

Pinakamahusay na Timeframe

4h

Analysis para sa SOL/USDT

Ipinapakita ng napiling pair ang pinakabagong fundamental at news analysis, kasama ang oras ng pagsusuri.

Fundamental Analysis

Sinuri

Wala pang pagsusuri sa wikang ito. Ipinapakita ang pinakabago, nakasulat sa Ingles.

Near-term bias is bearish while below 105.65-106.00 resistance with weak momentum across short timeframes, but 1h oversold RSI and immediate support at 104.66-104.85 create meaningful bounce risk. Trade direction is NO_TRADE pending confirmed break or recovery.

SOL-USDT-SWAP Analysis

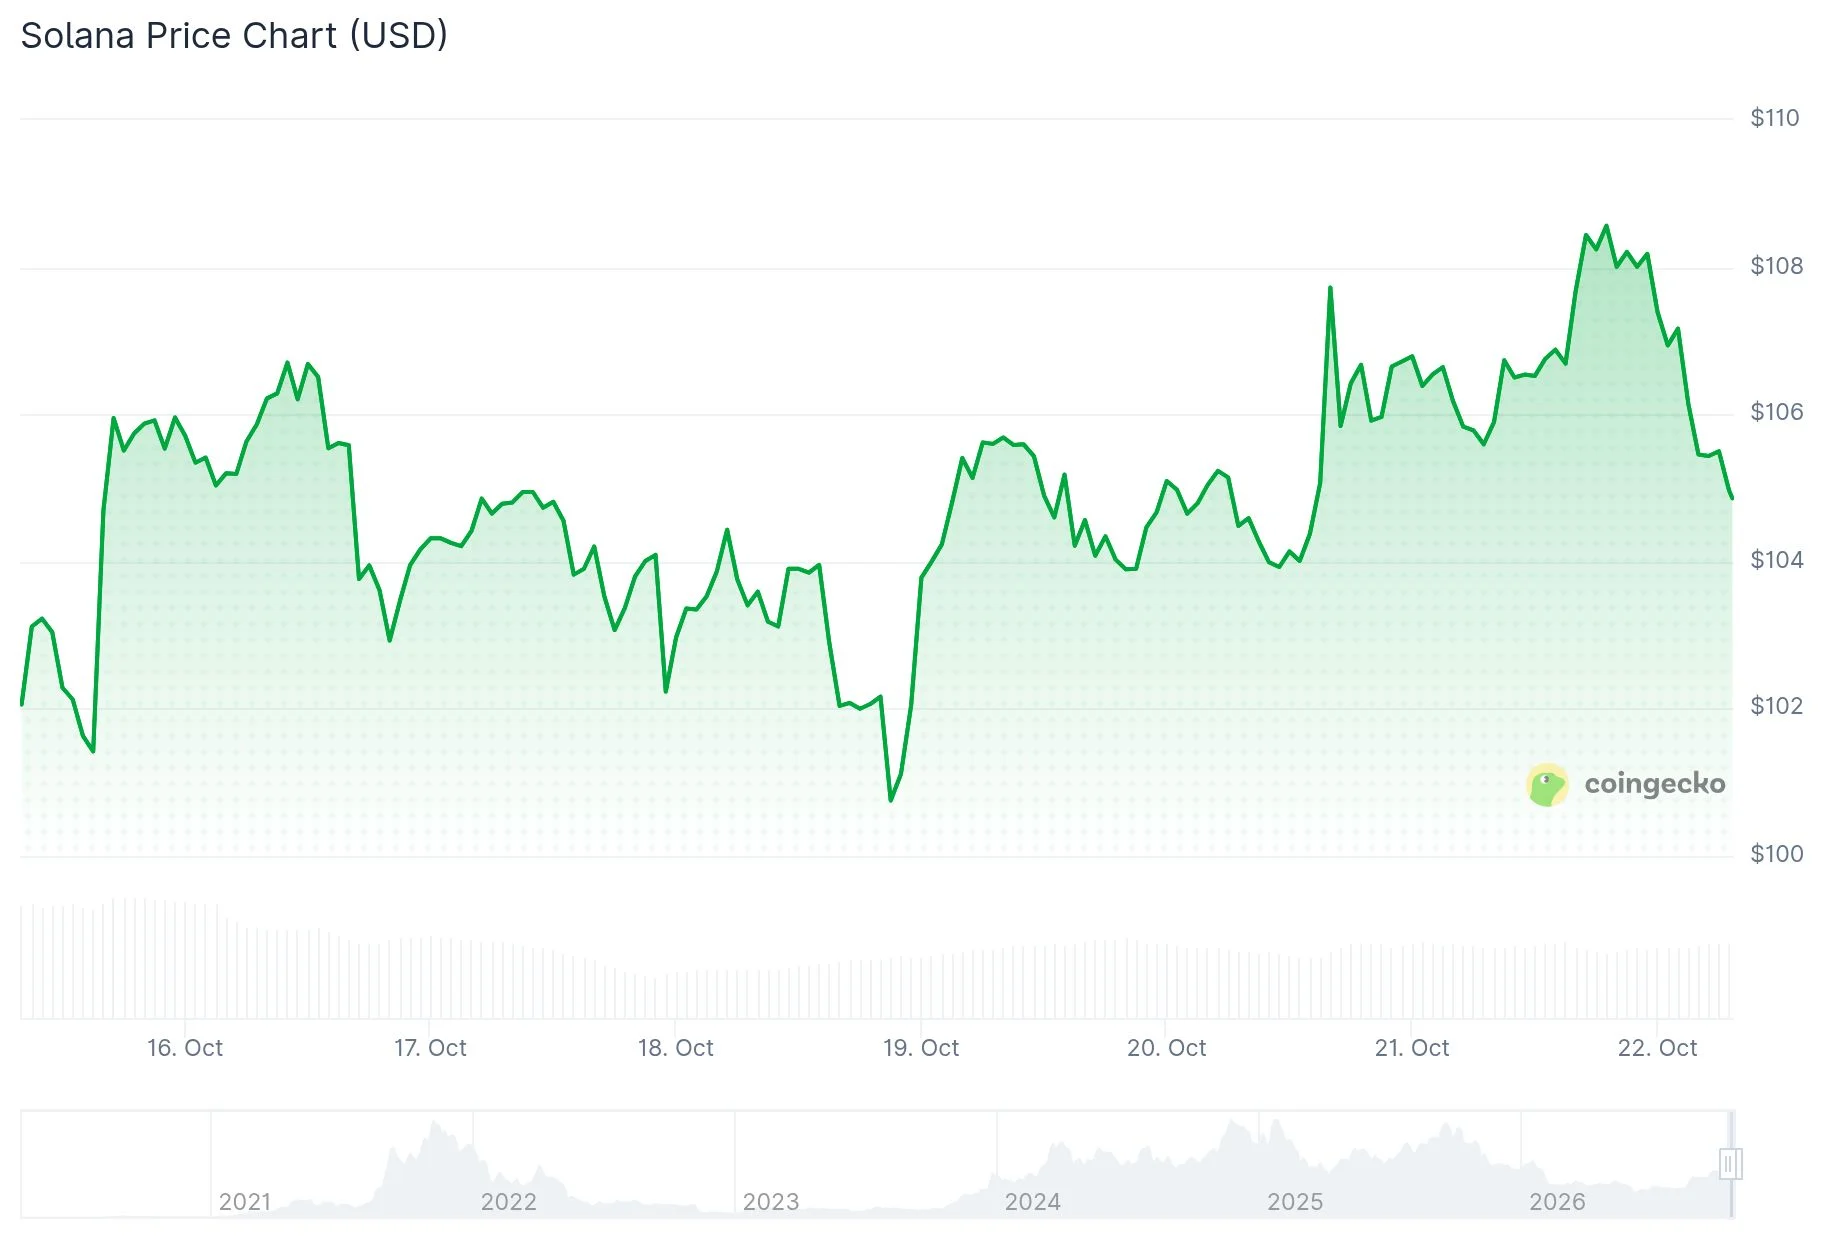
Current price: 104.91 USDT
Overall bias: Bearish in the near term; broader structure is mixed
Trade direction: NO_TRADE until price confirms either a support hold or a recovery above nearby resistance
Confidence score: 38/100 — this is a directional conviction score, not a probability. The price evidence leans bearish, but the short-term oversold reading and nearby support make an immediate entry less clear.

Scope note: The supplied data supports technical market analysis, not a full assessment of Solana’s fundamentals. The conclusions below are based on the provided OHLCV data and indicators. Perpetual-swap leverage can amplify losses; 100x leverage is especially hazardous.

1. Trend analysis

Short term: bearish pressure

Across the 5-minute and 15-minute charts, price has declined from roughly 105.6 toward 105.0, with a recent low of 104.66. Price is below the 5-minute and 15-minute EMA and SMA references provided, consistent with short-term weakness.

  • 5-minute RSI: 41.18, weak but not deeply oversold.
  • 15-minute RSI: 40.43, also showing downside momentum.
  • 5-minute MACD: below its signal line, with a negative histogram.
  • 15-minute MACD: still negative, although the slightly positive histogram suggests the pace of selling may be easing.

The 1-minute MACD histogram is positive, but that is a very short-horizon signal and does not reverse the broader intraday weakness on its own.

1-hour: sharply weak, potentially stretched

The 1-hour chart shows a fall from the 108–109 area toward 105. Price is below the listed 1-hour EMA and SMA levels, and MACD is negative.

The 1-hour RSI of 16.04 is an extreme oversold reading. This increases the chance of a short-lived bounce or consolidation, but oversold conditions are not a reliable reversal signal by themselves. Price can remain oversold during a strong downswing.

4-hour: prior recovery, now under pressure

The 4-hour chart had advanced from lows near 100 toward 109, but the latest candles have retreated toward 105. The 4-hour RSI is 56.57 and the MACD remains positive, which indicates the earlier recovery has not been fully invalidated on this timeframe. However, recent price action is weakening, and the supplied 4-hour indicator values do not align perfectly with the latest quoted price, so they should be treated cautiously.

Daily: corrective and below key averages

On the daily chart, SOL has fallen from the 120–123 area and remains below the listed 20-day SMA and 12/26-day EMAs. The daily MACD is negative, and RSI is 43.46, below neutral. This points to a corrective-to-bearish daily trend rather than a confirmed bullish recovery.

Trend takeaway: Intraday and daily momentum favor sellers. The 4-hour picture retains some evidence of a prior recovery, but that recovery is under pressure. The 1-hour oversold condition makes chasing downside at current levels less attractive.

2. Key support and resistance levels

Levels are approximate zones derived from the supplied candle highs/lows, closes, and indicator bands. They are not guaranteed turning points.

Support

  • 104.66–104.85: Immediate support zone. This includes the latest 1-hour/15-minute lows around 104.66–104.93 and the 5-minute lower Bollinger Band near 104.83. A sustained break below this area would weaken the near-term structure.
  • 103.60–104.00: Secondary support, based on recent 4-hour lows and nearby historical trading.
  • 100.34–102.40: Major broader support zone from the daily and 4-hour swing lows. A move into this area would represent a deeper correction.

Resistance

  • 105.15–105.30: First nearby resistance, around recent short-term averages and the local breakdown area.
  • 105.65–106.00: More significant near-term resistance, near recent 15-minute highs and the 4-hour middle-band/average region.
  • 106.20–107.20: Broader resistance cluster, including 1-hour moving averages and recent price congestion.
  • 108.24–109.17: Major overhead resistance from the latest swing high and recent 4-hour/1-hour highs.

Level interpretation: Holding above 104.66–104.85 could produce a relief bounce toward 105.3 and then 105.65–106.00. A decisive break below the immediate support zone would put 103.6–104.0 into focus, with the 100.34–102.40 area as deeper support.

3. Market structure and sentiment

The recent structure is characterized by lower prices from the 108–109 region and a sequence of weak short-term closes. This favors sellers in the immediate term. The latest 5-minute candle shows elevated volume relative to the stated 20-bar average, but the provided dataset alone cannot establish whether that volume represents aggressive selling, buying absorption, or position liquidation.

Sentiment signals are mixed:

  • Bearish: Price is below several short-term and daily moving-average references; 1-hour and daily MACD are negative; recent price action has retreated from the 109 area.
  • Potentially supportive of a bounce: 1-hour RSI is extremely oversold, and price is close to the 104.66–104.85 support zone.
  • Not established by the data: Futures funding, open interest, liquidation levels, order-book depth, spot-versus-perpetual flows, and broader market conditions are not provided. Therefore, claims about crowded positioning or a squeeze would be speculative.

The market appears vulnerable to further downside if support fails, but the oversold reading raises the risk of entering a short too late. Conversely, a bounce is not yet evidence of a trend reversal unless price reclaims resistance and holds it.

4. Overall directional bias

Bias: Bearish near term, but not a high-conviction short at the current price.

The balance of evidence favors downside while SOL remains below the 105.65–106.00 resistance zone and especially below the broader 106.20–107.20 area. However, immediate support near 104.66–104.85 and the very low 1-hour RSI create meaningful rebound risk.

A more constructive short-term signal would require price to reclaim and hold above 105.65–106.00, with stronger confirmation above 106.20–107.20. A sustained move below 104.66 would strengthen the bearish case and expose lower support zones.

Summary

  • Trend: Short-term and daily momentum are weak; the 4-hour recovery is losing strength.
  • Key support: 104.66–104.85, then 103.60–104.00, then 100.34–102.40.
  • Key resistance: 105.15–105.30, 105.65–106.00, then 106.20–107.20.
  • Directional view: Bearish, with elevated bounce risk from oversold conditions.
  • Trade direction: NO_TRADE pending a confirmed support break or a recovery through resistance.
  • Confidence score: 38/100 (modest bearish conviction; substantial near-term uncertainty).

News Analysis

Sinuri

Wala pang pagsusuri sa wikang ito. Ipinapakita ang pinakabago, nakasulat sa Ingles.

Near-term price action is slightly bearish due to treasury liquidation and whale exchange deposits, only partially offset by mildly positive ecosystem upgrades and balanced Polymarket signals.

SOL-USDT-SWAP Impact Analysis

Current price: $104.89

1. Net news impact

Overall: Slightly bearish in the next 24–72 hours, with a potential bullish offset from Solana ecosystem developments. The clearest near-term selling signals are the reported whale deposits to exchanges and SkyAI’s sale of its SOL treasury. The positive headlines may support sentiment, but there is not enough detail to conclude they will generate immediate, sustained SOL buying.

  • SkyAI liquidated its Solana treasury: This removes a source of SOL holdings and signals treasury-related supply may have entered the market. The reported buyback and possible insider-linked payout also raise governance and confidence concerns, which could weigh on SOL sentiment. Impact: bearish, though the amount of SOL sold and whether selling is already complete are not specified. Timeframe: near term, with any direct selling pressure potentially already reflected in the market.
  • Whale deposited 240,000 SOL, reported as $25.3 million, across exchanges: Exchange deposits can precede sales and may increase available supply. This is the strongest direct near-term bearish signal, but a deposit alone does not confirm a sale. Impact: bearish risk; watch for follow-through in price and exchange flows. Timeframe: immediate to the next few sessions.
  • Alpenglow upgrade completed: A successful upgrade can improve confidence in Solana’s technology and long-term usefulness, potentially supporting demand. The supplied item provides no specifics on adoption, performance, or market reaction, so the immediate price effect is uncertain. Impact: modestly bullish sentiment, more likely medium term than a near-term catalyst.
  • Pump.fun launched Pump Bridge: Easier crosschain trading could strengthen activity around a Solana-based platform and support ecosystem engagement. It does not by itself establish that users will buy or hold more SOL. Impact: mildly bullish, conditional on usage and sustained activity. Timeframe: near to medium term.
  • Meme-game commentary: The article highlights high failure and exploitation risks rather than a concrete Solana-specific launch or demand driver. Impact: largely neutral; any speculative risk appetite effect is uncertain.

2. What Polymarket sentiment indicates

The very short-term “Up or Down” markets are essentially balanced near 50/50, suggesting no clear directional conviction. Their reported liquidity is limited and volume is zero, so they are weak evidence of broad market confidence.

The longer-range thresholds are inconsistent in usefulness: the October 22 $130 outcome is assigned only 1.0% YES, while the $80 October 22 and $85 October 27–28 thresholds have high YES readings. Those figures indicate traders see a large move to the upper thresholds as unlikely, but they are not precise price forecasts—and the displayed markets have no reported 24-hour volume. Treat them as a low-confidence sentiment snapshot, not a trading signal.

3. Actionable view

Bias: Slightly bearish / cautious; not a high-conviction SHORT.

  • Avoid chasing LONGs until the whale-deposit concern is less active and price shows buyers absorbing potential supply.
  • Consider SHORT exposure only with confirmation—for example, continued downside after exchange-flow headlines or failed attempts to recover above the current $104.89 area. Use defined risk; the supplied data does not establish reliable technical support or resistance levels.
  • For LONGs, wait for evidence that selling pressure is being absorbed and that the upgrade or Pump Bridge news is translating into actual usage or demand.
  • Key risks to the bearish view: The whale may not sell, the treasury liquidation may already be priced in, or ecosystem news may attract buying.
  • Key risks to the bullish view: Further whale selling, continued supply from treasury-related activity, or weak follow-through from the upgrade and bridge launches.

Bottom line: Near-term supply signals outweigh the less direct positive ecosystem headlines, but the evidence supports caution rather than a forceful directional trade.

Mga Kaugnay na Balita

CoinCentralbullish

Grayscale Now Lets You Swap Bitcoin, Solana and XRP Directly for ETF Shares

TLDR Grayscale now lets eligible investors swap tokens directly for shares in 10 crypto products. Minimum investments range from about $80,300 to $364,800. Products cover Bitcoin, Ethereum, Solana, XRP, Dogecoin, Avalanche, Chainlink, Hyperliquid, Sui and Zcash. The SEC approved in-kind creations and redemptions for crypto ETPs in July 2025. Grayscale says fees, taxes and price changes still apply. Grayscale has expanded in-kind subscriptions to 10 of its crypto investm...

Buksan ang source
CoinCentralneutral
Solana (SOL) Price: Analyst Eyes Slow Grind Back to Local Highs as Alpenglow Goes Live

Solana (SOL) Price: Analyst Eyes Slow Grind Back to Local Highs as Alpenglow Goes Live

TLDR Solana’s Alpenglow upgrade went live on mainnet around 1:54 pm UTC on Wednesday, targeting finality of about 150 milliseconds. SOL trades near $107, up about 2.5% to 3% in 24 hours but down 9.9% in October. A new all-time high above $293 would require a climb of about 175%. Spot Solana ETFs hold about $1.65 billion in net assets and saw $2.6 million in outflows on October 20. Analyst Daan Crypto Trades says SOL has held up well and wants to see a slow grind back to l...

Buksan ang source
Crypto.newsbullish
Pump.fun launches Pump Bridge with faster crosschain trades and fewer errors

Pump.fun launches Pump Bridge with faster crosschain trades and fewer errors

Pump.fun has launched a new crosschain trading service called Pump Bridge, which has replaced Relay as the default option for users trading across different blockchains through its mobile app. In an October 22 announcement on X, the Solana-based memecoin platform…

Buksan ang source
CoinDeskbullish
Solana completes Alpenglow upgrade. Here’s what it means for users

Solana completes Alpenglow upgrade. Here’s what it means for users

Buksan ang source

Mga Tradable Market

I-browse ang bawat supported spot at perpetual market ayon sa exchange, pagkatapos ay simulan agad ang analysis.

Panahon
Panahon ng Kalakalan
Direksyon

Ranking ng Model ng SOL

Suriin kung paano gumaganap ang SOL sa iba't ibang model sa ilalim ng kasalukuyang filter.

Ayusin ayon sa
#Model
  1. 1DeepSeek Flashdeepseek-flash · DeepSeek63.6%Bilang ng Kalakalan4463.6%Karaniwang R+0.47RAverage na Panahon ng Hawak22 oras 14 min
  2. 2DeepSeek V4 Prodeepseek-v4-pro · DeepSeek63.5%Bilang ng Kalakalan7463.5%Karaniwang R+0.31RAverage na Panahon ng Hawak1 araw 1 oras
  3. 3Grok 4.1 Fast ReasoningHindi na ginagamitgrok-4-1-fast-reasoning · xAI62.9%Bilang ng Kalakalan3562.9%Karaniwang R+0.26RAverage na Panahon ng Hawak21 oras 29 min
  4. 4Grok 4.6grok-4.6 · xAI54.0%Bilang ng Kalakalan6354.0%Karaniwang R+0.26RAverage na Panahon ng Hawak13 oras 51 min
  5. 5Claude Sonnet 5.5claude-sonnet-5-5 · Anthropic53.6%Bilang ng Kalakalan2853.6%Karaniwang R+0.19RAverage na Panahon ng Hawak1 araw 5 oras
  6. 6GLM 5.3glm-5.3 · Z.ai52.6%Bilang ng Kalakalan7852.6%Karaniwang R+0.17RAverage na Panahon ng Hawak14 oras 38 min
  7. 7Gemini 3.8 Flashgemini-3.8-flash · Google51.7%Bilang ng Kalakalan6051.7%Karaniwang R+0.16RAverage na Panahon ng Hawak16 oras 56 min
  8. 8Kimi K2.6kimi-k2.6 · Kimi44.6%Bilang ng Kalakalan7444.6%Karaniwang R+0.16RAverage na Panahon ng Hawak12 oras 28 min
  9. 9Gemini 3.1 Pro Previewgemini-3.1-pro-preview · Google44.9%Bilang ng Kalakalan7844.9%Karaniwang R+0.08RAverage na Panahon ng Hawak14 oras 28 min
  10. 10Qwen 3.8 Maxqwen3.8-max · Qwen46.1%Bilang ng Kalakalan7646.1%Karaniwang R+0.07RAverage na Panahon ng Hawak15 oras 43 min
  11. 11Grok 4 Fast Non-ReasoningHindi na ginagamitgrok-4-fast-non-reasoning · xAI67.3%Bilang ng Kalakalan11067.3%Karaniwang R+0.03RAverage na Panahon ng Hawak20 min
  12. 12Claude Opus 5.5claude-opus-5-5 · Anthropic47.2%Bilang ng Kalakalan3647.2%Karaniwang R+0.03RAverage na Panahon ng Hawak1 araw 0 oras
  13. 13Qwen Maxqwen-max · Qwen66.3%Bilang ng Kalakalan9666.3%Karaniwang R+0.02RAverage na Panahon ng Hawak22 min
  14. 14Grok 4.5grok-4.5 · xAI53.0%Bilang ng Kalakalan6753.0%Karaniwang R+0.02RAverage na Panahon ng Hawak53 min
  15. 15GPT-4o Minigpt-4o-mini · OpenAI59.4%Bilang ng Kalakalan17659.4%Karaniwang R+0.01RAverage na Panahon ng Hawak1 oras 54 min
  16. 16Gemini 2.5 Flash-Litegemini-2.5-flash-lite · Google59.5%Bilang ng Kalakalan16259.5%Karaniwang R0.00RAverage na Panahon ng Hawak2 oras 10 min
  17. 17Grok 4.3grok-4.3 · xAI51.1%Bilang ng Kalakalan18751.1%Karaniwang R0.00RAverage na Panahon ng Hawak9 oras 22 min
  18. 18Grok 4.1 Fast Non-ReasoningHindi na ginagamitgrok-4-1-fast-non-reasoning · xAI51.2%Bilang ng Kalakalan4351.2%Karaniwang R-0.01RAverage na Panahon ng Hawak10 min
  19. 19DeepSeek V3.2Hindi na ginagamitdeepseek-chat · DeepSeek44.4%Bilang ng Kalakalan6344.4%Karaniwang R-0.02RAverage na Panahon ng Hawak33 min
  20. 20Kimi K3kimi-k3 · Kimi44.3%Bilang ng Kalakalan8844.3%Karaniwang R-0.02RAverage na Panahon ng Hawak13 oras 37 min
  21. 21GPT-6 Astragpt-6-astra · OpenAI44.8%Bilang ng Kalakalan8744.8%Karaniwang R-0.06RAverage na Panahon ng Hawak8 oras 26 min
  22. 22GPT-6 Lunagpt-6-luna · OpenAI42.9%Bilang ng Kalakalan2842.9%Karaniwang R-0.20RAverage na Panahon ng Hawak23 oras 54 min
  23. 23Grok 4.7grok-4.7 · xAI36.6%Bilang ng Kalakalan4136.6%Karaniwang R-0.21RAverage na Panahon ng Hawak14 oras 50 min
  24. 24GPT-6.1 Solgpt-6.1-sol · OpenAI30.8%Bilang ng Kalakalan3930.8%Karaniwang R-0.29RAverage na Panahon ng Hawak10 oras 47 min
Wala pang ranggo · 9Kulang sa 20 kalakalan sa view na ito, kaya nakalista lang ang mga modelong ito at hindi niraranggo.
  1. –Gemini 3.5 FlashHindi na ginagamitgemini-3.5-flash · Google66.7%Bilang ng Kalakalan366.7%Karaniwang R+0.99RAverage na Panahon ng Hawak3 oras 49 min
  2. –GPT-5.4gpt-5.4 · OpenAI50.0%Bilang ng Kalakalan450.0%Karaniwang R+0.49RAverage na Panahon ng Hawak2 oras 52 min
  3. –GPT-5.5gpt-5.5 · OpenAI66.7%Bilang ng Kalakalan666.7%Karaniwang R+0.31RAverage na Panahon ng Hawak6 min
  4. –Gemini 2.5 Flashgemini-2.5-flash · Google60.0%Bilang ng Kalakalan1560.0%Karaniwang R+0.19RAverage na Panahon ng Hawak1 araw 8 oras
  5. –Gemini 3 Flash Previewgemini-3-flash-preview · Google56.2%Bilang ng Kalakalan1656.2%Karaniwang R+0.14RAverage na Panahon ng Hawak1 araw 6 oras
  6. –Grok 4.20 Non-Reasoninggrok-4.20-0309-non-reasoning · xAI57.1%Bilang ng Kalakalan757.1%Karaniwang R+0.02RAverage na Panahon ng Hawak6 min
  7. –Claude Haiku 4.5Hindi na ginagamitclaude-haiku-4-5-20251001 · Anthropic50.0%Bilang ng Kalakalan1250.0%Karaniwang R0.00RAverage na Panahon ng Hawak1 oras 22 min
  8. –Gemini 2.0 Flash-LiteHindi na ginagamitgemini-2.0-flash-lite · Google50.0%Bilang ng Kalakalan1250.0%Karaniwang R0.00RAverage na Panahon ng Hawak1 oras 22 min
  9. –GPT-5.2gpt-5.2 · OpenAI25.0%Bilang ng Kalakalan425.0%Karaniwang R-0.89RAverage na Panahon ng Hawak35 min

Mga Nangungunang Model

Ang tatlong pinakamahusay na model sa ilalim ng kasalukuyang filter.

Bakit gamitin ang Solana page na ito

Tingnan kung paano gumaganap ang mga AI model sa Solana, ihambing ang mga live market ayon sa exchange, at piliin ang eksaktong pair na gusto mong buksan.

Gamitin ang page na ito kapag gusto mong lumipat mula sa asset-level ranking patungo sa isang partikular na live market.

Mga Kaugnay na Asset

Magpatuloy sa iba pang mga asset page na mataas ang interes.

Kaugnay na pananaliksik

Higit pa sa Mga siklo ng crypto

FAQ

Saan nagmumula ang mga SOL pair?

Ito ang mga live SOL market na kasalukuyang available sa mga supported exchange. Gamitin ang mga ito para ihambing ang spot at perpetual na pagpipilian, pagkatapos ay buksan ang market na gusto mong suriin.

Ano ang mangyayari pagkatapos pindutin ang simulan ang analysis?

Bubuksan mo ang Live na may napiling market na naka-fill in na, at magsisimula agad ang analysis. Dahil dito, makakapunta ka agad mula sa page na ito patungo sa market na gusto mong suriin.

Ang pinakamahusay na SOL model ba ay laging ang pinakamahusay na pair para i-trade?

Hindi palagi. Ang malakas na model sa SOL ay hindi nangangahulugang pare-pareho ang performance sa lahat ng exchange at uri ng kontrata, kaya ipinapakita ng page na ito ang overall model ranking at ang mga partikular na market na maaari mong buksan.