
 By Muke
Inside NIO's 2Q 2026 Results: Deliveries, Margins and the Cost Base
The central question for NIO earnings 2026 is no longer whether the company can increase deliveries. NIO has already demonstrated a dramatic rebound in volume. Deliveries reached 35,934 vehicles in July 2026, up 71% year over year, while year-to-date deliveries reached 227,057 units, an increase of 68%. NIO’s July 2026 delivery update
The more difficult question is whether this growth can finally translate into sustainable profits, positive free cash flow and a stronger balance sheet.
NIO entered 2026 with improving operating momentum. It delivered 191,123 vehicles in the first half of the year, up 67.4% from the prior-year period. June deliveries reached 40,597 vehicles, including contributions from the premium NIO brand, the family-oriented ONVO brand and the smaller FIREFLY brand. NIO’s first-half 2026 delivery data
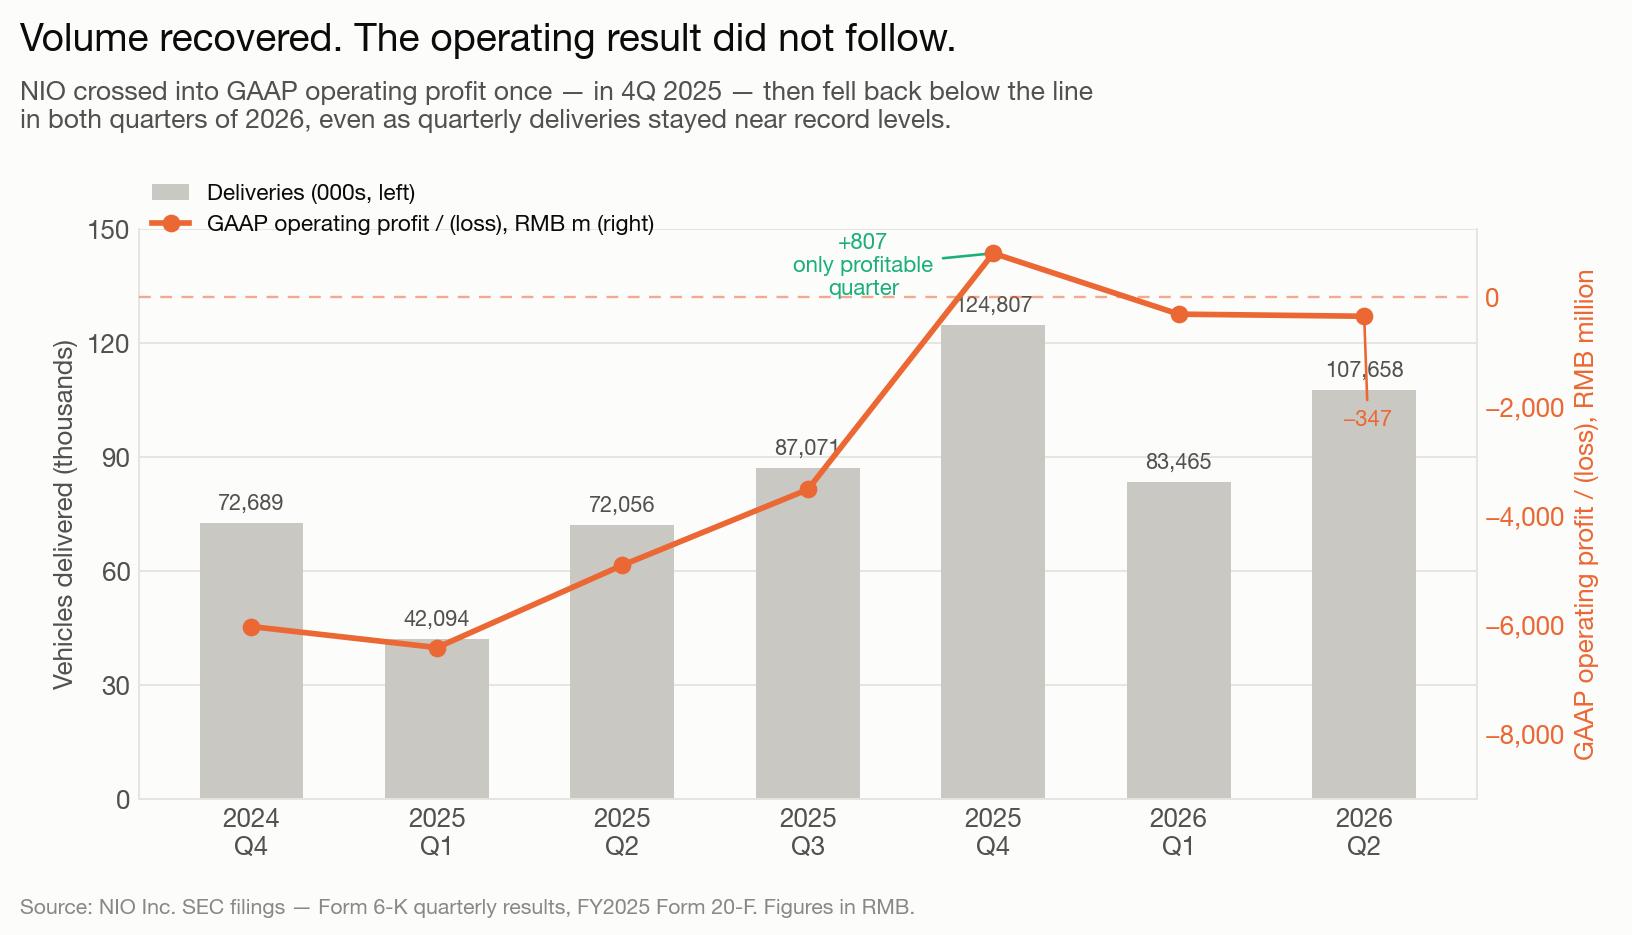
Yet the company is still recovering from years of heavy losses, intense price competition and expensive product development. NIO’s full-year 2025 net loss was RMB14.9 billion, even though the loss narrowed significantly from 2024. The company posted its first quarterly profit — on both a non-GAAP and a GAAP basis — in the fourth quarter of 2025, and it has not repeated it since.
This research analyzes NIO’s latest earnings trends, delivery growth, vehicle margins, product strategy, battery swapping, competition, cash needs and the conditions required for a durable turnaround. SimianX AI can help investors track these variables by combining financial statements, technical indicators, news flow and market sentiment in one research process.
NIO’s Business Model in 2026
NIO is more than a premium electric-car manufacturer. Its business includes:
- Vehicle sales under the NIO premium brand.
- ONVO vehicles aimed at family and mass-market buyers.
- FIREFLY compact smart EVs.
- Battery-as-a-service subscriptions.
- Battery-swapping stations.
- Charging and energy services.
- Software, autonomous-driving and connectivity features.
- Financing and other related services.
This structure gives NIO several potential revenue streams, but it also creates a relatively complex cost base. Vehicle manufacturing requires factories, tooling, batteries, labor and logistics. Battery swapping requires a network of expensive stations. Software development requires continuing research and engineering investment.
NIO’s strategy is therefore based on long-term ecosystem economics. The company hopes that customers who enter through vehicles will later generate recurring revenue through battery subscriptions, services, charging, upgrades and software.
The problem is timing. Investors must fund the infrastructure before the installed customer base is large enough to produce attractive returns.
What NIO’s 2Q 2026 Earnings Actually Show
NIO's second-quarter 2026 results, released on 1 September 2026, answer part of the question this article set out to ask. Deliveries rose 49.4% year over year to 107,658 vehicles. Total revenues rose 69.1% to RMB32,136.9 million. Gross profit more than tripled, up 211.3% to RMB5,906.5 million. And the company still lost money — a GAAP net loss of RMB528.0 million, wider than the RMB332.1 million it lost in the first quarter. NIO's second-quarter 2026 results
That combination — near-record volume, transformed margins, a wider loss — is the whole story of this stock, and it only becomes legible across a full run of quarters.
The reference table below is the core dataset for everything that follows. Every figure is taken from NIO's own filings.
| Quarter | Deliveries | Vehicle sales (RMB m) | Vehicle margin | Total revenue (RMB m) | Gross margin | GAAP operating result (RMB m) | GAAP net result (RMB m) |
|---|---|---|---|---|---|---|---|
| 4Q 2024 | 72,689 | 17,475.6 | 13.1% | 19,703.4 | 11.7% | (6,032.9) | (7,111.5) |
| 1Q 2025 | 42,094 | 9,939.3 | 10.2% | 12,034.7 | 7.6% | (6,418.1) | (6,750.0) |
| 2Q 2025 | 72,056 | 16,136.1 | 10.3% | 19,008.7 | 10.0% | (4,908.9) | (4,994.8) |
| 3Q 2025 | 87,071 | 19,202.3 | 14.7% | 21,793.9 | 13.9% | (3,521.5) | (3,480.5) |
| 4Q 2025 | 124,807 | 31,606.2 | 18.1% | 34,650.2 | 17.5% | 807.3 | 282.7 |
| 1Q 2026 | 83,465 | 22,783.7 | 18.8% | 25,532.7 | 19.0% | (308.8) | (332.1) |
| 2Q 2026 | 107,658 | 29,058.2 | 18.5% | 32,136.9 | 18.4% | (347.2) | (528.0) |
Figures in parentheses are losses. Sources: NIO Form 6-K quarterly results releases and the FY2025 Form 20-F.
Three things stand out.
NIO has already been profitable — once. The fourth quarter of 2025 was not merely the first quarter of non-GAAP operating profit. It produced a GAAP operating profit of RMB807.3 million and a GAAP net profit of RMB282.7 million. That is routinely lost in the coverage, and it changes the question. It is no longer whether NIO can reach profitability. It is whether NIO can hold it — and it has not held it for two quarters running.
The margin repair is real, and it is nearly finished. Vehicle margin went from 10.3% in the second quarter of 2025 to 18.5% a year later, a gain of 820 basis points. But it has now been flat across three quarters — 18.1%, 18.8%, 18.5% — and gross margin slipped 60 basis points sequentially in the second quarter. The easy part of the repair is done. Whatever comes next has to come from cost, not from price.
The 2025 full-year figures explain why the balance sheet held. Net loss for 2025 was RMB14,942.6 million, with an operating loss of RMB14,041.2 million against RMB21,874.1 million in 2024. More consequentially, operating cash flow turned positive at RMB2.99 billion, against negative RMB7.85 billion the year before. That swing, not the narrower loss, is what bought NIO its room to manoeuvre. NIO 2025 annual report on Form 20-F
The growth rate is decelerating faster than the losses are shrinking
The 71% in this article's title is July 2026's year-over-year delivery growth. It is accurate, and it is already stale. The monthly record for 2026 shows how quickly the comparison base caught up:
| Month (2026) | Deliveries | Year-over-year growth |
|---|---|---|
| January | 27,182 | +96.1% |
| February | 20,797 | +57.6% |
| March | 35,486 | +136.0% |
| April | 29,356 | +22.8% |
| May | 37,705 | +62.3% |
| June | 40,597 | +62.9% |
| July | 35,934 | +71.0% |
| August | 35,836 | +14.5% |
August 2026 deliveries grew 14.5% year over year — the slowest month of the year by a wide margin and a sharp step down from July. Volume has also stopped rising sequentially: 40,597 in June, then 35,934, then 35,836. Cumulative deliveries for 2026 stood at 262,893 as of 31 August. NIO's August 2026 delivery update
Management has guided third-quarter deliveries to between 108,000 and 111,000 vehicles, growth of 24.0% to 27.5%. That is a perfectly healthy number for a maturing automaker. It is a very different number from 71%, and any thesis built on the July headline needs to be rebuilt on this one.
NIO has already crossed into profit once and fallen back. The open question is no longer whether the model can work at scale — it is whether the cost base will hold still long enough to let it.
Can 71% Delivery Growth End NIO’s Losses?
July 2026’s 71% year-over-year delivery increase is significant, but delivery growth alone does not guarantee profitability — and, as the monthly table above shows, that growth rate did not survive August.
A vehicle maker can sell more cars and still lose money if:
- Average selling prices decline.
- Discounts and subsidies increase.
- Battery and raw-material costs rise.
- New factories operate below capacity.
- Sales and marketing expenses grow faster than revenue.
- Research-and-development spending remains elevated.
- Warranty, service and charging costs increase with the installed base.
For NIO, the key financial formula is:
Vehicle gross profit = vehicle revenue – bill of materials – manufacturing cost – logistics – warranty and service costs
The company must improve this equation while also controlling corporate expenses.
Higher deliveries can help in several ways. Fixed manufacturing costs are spread over more vehicles, purchasing power improves, factories approach efficient utilization and service-network costs become more productive. But these benefits appear only if NIO avoids excessive discounting.
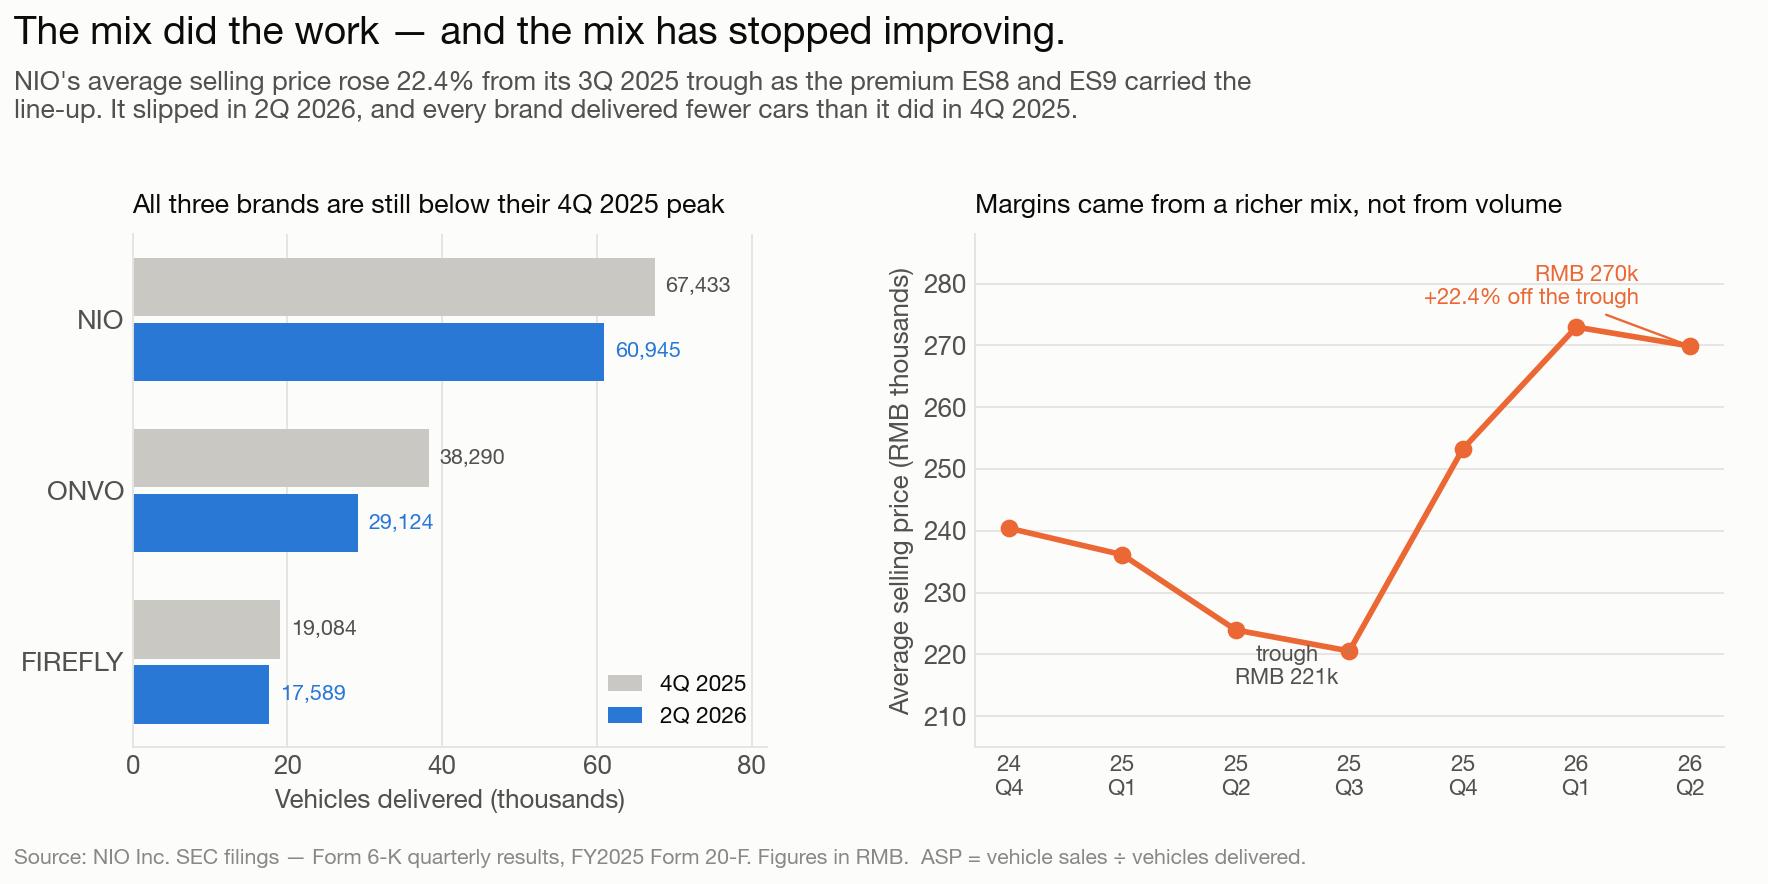
Product mix is more important than headline volume
NIO’s premium vehicles may generate stronger gross margins but have a smaller addressable market. ONVO and FIREFLY can expand the customer base, but lower-priced models may produce thinner margins.
A successful 2026 product mix would combine:
- Premium NIO vehicles that support brand positioning.
- ONVO models that increase volume.
- FIREFLY models that improve factory utilization.
- Software and service revenue that raises lifetime customer value.
A weak outcome would be rapid growth driven mainly by low-margin vehicles sold with aggressive incentives.
NIO’s Vehicle Margin Challenge
Vehicle margin is likely to be the most important line item in upcoming NIO earnings reports, and at 18.5% it is now the part of the model with the least room left to improve.
NIO’s gross margin improved materially in late 2025 and early 2026 as deliveries increased and product mix improved. But China’s EV market remains intensely competitive. Tesla, BYD, Li Auto, XPeng, Zeekr, Xiaomi and numerous other manufacturers continue to launch new models and adjust prices.
NIO must balance three objectives:
| Objective | Benefit | Risk |
|---|---|---|
| Lower prices | Increases demand and market share | Compresses vehicle margin |
| Premium pricing | Protects profitability and brand value | Limits volume growth |
| More affordable models | Expands addressable market | May dilute brand and lower margins |
The company’s battery-swapping system may support residual values and customer convenience, but it also requires capital expenditure and ongoing maintenance. If station utilization is low, the network becomes a fixed-cost burden. If utilization rises with vehicle growth, battery swapping could become a meaningful competitive advantage.
Investors should monitor:
- Vehicle gross margin.
- Gross margin excluding battery-subscription services.
- Average selling price.
- Discounts per vehicle.
- Sales and marketing expense per delivery.
- Warranty and service costs.
- Factory utilization.
Why ONVO and FIREFLY Matter
NIO’s original premium positioning created brand recognition but limited volume. The ONVO and FIREFLY sub-brands are designed to solve that problem.
ONVO
ONVO targets family buyers who want space, intelligent features and a more accessible price than NIO’s flagship vehicles. Strong ONVO demand could help NIO achieve scale without abandoning its technology and service ecosystem.
FIREFLY
FIREFLY is positioned as a smaller smart-electric vehicle brand. Compact EVs can address urban consumers and international markets, but this segment is highly price-sensitive. FIREFLY must achieve meaningful volume while maintaining acceptable margins.
The three-brand strategy gives NIO a larger market opportunity, but it also creates execution risks:
- More platforms and components.
- More marketing campaigns.
- More inventory complexity.
- Greater supply-chain coordination.
- Potential internal cannibalization.
The best-case outcome is that each brand serves a distinct customer segment. The worst-case outcome is that NIO spreads resources across too many models without achieving sufficient scale in any one category.
China’s EV Price War and Competitive Pressure
China’s electric-vehicle market is expanding, but competition is severe. Automakers compete on price, battery range, intelligent-driving software, charging speed, cabin technology, financing and after-sales service.
BYD has scale and vertical integration. Tesla has brand recognition and manufacturing efficiency. Li Auto has focused on family-oriented vehicles. XPeng competes aggressively in smart-driving technology. Xiaomi has used its consumer-electronics ecosystem and strong brand awareness to enter the EV market.
NIO’s response is differentiation through:
- Premium user services.
- Battery swapping.
- Advanced vehicle software.
- Dedicated charging infrastructure.
- Lifestyle communities and customer events.
- Multiple price tiers through ONVO and FIREFLY.
These features can create customer loyalty, but they also increase operating costs. NIO must prove that customers are willing to pay enough for the ecosystem to offset the expense of maintaining it.
Battery Swapping: Moat or Capital Burden?
Battery swapping remains one of NIO’s most distinctive technologies. Instead of waiting to recharge, drivers can exchange a depleted battery for a charged one at a swapping station.
Potential advantages include:
- Faster refueling than conventional charging.
- Lower upfront vehicle price through battery-as-a-service.
- Easier battery upgrades.
- Better control over battery health.
- More predictable energy-service revenue.
Potential disadvantages include:
- High station construction costs.
- Battery inventory requirements.
- Maintenance and labor expenses.
- Limited network density outside major markets.
- Technology-standardization challenges.
- Uncertain payback period.
The economic value of battery swapping depends heavily on utilization. If a station serves only a small number of vehicles per day, depreciation and staffing costs can overwhelm subscription revenue. If NIO reaches a large installed base, the same infrastructure could become a high-retention platform advantage.
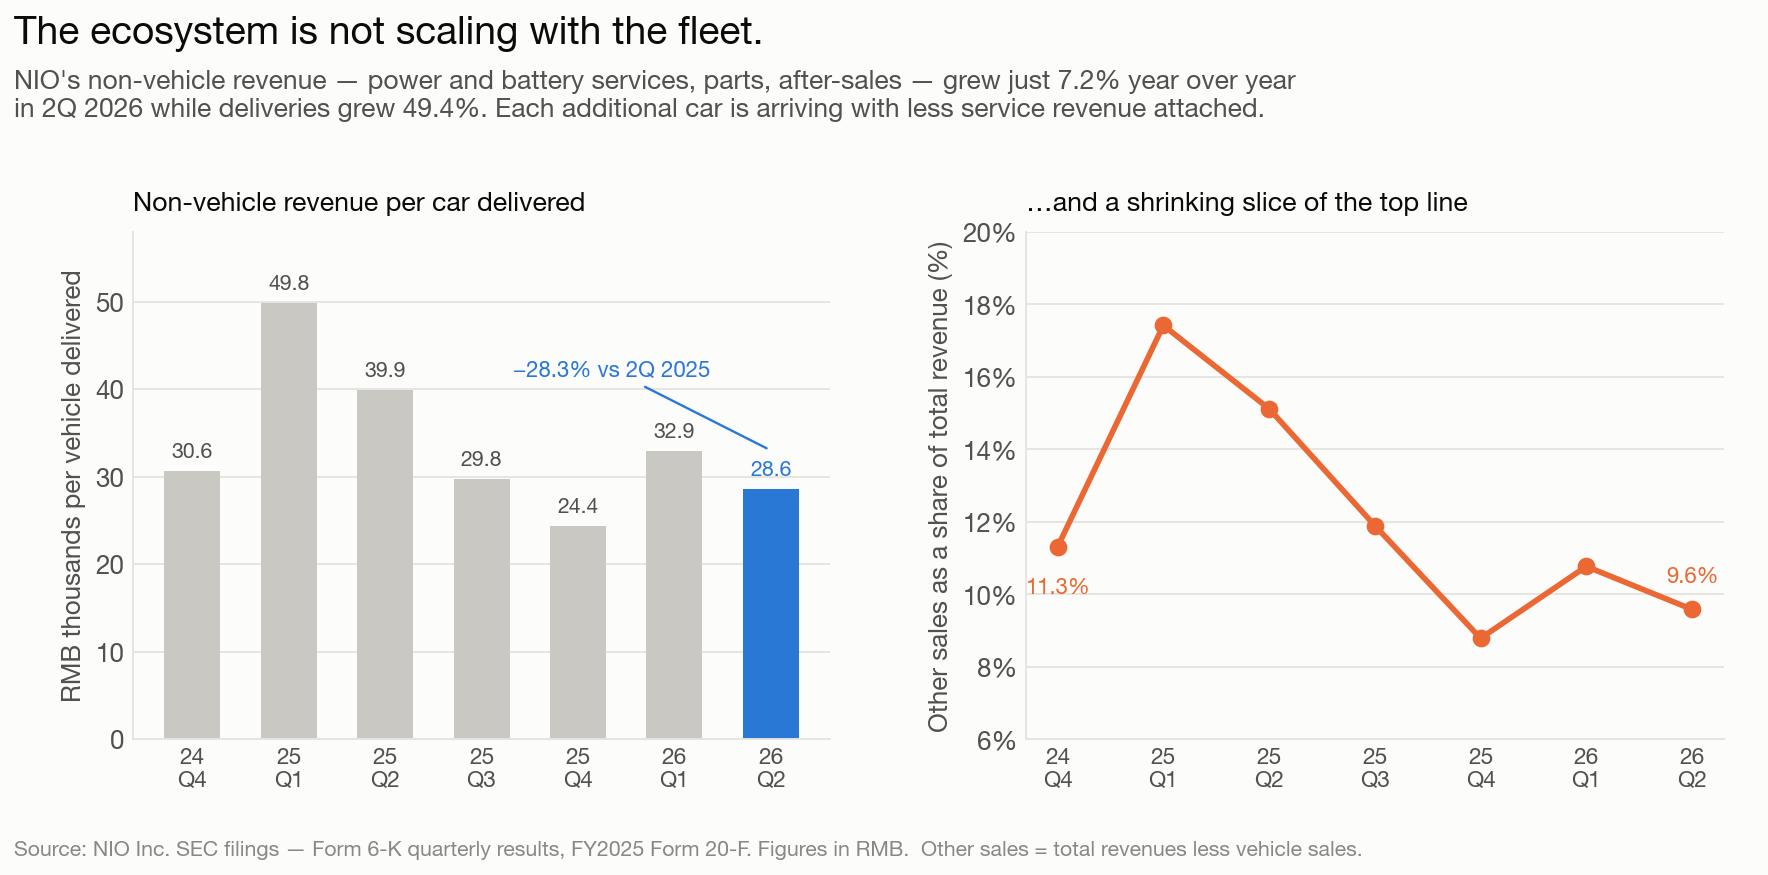
In 2026, investors should focus less on the number of swapping stations and more on revenue and gross profit per station. The second-quarter numbers make the point bluntly: other sales — the line that carries power services, parts and after-sales — grew just 7.2% year over year while deliveries grew 49.4%, and fell to 9.6% of total revenue.
NIO’s Cash Position and Financing Risk
NIO ended 2025 with approximately RMB45.9 billion in cash, restricted cash, short-term investments and long-term time deposits. That balance rose to RMB48.2 billion by March 31, 2026 and to RMB56.7 billion by June 30, 2026 — the strongest liquidity position in the company’s history. NIO Q1 2026 financial results
This liquidity provides breathing room, but it should not be interpreted as excess cash that can be distributed freely. NIO still has to finance:
- New model development.
- Battery and semiconductor purchases.
- Sales and service centers.
- Charging and swapping infrastructure.
- International expansion.
- Software and autonomous-driving research.
- Debt repayment and working capital.
The critical question is whether positive operating cash flow continues as deliveries grow. If NIO becomes operationally profitable but must spend heavily on factories and swapping stations, free cash flow may remain negative.
Investors should track:
Free cash flow = operating cash flow – capital expenditures
A durable turnaround requires both positive operating cash flow and declining capital intensity over time.
The Operating-Leverage Hurdle: What NIO Has to Earn to Break Even
Everything above reduces to one piece of arithmetic. In the second quarter of 2026 NIO earned RMB5,906.5 million of gross profit and carried RMB6,253.7 million of operating expenses, net of other operating income. The difference — RMB347.2 million — is the operating loss. Nothing else in the model matters until those two lines cross.
That gives a threshold worth tracking every quarter. Call it the operating-leverage hurdle: operating expenses divided by gross profit. Above 1.00 the company loses money at the operating line however fast revenue grows. Below 1.00 it does not.
| Quarter | Gross profit (RMB m) | Operating expenses, net (RMB m) | Hurdle | Operating result per vehicle (RMB) |
|---|---|---|---|---|
| 4Q 2024 | 2,308.9 | 8,341.8 | 3.61 | (82,996) |
| 1Q 2025 | 919.6 | 7,337.7 | 7.98 | (152,471) |
| 2Q 2025 | 1,897.5 | 6,806.4 | 3.59 | (68,126) |
| 3Q 2025 | 3,024.6 | 6,546.1 | 2.16 | (40,444) |
| 4Q 2025 | 6,074.1 | 5,266.8 | 0.87 | 6,468 |
| 1Q 2026 | 4,859.1 | 5,167.9 | 1.06 | (3,700) |
| 2Q 2026 | 5,906.5 | 6,253.7 | 1.06 | (3,225) |
Operating expenses, net = gross profit less the GAAP operating result. Per-vehicle figures are the operating result divided by deliveries in the quarter. Figures in parentheses are losses.
Read down the last column and the turnaround is unmistakable. NIO lost RMB152,471 per car in the first quarter of 2025 and RMB3,225 per car in the second quarter of 2026. On a unit basis the second quarter was actually better than the first: the loss per vehicle narrowed 12.8%. The absolute loss grew only because the volume grew.
Read the hurdle column and the problem is equally clear. It has fallen below 1.00 exactly once. It has now sat at about 1.06 for two consecutive quarters. At 1.06, gross profit has to grow roughly 6% faster than operating expenses in percentage terms just to hold the loss flat — and that is before any growth in the loss-making lines below the operating line.
This is not an electric-vehicle problem; it is a scale problem. PayPal hit the same arithmetic in the same quarter — payment volume up 10%, transaction-margin dollars up just 1.5% — and PDD's 2026 results showed revenue rising while profit fell 15%. Growth only reaches the bottom line when the cost base grows more slowly than it does.
Why a RMB1.05 billion rise in gross profit did not close the gap
Between the first and second quarters of 2026, gross profit rose RMB1,047.4 million, up 21.6%. Operating expenses rose RMB1,085.8 million, up 21.0%. Operating expenses grew more slowly in percentage terms and still grew more in absolute terms, because they start from the larger base. The operating loss widened by RMB38.4 million.
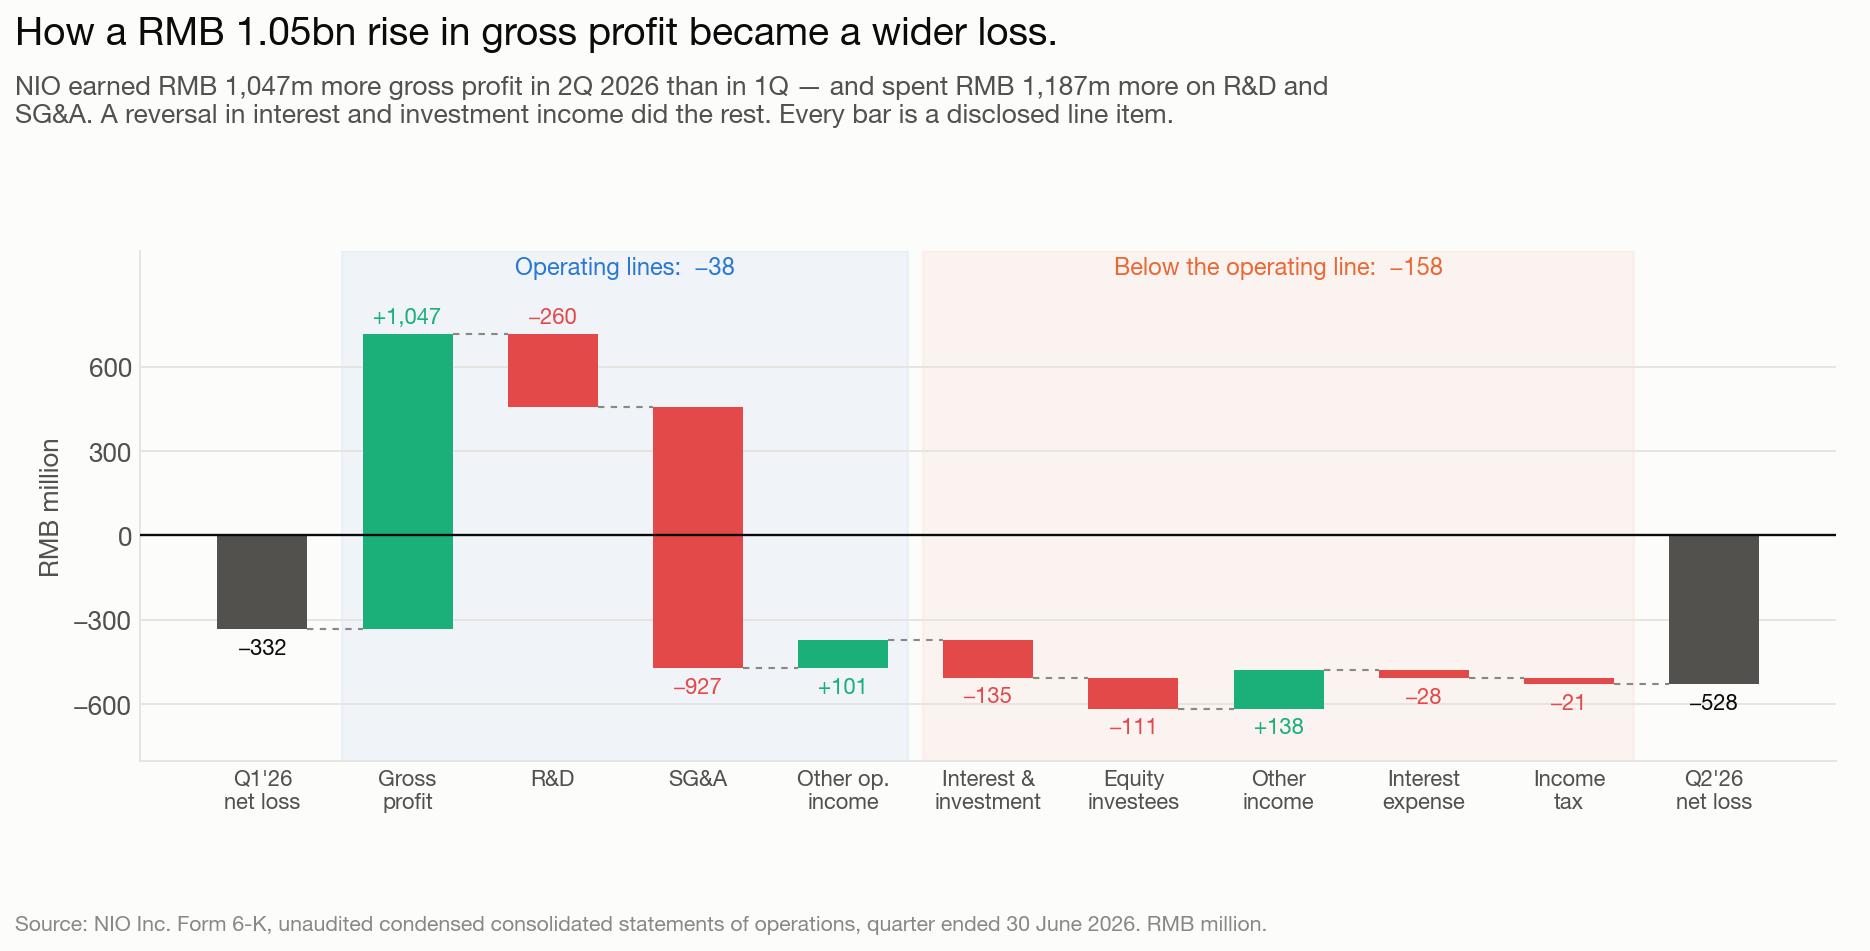
Below the operating line the arithmetic got worse. Interest and investment income swung from positive RMB115.9 million to negative RMB19.0 million, and losses at equity investees grew by RMB111.5 million. Together with higher interest expense and tax, that is a further RMB157.5 million. RMB38.4 million from operations plus RMB157.5 million from below the line is exactly the RMB195.9 million by which the net loss widened.
One further drag is easy to miss. Accretion on redeemable non-controlling interests — the cost of the outside money in NIO's Shenji intelligent-driving chip subsidiary — was RMB192.3 million in the quarter, up from RMB165.0 million. That is why the net loss attributable to ordinary shareholders, RMB721.6 million, is so much larger than the RMB528.0 million headline net loss. Annualised, it is roughly a RMB770 million charge that never appears in the number most readers see.
The revenue figure NIO has to reach
Hold the second quarter's 18.4% gross margin and its RMB6,253.7 million cost base constant, and the revenue at which NIO covers its operating expenses is straightforward to compute:
Break-even revenue = operating expenses ÷ gross margin = 6,253.7 ÷ 0.184 ≈ RMB33,988 million
That is RMB1.85 billion — 5.8% — above the second quarter's RMB32,136.9 million. Translated into cars at the quarter's revenue mix, it is roughly 113,900 deliveries in a single quarter, a level NIO has reached only once, in the fourth quarter of 2025.
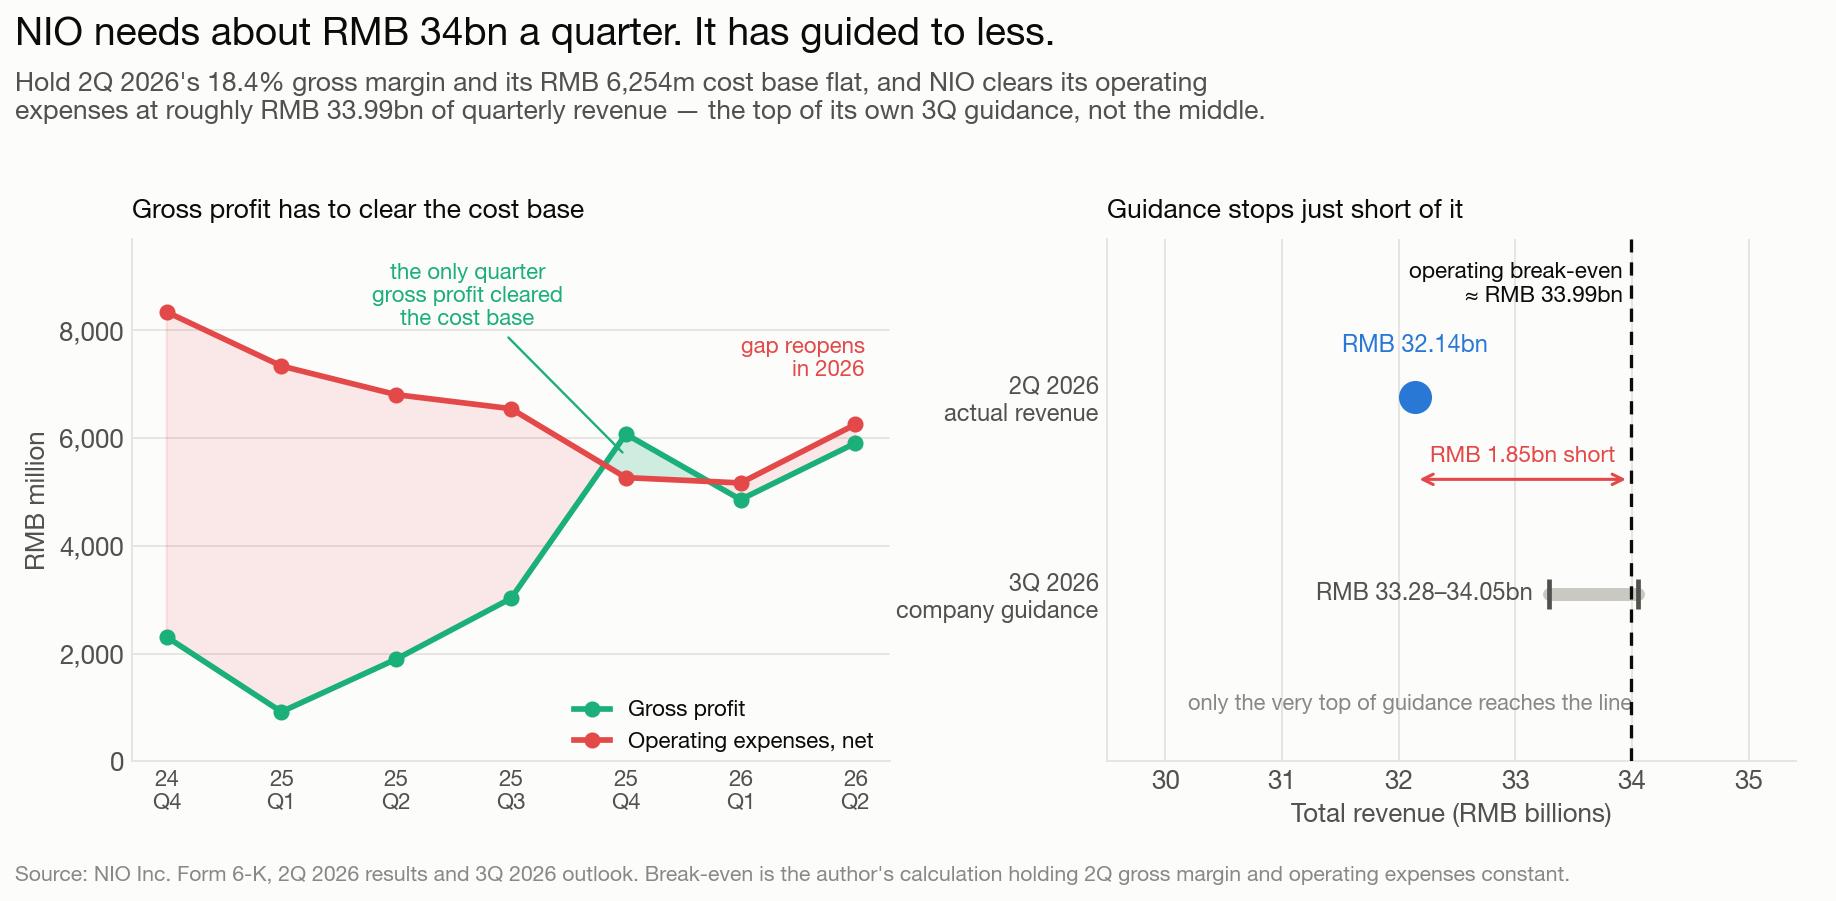
Management has guided the third quarter to 108,000–111,000 vehicles and RMB33,285–34,051 million of revenue. Only the very top of that range clears the line. On the midpoint, NIO's own guidance implies another operating loss — unless the cost base stops growing or the margin improves.
That is the single most useful thing to check when the third-quarter numbers land. Not the delivery figure, not the revenue figure, but whether operating expenses grew more slowly than gross profit for the first time since the fourth quarter of 2025.
NIO Earnings 2026: Bull, Base and Bear Scenarios
| Scenario | Key assumptions | Possible outcome |
|---|---|---|
| Bull case | Deliveries exceed 400,000 vehicles, margins improve, ONVO and FIREFLY scale efficiently, and operating expenses remain controlled | NIO reaches sustained quarterly GAAP profitability and generates positive free cash flow |
| Base case | Deliveries grow strongly but price competition limits margin expansion; adjusted profits remain modest | NIO approaches break-even, but GAAP earnings remain volatile |
| Bear case | EV price cuts intensify, new models underperform, and infrastructure spending remains high | NIO returns to significant losses and requires additional financing |
Bull case
The bull case requires more than the third quarter’s guided 24–27% delivery growth. NIO needs rising gross profit per vehicle, lower selling expense per unit and better utilization of its production and energy networks.
If the company reaches a large enough scale, the operating leverage could be substantial. Even a few percentage points of margin improvement on hundreds of thousands of vehicles would materially change earnings.
Base case
The most realistic base case may involve continued revenue growth and occasional adjusted profits, but not yet stable GAAP earnings. NIO could report positive quarters during strong delivery periods and losses during launches, seasonal slowdowns or heavy investment phases.
Bear case
The bear case becomes more likely if NIO uses discounts to defend volume, while ONVO and FIREFLY fail to generate sufficient scale. A renewed cash burn would raise dilution and financing concerns.
How to Analyze Upcoming NIO Earnings
Investors reviewing NIO earnings should follow a consistent checklist:
- Compare deliveries with revenue growth.
- Examine vehicle margin and total gross margin.
- Check whether operating expenses are growing slower than revenue.
- Review operating cash flow and capital expenditure.
- Analyze the contribution of NIO, ONVO and FIREFLY.
- Assess management’s delivery and revenue guidance.
- Watch inventory and accounts payable trends.
- Evaluate battery-swapping utilization and service revenue.
- Review international sales progress.
- Recalculate the path to GAAP profitability.
A revenue beat is less meaningful if gross margin declines. A delivery miss may be acceptable if NIO protects pricing and profitability. Investors should always analyze volume, price, margin and cash flow together.
SimianX AI can support this process by bringing together real-time market data, company filings, technical indicators and news sentiment. Its multi-agent approach is useful for comparing different perspectives, although investors should verify the underlying data and remember that the platform is not a registered investment adviser. Learn more about SimianX AI
Is NIO Stock a Buy After 71% Delivery Growth?
NIO stock may appeal to investors who believe the company can convert scale into profitability and who are comfortable with high volatility.
The potential rewards include:
- Strong delivery growth.
- Improving gross margins.
- New-model momentum.
- Greater factory utilization.
- Battery-swapping network optionality.
- Expansion through ONVO and FIREFLY.
- Possible operating leverage.
The risks include:
- Continued losses.
- Chinese EV price wars.
- Dilution from future capital raises.
- Weak demand for premium EVs.
- New-model execution risk.
- High infrastructure spending.
- Geopolitical and regulatory uncertainty.
- Competition from larger manufacturers.
A prudent strategy is to treat NIO as a turnaround and execution investment, not as a low-risk mature automaker. Investors may want to use staged purchases, position limits and predefined conditions for reassessing the thesis.
For example, a stronger thesis would require:
- Positive GAAP operating profit for several consecutive quarters.
- Vehicle gross margin remaining stable or rising.
- Positive free cash flow.
- Delivery growth broadening across all three brands.
- Lower cash burn per vehicle.
- Evidence that battery swapping improves customer retention and economics.
FAQ About NIO Earnings 2026
Can NIO become profitable in 2026?
NIO has already achieved quarterly non-GAAP operating profitability and significantly narrowed its GAAP losses. However, full-year profitability depends on vehicle margins, price competition, new-model costs and infrastructure spending. Sustained GAAP net profit remains possible but is not guaranteed.
What does NIO’s 71% delivery growth mean for investors?
The growth demonstrates strong demand and improved product momentum, but it does not automatically prove that NIO is profitable. Investors must determine whether each additional vehicle generates positive contribution after discounts, manufacturing, warranty and selling costs.
Why are NIO’s ONVO and FIREFLY brands important?
ONVO and FIREFLY expand NIO beyond the premium segment and could increase factory utilization. They also introduce execution and margin risks because lower-priced vehicles are usually more sensitive to discounts and competition.
Is NIO battery swapping a competitive advantage?
Battery swapping can provide faster refueling, subscription revenue and customer loyalty. Its value depends on station utilization, network density and whether the economics generate returns above the cost of construction and maintenance.
What should investors watch in the next NIO earnings report?
Focus on vehicle margin, total gross margin, operating cash flow, capital expenditure, delivery guidance, brand-level mix and cash balances. Management commentary about pricing, new models and battery-swapping utilization may be as important as the headline earnings number.
Conclusion
NIO’s 71% delivery growth is an important operational achievement, but it is only the first step in the turnaround. The company now needs to demonstrate that higher volume produces higher gross profit, lower costs per vehicle and positive free cash flow.
The bull case is supported by strong first-half deliveries, new products, improving margins, a growing multi-brand portfolio and a distinctive battery-swapping ecosystem. The bear case is driven by China’s EV price war, high infrastructure costs, uncertain premium demand and the possibility that growth remains dependent on discounts.
The most important NIO earnings 2026 indicators will be:
- Vehicle gross margin.
- GAAP versus non-GAAP profitability.
- Operating cash flow.
- Capital expenditures.
- ONVO and FIREFLY contribution.
- Pricing discipline.
- Battery-swapping utilization.
- Cash consumption.
NIO does not need to become one of China’s largest automakers to create shareholder value. It does, however, need to prove that its ecosystem can earn attractive returns at scale. SimianX AI can help investors continuously monitor NIO’s filings, earnings revisions, technical trends and market sentiment. Visit SimianX AI to support your research, and consult a qualified financial adviser before making investment decisions.
Related Reading
- Tesla Q2 Earnings 2026: Can Robotaxi Offset EV Margin Risk?
- PDD Stock 2026: Temu Slows, Revenue Up, Profit Down 15%
- PayPal Stock Crashes 13%: TPV +10%, Margin Just +1.5%
- When Did Tesla IPO? The Date, Price, and 290x Return
- TSMC Stock 2026: Why Nvidia Still Can’t Replace Its Fab
- NVDA After Earnings: Every Reaction Since 2016 in One Table
- ON Semiconductor Stock 2026: $7B Synaptics Physical AI Bet
References
- SEC EDGAR — NIO unaudited second-quarter 2026 results (Form 6-K)
- SEC EDGAR — NIO fourth-quarter and full-year 2025 results (Form 6-K)
- SEC EDGAR — NIO unaudited first-quarter 2026 results (Form 6-K)
- SEC EDGAR — NIO annual report for 2025 (Form 20-F)
- SEC EDGAR — NIO August 2026 delivery update
- SEC EDGAR — NIO July 2026 delivery update
- SEC EDGAR — NIO June and second-quarter 2026 delivery update
- SEC EDGAR — NIO Inc. filing index
- NIO — newsroom and press releases
- NIO — official site
- ONVO — NIO's family brand
- FIREFLY — NIO's compact brand
- Tesla — investor relations
- BYD — global corporate site
- Li Auto — investor relations
- XPeng — investor relations
- Xiaomi — Xiaomi's electric-vehicle arm
- Zeekr — Zeekr, Geely's premium EV brand
- CPCA — China Passenger Car Association
- NYSE — listing for NIO
- HKEX — listing for NIO (9866)
- SEC — guidance on non-GAAP financial measures
- Investopedia — operating leverage
- Investopedia — gross margin
- SimianX — AI Live Command Room