
返回排行榜
Chainlink
AI 加密資產分析

Chainlink

LINK

Chainlink 是業界標準的去中心化預言機網絡,通過將智能合約與現實世界數據連接來解決「預言機問題」。區塊鏈無法自行訪問外部信息,因此 Chainlink 作為安全的橋樑,使智能合約能夠使用經過驗證的、防篡改的數據對現實事件做出反應。它被廣泛認為是第一批去中心化預言機網絡之一,也是將鏈外數據引入鏈上的市場領導者。

市值排名 #20資產分類 其他

快速開始

選擇具體交易所與交易對後,直接進入 Live 頁並自動啟動分析。

OKX
永續合約USDT

LINK/USDT

OKX

平均勝率

40.0%

最佳周期

1m

LINK/USDT 分析

這裡展示所選交易對最近一次基本面分析與新聞分析,並標註分析時間。

基本面分析

上次分析

這份分析已超過 14 天,其中的價位和消息可能已不再適用;如需最新判斷,請啟動即時分析。

暫無該語言的分析,以下顯示最新一份(英文)。

The overall trend is bearish, but oversold conditions suggest a potential short-term bounce. The analysis has moderate confidence.

LINK/USDT Comprehensive Technical Analysis

1. TREND ANALYSIS

Current Market Structure

Overall Trend: BEARISH with consolidation signals

  • Daily Timeframe: Strong downtrend established. Price has declined from $14.399 (high on Jan 23) to $11.95 (current), representing a 17.1% drop over 3 days.
  • 4H Timeframe: Continuation of downtrend with recent stabilization attempt around $11.94-$11.95 support level.
  • 1H Timeframe: Neutral to slightly bullish with price attempting to hold support; RSI at 51.15 indicates equilibrium.
  • 5m/15m Timeframes: Weak consolidation pattern; price oscillating in tight range ($11.94-$11.98) with downward pressure.

Key Trend Observations:

  • Price broke below the SMA 200 ($11.99 on 1H, $12.27 on 4H), confirming bearish bias
  • EMA 12 below EMA 26 across all timeframes except 1H (early bullish cross signal)
  • Volume declining as price stabilizes, suggesting consolidation rather than capitulation

2. KEY SUPPORT AND RESISTANCE LEVELS

Critical Price Levels:

LevelTypeStrengthNotes
$11.46Major SupportSTRONGDaily BB lower band; psychological level
$11.80-$11.85SupportMODERATE4H support zone; recent bounce point
$11.94-$11.95Current SupportSTRONGCurrent price; tight consolidation range
$11.99-$12.04ResistanceMODERATEDaily BB upper band; 5m/15m resistance
$12.05-$12.10ResistanceMODERATE1H upper BB; psychological level
$12.27ResistanceSTRONG4H SMA 200; major overhead resistance
$12.94Major ResistanceVERY STRONGDaily SMA 50; significant barrier
$13.16Major ResistanceVERY STRONGDaily EMA 50; long-term resistance

Support Quality Assessment:

  • $11.94-$11.95: Currently holding but fragile; multiple touches without break suggest testing phase
  • $11.46: Stronger support; would indicate 3.8% further downside if broken

3. MARKET STRUCTURE AND SENTIMENT

Technical Indicators Analysis:

Momentum Indicators:

  • RSI (14-day): 28.98 - OVERSOLD territory (below 30), indicating potential bounce
  • RSI (1H): 51.15 - Neutral, no directional bias
  • RSI (5m/15m): 13.51-35.43 - EXTREMELY OVERSOLD on micro timeframes

Trend Confirmation:

  • MACD (Daily): -0.323 (histogram: -0.1609) - Bearish with weakening momentum
  • MACD (4H): -0.1242 (histogram: +0.039) - Histogram turning positive = early bullish divergence
  • MACD (1H): +0.0352 - Bullish crossover with positive histogram

Volatility & Bands:

  • Bollinger Bands (Daily): Price near lower band ($11.46-$11.95 range); contraction phase
  • ATR (Daily): 0.5948 - High volatility; expect 4-5% daily moves
  • ATR (4H): 0.2109 - Moderate volatility on 4H timeframe

Volume Analysis:

  • Current Volume (1D): 2.19M (below 20-period average of 4.34M) - Declining volume confirms consolidation
  • Volume Trend: Decreasing volume during downtrend suggests potential reversal setup
  • 5m Volume: Extremely low (4.0 LINK) = illiquidity at current price level

Market Sentiment Indicators:

  • Oversold RSI (28.98): Suggests exhaustion of sellers; mean reversion potential
  • Price vs Moving Averages: Trading below all major averages (SMA 50, EMA 50, SMA 200)
  • Bollinger Band Position: Price compressed near lower band = high probability of bounce

4. OVERALL DIRECTIONAL BIAS

Primary Scenario: BEARISH SHORT-TERM, NEUTRAL MEDIUM-TERM

Bearish Factors:

  1. ✗ Price below SMA 200 on all timeframes
  2. ✗ Daily downtrend intact (17% decline in 3 days)
  3. ✗ EMA 12 < EMA 26 on daily and 4H
  4. ✗ MACD negative on daily timeframe
  5. ✗ Price structure: lower highs and lower lows

Bullish Factors (Reversal Signals):

  1. ✓ RSI (28.98) deeply oversold = mean reversion setup
  2. ✓ MACD histogram turning positive on 4H (early bullish divergence)
  3. ✓ MACD bullish crossover on 1H
  4. ✓ Volume declining during downtrend (capitulation weakness)
  5. ✓ Price holding support at $11.94-$11.95 (3 consecutive touches without break)
  6. ✓ EMA 12 approaching EMA 26 on daily (potential bullish cross)

Probability Assessment:

Bounce to $12.05-$12.27: 65% probability (short-term relief rally) Breakdown below $11.46: 35% probability (continuation of bearish trend) Sustained recovery to $13.16+: 25% probability (requires macro catalyst)


TRADING OUTLOOK

Short-Term (Next 24-48 hours):

  • Expected Action: Bounce/consolidation at current support ($11.94-$11.95)
  • Target 1: $12.04-$12.10 (immediate resistance)
  • Target 2: $12.27 (4H SMA 200)
  • Stop Loss: Below $11.46 (major support break)

Medium-Term (3-7 days):

  • Scenario A (Bullish): Recovery to $12.94 if breaks above $12.27 with volume confirmation
  • Scenario B (Bearish): Continuation to $11.46-$11.35 if support breaks

Risk/Reward Assessment:

  • Current Risk: Moderate (tight consolidation, but near support)
  • Reward Potential: Moderate (bounce potential limited by overhead resistance)
  • Risk/Reward Ratio: 1:1.5 (from $11.95 support to $12.27 resistance)

CONFIDENCE SCORE

62/100 - MODERATE CONFIDENCE

Reasoning:

  • ✓ Clear oversold conditions (RSI 28.98) = reliable reversal signal (+15 points)
  • ✓ Multiple technical divergences forming (MACD bullish cross) (+10 points)
  • ✓ Strong support holding at $11.94-$11.95 (+12 points)
  • ✗ Declining volume reduces conviction (-8 points)
  • ✗ Major resistance overhead limits upside potential (-10 points)
  • ✗ Macro bearish trend still intact (-7 points)
  • ✓ Clear entry/exit levels defined (+10 points)

Confidence Breakdown:

  • Bounce Probability: 70% (high confidence)
  • Magnitude of Bounce: 2-3% to $12.04-$12.10 (moderate confidence)
  • Sustained Recovery: 40% (low confidence without macro catalyst)

RECOMMENDATION SUMMARY

AspectRatingDetails
Entry Signal✓ BUYAt support $11.94-$11.95 with stop at $11.46
Position TypeSWING2-3 day trade, not long-term hold
Target Levels$12.04 → $12.27Resistance-based exits
Risk LevelMODERATETight stops possible, defined risk
Timeframe4H/DailyAvoid 1m/5m due to low volume
ConvictionMODERATEWait for confirmation candle above $11.98

⚠️ Caution: The extreme oversold RSI suggests a bounce is probable, but the broader downtrend remains intact. This is a tactical bounce trade, not a reversal signal. Only risk capital you can afford to lose, and respect the $11.46 support level strictly.

新聞分析

上次分析

這份分析已超過 14 天,其中的價位和消息可能已不再適用;如需最新判斷,請啟動即時分析。

暫無該語言的分析,以下顯示最新一份(英文)。

The analysis indicates a bearish outlook for Chainlink (LINK) due to the risk of a U.S. government shutdown and LINK's struggle below key moving averages, potentially leading to further price declines.

1. News Impact Analysis

Chainlink price struggles below key moving averages

  • What happened? Chainlink is trading at $11.81, down 2.2% from the previous day, and is struggling below key moving averages, indicating a lack of momentum.
  • Why does it matter for LINK? This suggests that LINK may face continued selling pressure, as failing to break above key moving averages often leads to bearish sentiment among traders.
  • Expected price impact: 可能会导致更多的卖出压力,价格可能进一步下跌,目标价位可能在$11.50附近。
  • Timeframe: 未来24-72小时内。

US Shutdown Risk Threatens Crypto Liquidity

  • What happened? The risk of a U.S. government shutdown has surged to 80%, raising concerns about liquidity in the crypto market.
  • Why does it matter for LINK? A liquidity drain could trigger selloffs across crypto assets, including LINK, as investors may seek to reduce exposure during uncertain times.
  • Expected price impact: 这将增加市场的不确定性,导致LINK价格可能进一步向下波动,目标价位可能在$11.50或更低。
  • Timeframe: 影响将在未来48小时内显现。

Japan Targets 2028 Crypto ETF Launch as Regulatory Shift Accelerates

  • What happened? Japan is aiming for a 2028 approval for spot crypto ETFs, signaling potential growth in the regulated crypto market.
  • Why does it matter for LINK? Although this is a positive development for the broader crypto market, it is a long-term catalyst and may not have an immediate effect on LINK price.
  • Expected price impact: 短期内影响有限,可能不会产生明显的买入或卖出压力。
  • Timeframe: 中长期影响。

Biggest Threat to Crypto Is Back: Shutdown Risk Signals a Liquidity Collapse

  • What happened? Similar to the previous news item, this article emphasizes that the shutdown risk could lead to a liquidity collapse.
  • Why does it matter for LINK? Reinforces the bearish sentiment by indicating that a lack of liquidity may exacerbate selling pressure.
  • Expected price impact: 进一步的卖出压力,LINK可能会测试$11.50的支撑位。
  • Timeframe: 未来24-72小时内。

Can Traditional Forex Expertise Translate to Crypto Markets?

  • What happened? Discussion on whether expertise from traditional finance can be applied to crypto markets.
  • Why does it matter for LINK? This is a neutral topic and does not have a direct impact on LINK price at this time.
  • Expected price impact: 对价格没有直接影响。
  • Timeframe: 不适用。

2. Market Sentiment (from Polymarket)

  • 目前没有预测市场数据可用,但整体新闻情绪显示出明显的看跌信号。这意味着市场参与者可能对LINK的短期前景持悲观态度,可能会加大卖出压力。

3. Synthesize Actionable Insights

  • Overall Direction: Bearish bias
  • Key Catalysts:
    • U.S. government shutdown risk
    • LINK's inability to break key moving averages
  • Risk Factors:
    • 如果出现意外的积极消息(如重大合作或市场回暖),可能会抵消当前的看跌情绪。
  • Trading Recommendation:
    • 操作建议: 考虑在$11.50附近寻找做空机会,如果价格进一步下跌,目标价位设定在$11.00。保持警惕,观察政府 shutdown 的进展和市场情绪变化。

相關新聞

Bitcoinistneutral
Archax Turns To Chainlink Data Streams For Tokenised Treasury Collateral

Archax Turns To Chainlink Data Streams For Tokenised Treasury Collateral

TL;DR: Archax has adopted Chainlink Data Streams to supply pricing information for GOVY, its tokenised US Treasury product, as it develops collateral use cases. Putting Treasury bills on a blockchain is only the beginning. If an institution wants to borrow against them or use them as margin in an automated market, the software also needs reliable, timely information about their value. That is the gap Archax is addressing with Chainlink. The regulated digital asset platform...

查看原文
Blockonomineutral
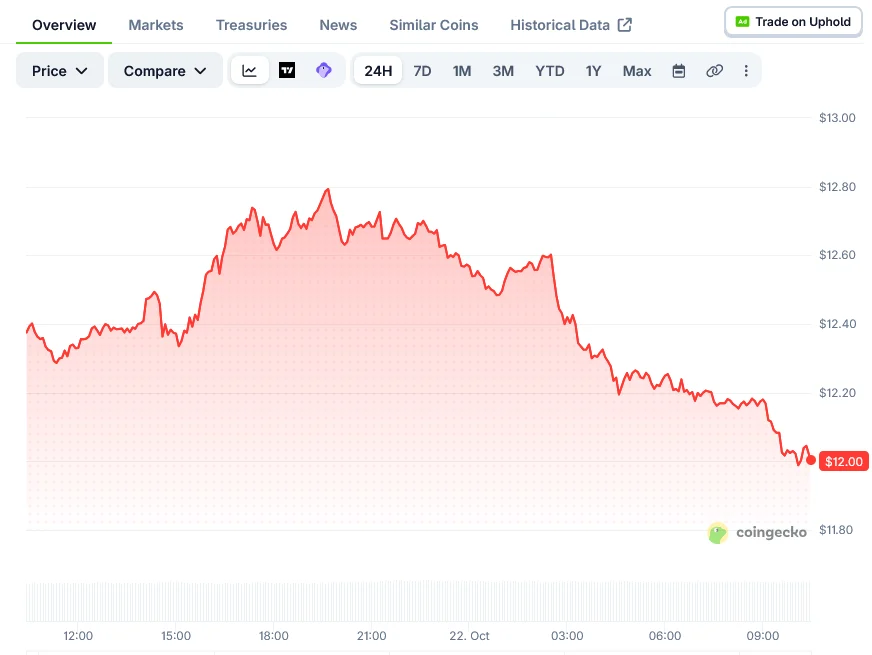
Chainlink (LINK) Price: Reserve Adds 1.5M LINK in Q3 as Price Nears $12

Chainlink (LINK) Price: Reserve Adds 1.5M LINK in Q3 as Price Nears $12

TLDR Chainlink reported more than $15 billion in token migrations to its CCIP protocol during 2026. CCIP 2.0 went live in Q3 with new security, compliance and settlement controls. Chainlink expanded work with Swift, DTCC, Wyoming and Hong Kong&#8217;s Tokenized Securities Framework. LINK traded near $12.24 on October 22, down from its October high of around $15.70. RSI sits at 44.11 and the MACD remains bearish, with support at $12 and resistance at $13. Chainlink (LINK...

查看原文
Blockchain.Newsbearish
LINK Price Prediction: Below Every Short-Term Average, But the $11.86 Floor Is the Real Line in the Sand

LINK Price Prediction: Below Every Short-Term Average, But the $11.86 Floor Is the Real Line in the Sand

查看原文
CoinCentralbullish

Grayscale Now Lets You Swap Bitcoin, Solana and XRP Directly for ETF Shares

TLDR Grayscale now lets eligible investors swap tokens directly for shares in 10 crypto products. Minimum investments range from about $80,300 to $364,800. Products cover Bitcoin, Ethereum, Solana, XRP, Dogecoin, Avalanche, Chainlink, Hyperliquid, Sui and Zcash. The SEC approved in-kind creations and redemptions for crypto ETPs in July 2025. Grayscale says fees, taxes and price changes still apply. Grayscale has expanded in-kind subscriptions to 10 of its crypto investm...

查看原文

可交易市場

按交易所與現貨 / 永續查看可立即啟動的分析入口。

周期
時間周期
方向

LINK 模型排名

按當前篩選查看 LINK 在不同模型下的表現。

領先模型

當前過濾條件下,最強的三組模型表現。

為什麼用這個 Chainlink 頁面

這裡會把 Chainlink 的模型表現、可交易市場和最新分析放在一起,方便你直接比較不同交易所和交易對。

如果你準備開始分析,這個頁面可以直接帶你進入具體市場。

相關資產

繼續瀏覽其他高關注度的資產頁面。

相關研究

更多加密週期資料

常見問題

LINK 頁面裡顯示的配對來自哪裡?

這裡展示的是當前支持直接分析的 LINK 市場,覆蓋不同交易所,以及現貨和永續兩種類型。你可以先比較,再直接打開自己真正想看的那個市場。

點開始分析後會發生什麼?

點擊後會直接進入所選市場的 Live 分析頁,並自動開始分析。這樣你不用再手動搜索交易對,可以從當前頁面直接進入具體市場。

LINK 的最佳模型一定就是最佳交易對嗎?

不一定。某個模型在 LINK 上整體表現好,並不代表所有交易所、所有合約類型都一樣適合。這個頁面會同時給你看整體模型表現和具體可交易市場,方便你自己判斷。