
 By Marcus Reeve
Energy, Policy and the 2026 Ballot: What the Last Five Elections Actually Paid
Every two years the same trade gets pitched. A pro-fossil party wins, so you buy oil. A pro-climate party wins, so you buy solar. It is intuitive, it is easy to explain on television, and over the last decade it has been wrong in the most expensive way possible: not slightly wrong, but inverted.
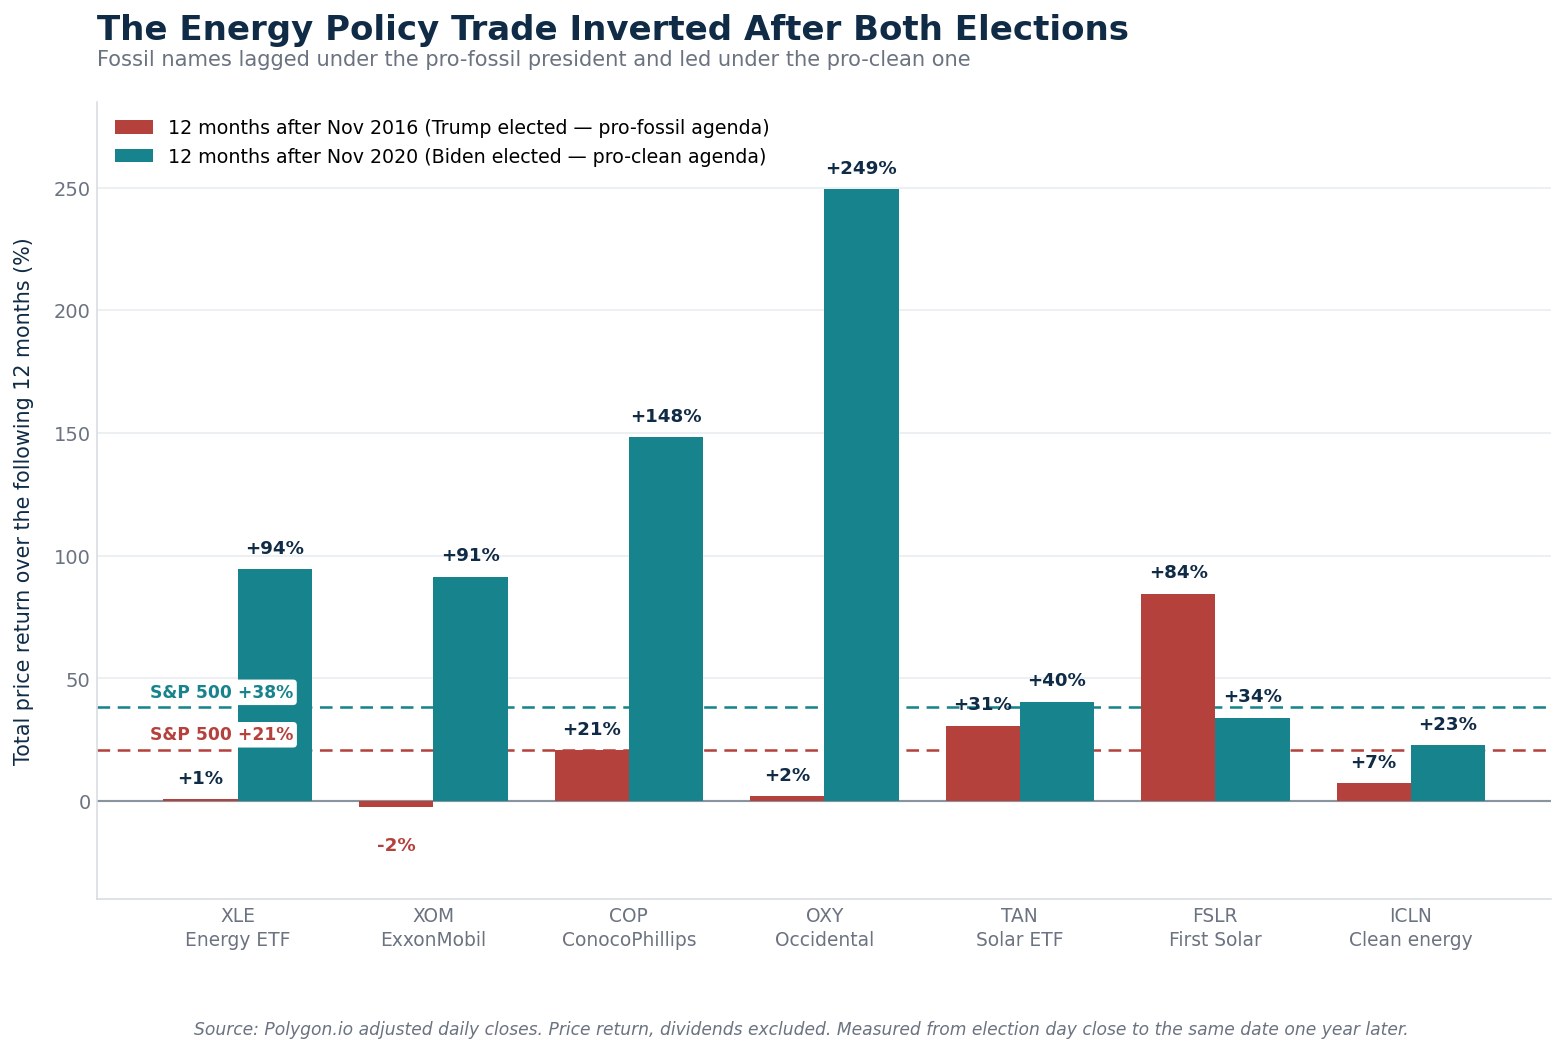
In the twelve months after the November 2016 election — the most explicitly pro-drilling result in modern American politics — the S&P 500 energy sector returned +0.7%. The S&P 500 itself returned +21.0%. First Solar, a company whose entire business model depended on the policies that election was supposed to destroy, returned +84.5%.
Four years later the mirror image. After November 2020, with an incoming administration that had campaigned on the most aggressive climate agenda in US history, the energy sector returned +94.5% over twelve months. Occidental returned +249.3%. ConocoPhillips returned +148.2%. The solar ETF that was supposed to be the obvious winner returned +40.5% — real money, but less than half of what the "losers" delivered.
This article is about why that keeps happening, what the 2026 midterms can and cannot change, and how to position around an energy vote without making the mistake that has cost investors money in each of the last three cycles. Every figure below was computed from adjusted daily closing prices; the methodology is disclosed in full so you can reproduce it.
Core conclusion: Congress sets energy subsidies and permitting law, and that matters at the margin. But oil prices, interest rates and corporate capital discipline have historically overwhelmed the policy signal. The election is a catalyst inside an earnings framework, not a substitute for one.
Research date: August 14, 2026. This article is informational and does not constitute personalized investment advice.
How These Numbers Were Calculated
Before any interpretation, the method, because a reference table is only worth citing if you can rebuild it.
- Data source. Adjusted daily closing prices from Polygon.io, which reflect splits and dividend adjustments at the vendor level. The usable history in this dataset begins September 10, 2003, which is why the study window starts with the 2006 midterm.
- Return definition. Price return measured from the closing price on election day (or the last trading day before it, when the election fell on a market holiday) to the closing price on the same calendar date one, three or twelve months later. Where that anniversary was not a trading day, the last close on or before it is used.
- Dividends. Excluded. This matters enormously for the fossil complex, which has carried a meaningfully higher dividend yield than the clean-energy names for the entire period. Total returns for
XOMandCVXwould be several percentage points per year higher than the price returns shown here. Every comparison in this article is like-for-like — price return versus price return — but you should mentally add yield when comparing an oil major to a growth-stage solar company. - Instruments. Sector and thematic ETFs are used where a single stock would be unrepresentative:
XLEfor the energy sector,XLUfor utilities,TANfor solar,ICLNfor broad clean energy. ETF inception dates truncate some rows —TANlaunched in April 2008,ICLNin June 2008,ENPHlisted in 2012 — and those cells are marked as unavailable rather than back-filled with a proxy. - Sample size. Five midterms and five presidential elections. That is a small sample, and this article does not pretend otherwise. The value is not in a statistically bulletproof average; it is in the fact that the direction of the surprise has been consistent, and in understanding the mechanism that produced it.
If you want the index-level version of this question across a much longer history, Midterm Election Years and the Stock Market: 1950–2026 covers the full S&P 500 record back to 1950, and S&P 500 in Presidential Election Years does the same for presidential years back to 1928.
What Congress Actually Controls, and What It Does Not
Most election-and-energy commentary fails at this first step. It treats "the government" as a single lever. It is not. The powers that move energy earnings are split across three places, and a midterm election only touches one of them.
Congress controls tax law. This is the big one. Production and investment tax credits, the manufacturing credits that determine whether a solar panel is economically built in Ohio or imported, depreciation schedules, and the royalty rates on federal leases all live in the tax code. Changing them requires legislation, which requires both chambers plus a presidential signature — or a veto-proof supermajority, which effectively never exists.
Congress controls permitting law and appropriations. How long an interstate transmission line takes to approve, what environmental review a pipeline needs, and how much money the relevant agencies have to process applications are statutory and budgetary questions.
The executive branch controls almost everything else, and it is not on the ballot in a midterm. Federal onshore and offshore leasing schedules, Department of Energy approvals for liquefied natural gas export terminals, Environmental Protection Agency rules on emissions and methane, Federal Energy Regulatory Commission proceedings on transmission and interconnection, and the Strategic Petroleum Reserve are all executive functions. A midterm election changes none of them directly.
This distinction is the single most useful thing an investor can internalize before November. A midterm can change the probability that a tax credit survives or dies. It cannot change who runs the EPA. It cannot open or close federal acreage. It cannot approve or block an LNG terminal. Those levers stay where they are until the next presidential election.
The practical consequence: the policy channel that a midterm actually opens is narrow and slow. It runs through tax law, and tax law changes take quarters or years to reach cash flow — by which time the oil price has usually moved far more than the tax code did.
The five channels that actually connect a vote to an energy P&L
- Tax credits. Investment and production credits for wind, solar, storage and domestic manufacturing. The highest-beta channel for clean energy.
- Permitting reform. Faster approvals help pipelines, transmission and large renewables projects simultaneously — one of the few genuinely bipartisan possibilities.
- Appropriations. How aggressively agencies are funded to process leases, approvals and grants.
- Oversight and hearings. Committee control determines who gets subpoenaed. This is headline risk, not earnings risk.
- The regulatory risk premium. The multiple the market is willing to pay for politically exposed cash flows. This channel is real, it is quick, and it is the one that most often reverses.
The Midterm Record: Energy Has Lagged, Whoever Won
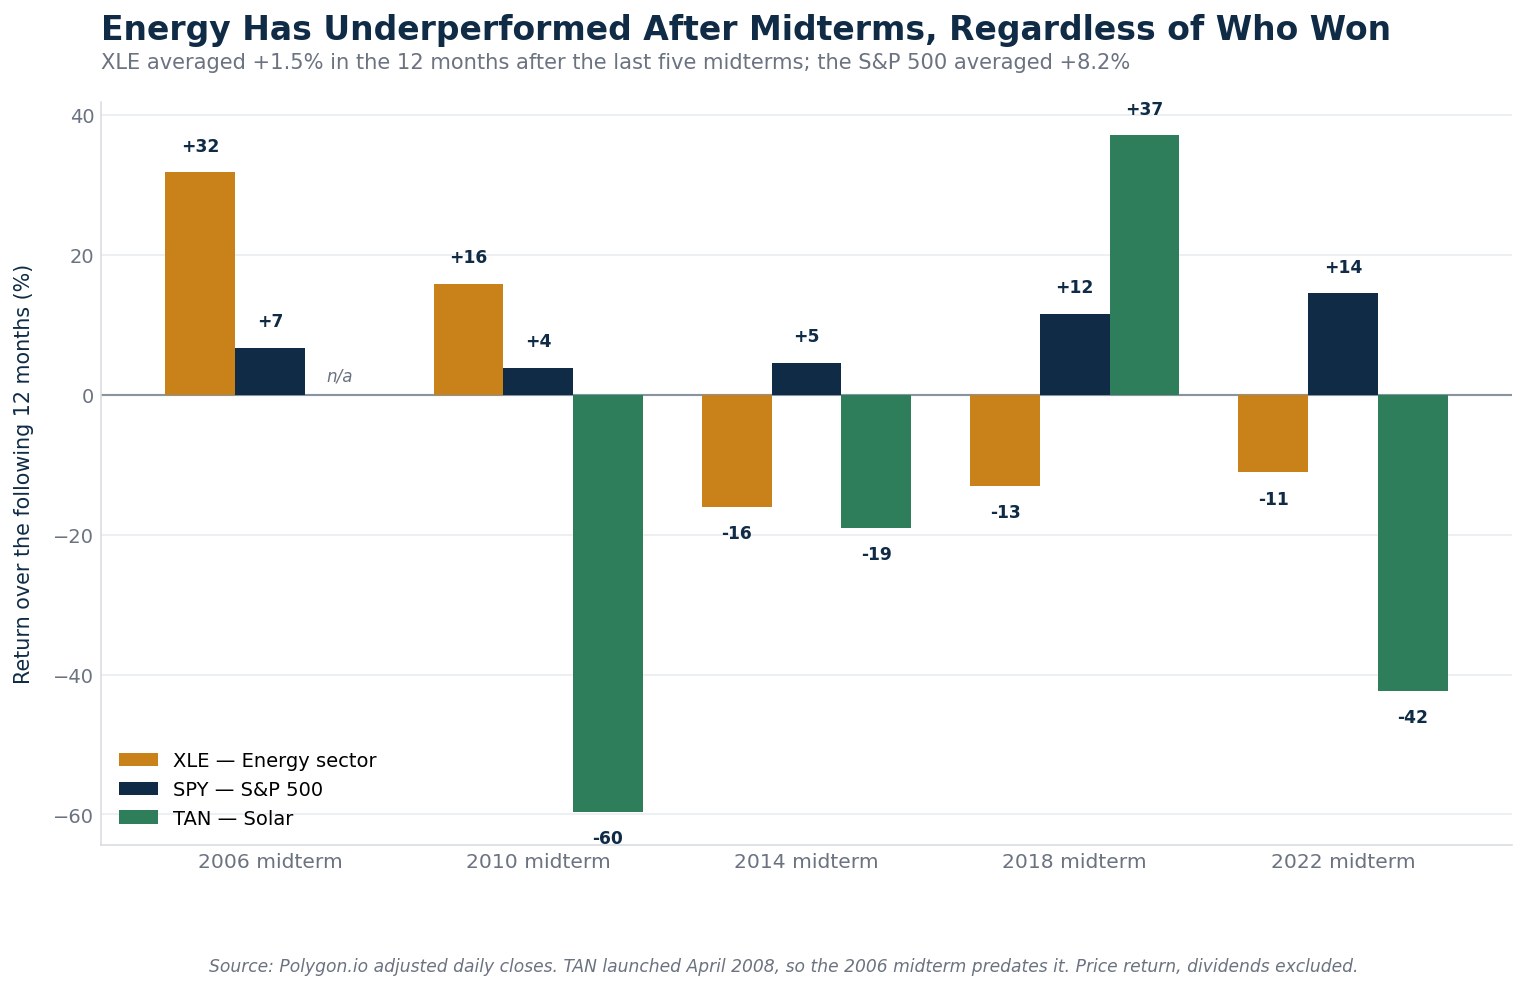
Start with the narrow question. What has the energy sector actually done in the twelve months after a midterm election?
| Midterm | XLE energy | SPY S&P 500 | XLE excess | TAN solar |
|---|---|---|---|---|
| November 2006 | +31.8% | +6.7% | +25.1% | not yet listed |
| November 2010 | +15.9% | +3.8% | +12.1% | −59.6% |
| November 2014 | −16.0% | +4.6% | −20.6% | −19.0% |
| November 2018 | −13.0% | +11.6% | −24.6% | +37.1% |
| November 2022 | −11.1% | +14.5% | −25.6% | −42.4% |
| Average | +1.5% | +8.2% | −6.7% | −21.0% |
Three observations matter here.
First, the energy sector underperformed the index in the twelve months after four of the last five midterms, and the average shortfall was 6.7 percentage points. That is the opposite of what most election-season commentary implies, and it held across both parties' victories.
Second, the two positive years had nothing to do with the election. The +31.8% after November 2006 came during the final leg of a commodity supercycle that took crude from roughly $60 to nearly $100 a barrel. The +15.9% after November 2010 came during the post-crisis recovery and the early shale boom. In both cases the oil price, not the ballot, wrote the return.
Third, the three negative years also had nothing to do with the election. The period after November 2014 contains the OPEC price war that took crude from over $100 to under $30. The period after November 2018 contains a global growth scare and a collapse in oil late in 2018. The period after November 2022 contains the normalization of the post-invasion energy spike.
The pattern is not "midterms are bad for energy." The pattern is that the oil price cycle runs on a clock that is completely indifferent to the electoral calendar, and it is a far bigger number. If you want the long history of that relationship, How the S&P 500 Performs During Oil Shocks traces it back to 1973.
The single-stock version
The sector ETF hides dispersion. Here is the same window for the individual names, ranked by average.
| Ticker | Company | 2006 | 2010 | 2014 | 2018 | 2022 | Average |
|---|---|---|---|---|---|---|---|
| `LNG` | Cheniere Energy | +56.4% | +251.2% | −32.9% | +1.4% | −1.8% | +54.9% |
| `CVX` | Chevron | +27.0% | +27.3% | −16.1% | +0.8% | −23.2% | +3.2% |
| `XOM` | ExxonMobil | +20.2% | +14.0% | −9.0% | −12.8% | −9.7% | +0.5% |
| `COP` | ConocoPhillips | +35.1% | +16.4% | −18.1% | −17.1% | −14.9% | +0.3% |
| `SLB` | SLB | +48.0% | +1.8% | −14.7% | −31.7% | −3.2% | 0.0% |
| `OXY` | Occidental | +48.8% | +14.3% | −11.2% | −46.0% | −18.3% | −2.5% |
Cheniere is the outlier that proves the point. Its +251.2% after the 2010 midterm had nothing to do with the 2010 election result and everything to do with the company pivoting from an LNG import terminal to an export terminal as American shale gas made the original business model obsolete. A structural change in the commodity beat the political cycle by two orders of magnitude.
The Clean-Energy Side of the Ledger
Now the mirror. What happened to the names that a pro-climate result was supposed to help?
| Ticker | Instrument | 2010 | 2014 | 2018 | 2022 | Average |
|---|---|---|---|---|---|---|
TAN | Solar ETF | −59.6% | −19.0% | +37.1% | −42.4% | −21.0% |
ICLN | Clean energy ETF | −44.2% | −3.8% | +23.6% | −32.0% | −14.1% |
FSLR | First Solar | −65.7% | +3.1% | +24.6% | −6.4% | −11.1% |
| `NEE` | NextEra Energy | +3.3% | +2.2% | +32.7% | −26.5% | +2.9% |
XLU | Utilities sector | +9.3% | −3.0% | +15.8% | −8.3% | +6.3% |
Solar's post-midterm record is genuinely poor: an average of −21.0% across four observations. But again, read the mechanism rather than the average. The −59.6% after November 2010 was a global polysilicon glut and the collapse of European feed-in tariffs — a supply and subsidy shock originating in Germany and China, not Washington. The −42.4% after November 2022 was a rate shock, which is the single most important thing to understand about this sector and which the next section covers properly.
Presidential Elections Have Paid Better — For Both Sides
There is a second comparison worth making, because it isolates how much of the "election effect" is really an election effect at all. Here is the same twelve-month window measured from the last five presidential elections rather than midterms.
| Ticker | Instrument | 2008 | 2012 | 2016 | 2020 | 2024 | Average |
|---|---|---|---|---|---|---|---|
XLE | Energy sector | +6.1% | +19.1% | +0.7% | +94.5% | −3.0% | +23.5% |
XOM | ExxonMobil | −8.0% | +1.8% | −2.2% | +91.3% | −4.4% | +15.7% |
COP | ConocoPhillips | −8.1% | +26.9% | +20.7% | +148.2% | −19.7% | +33.6% |
OXY | Occidental | +37.9% | +21.9% | +1.9% | +249.3% | −21.1% | +58.0% |
TAN | Solar ETF | −37.1% | +165.7% | +30.8% | +40.5% | +22.7% | +44.5% |
FSLR | First Solar | −31.5% | +146.7% | +84.5% | +33.9% | +28.5% | +52.4% |
ICLN | Clean energy ETF | −25.6% | +65.6% | +7.3% | +22.7% | +34.1% | +20.8% |
SPY | S&P 500 | +4.5% | +23.9% | +21.0% | +38.3% | +17.5% | +21.0% |
Set the two tables side by side and something jumps out. Energy averaged +1.5% after midterms and +23.5% after presidential elections. Solar averaged −21.0% after midterms and +44.5% after presidential elections. Both sides of the energy complex did dramatically better in presidential years than in midterm years.
The tempting conclusion — that presidential elections "matter more" — is almost certainly the wrong one. A simpler explanation fits better: the twelve months following a presidential election have repeatedly coincided with the recovery leg of a market cycle. November 2008 sat near the bottom of the financial crisis. November 2012 followed the euro crisis trough. November 2020 was three weeks before the first vaccine efficacy announcement. Presidential elections happen every four years, which means they sample the business cycle differently from midterms, which arrive in the middle of a presidential term when policy has already been priced and the cycle is often more mature.
This is the clearest illustration in the whole dataset of why five observations cannot settle a causal question. The averages are real. The causal story they seem to tell is not supported, because the elections are not randomly distributed across the economic cycle — they are perfectly correlated with it by construction.
Note also the 2012 solar figures. TAN returned +165.7% and FSLR +146.7% in the twelve months after November 2012 — but those gains came off a catastrophic base. Solar had collapsed through 2011 and 2012 on the polysilicon glut, and the 2013 rebound was a recovery from distress, not a policy dividend. An average that includes a bounce off a near-death low will always flatter the theme.
Why the Policy Trade Keeps Inverting
Five mechanisms explain almost all of the counterintuitive results above. They are not mysterious, and once you see them, the inversion stops being surprising.
1. The oil price is a bigger number than the tax code
An integrated major's earnings move roughly with the realized price of a barrel. A twenty-dollar move in crude changes cash flow by more than almost any plausible change in federal royalty rates or depreciation schedules. Between November 2014 and November 2015, crude fell by more than half. No election result in that window could have offset it, and none did.
2. Clean energy is a long-duration asset, so it trades on interest rates
This is the most underappreciated point in the entire debate. A solar developer's value is the discounted stream of cash flows from projects that run for twenty-five years. Residential solar in particular is sold to homeowners on financed monthly payments. Both are acutely sensitive to the discount rate.
When the Federal Reserve raised rates aggressively through 2022 and 2023, clean energy was hit twice — once through the discount rate applied to distant cash flows, and again through the financing cost that determines whether a homeowner signs the contract at all. That is why the sector fell hard in a period when it was receiving the largest subsidy in its history. The rate channel overwhelmed the subsidy channel, and it was not close.
3. Capital discipline changed what an oil company is
The single biggest driver of the fossil complex's extraordinary 2021 and 2022 was not policy. It was that the industry stopped growing production and started returning cash. After a decade of destroying capital chasing volume, the majors and large independents pivoted to buybacks, dividends and debt reduction. Investors re-rated them as cash-return vehicles rather than growth stories.
That re-rating happened to begin under the most climate-focused administration in US history. The causation runs from the 2014 to 2020 capital-destruction hangover, not from Washington.
4. The market prices the policy before the policy arrives
By the time a bill is signed, the market has usually spent months discounting it. A subsidy that is fully anticipated is already in the price, so the actual signing can be a sell-the-news event. This is not a market failure; it is the market working.
5. Elections change the risk premium faster than they change cash flow
The immediate move after an election is almost entirely a change in the multiple investors will pay for politically exposed earnings. That is a sentiment adjustment, and sentiment adjustments mean-revert when the underlying cash flow does not follow. The one-month move and the twelve-month move are frequently opposite signs — a point the next section demonstrates with two clean case studies.
Two Case Studies Where the Headline and the Price Went Opposite Ways
Case one: the largest clean-energy subsidy in American history
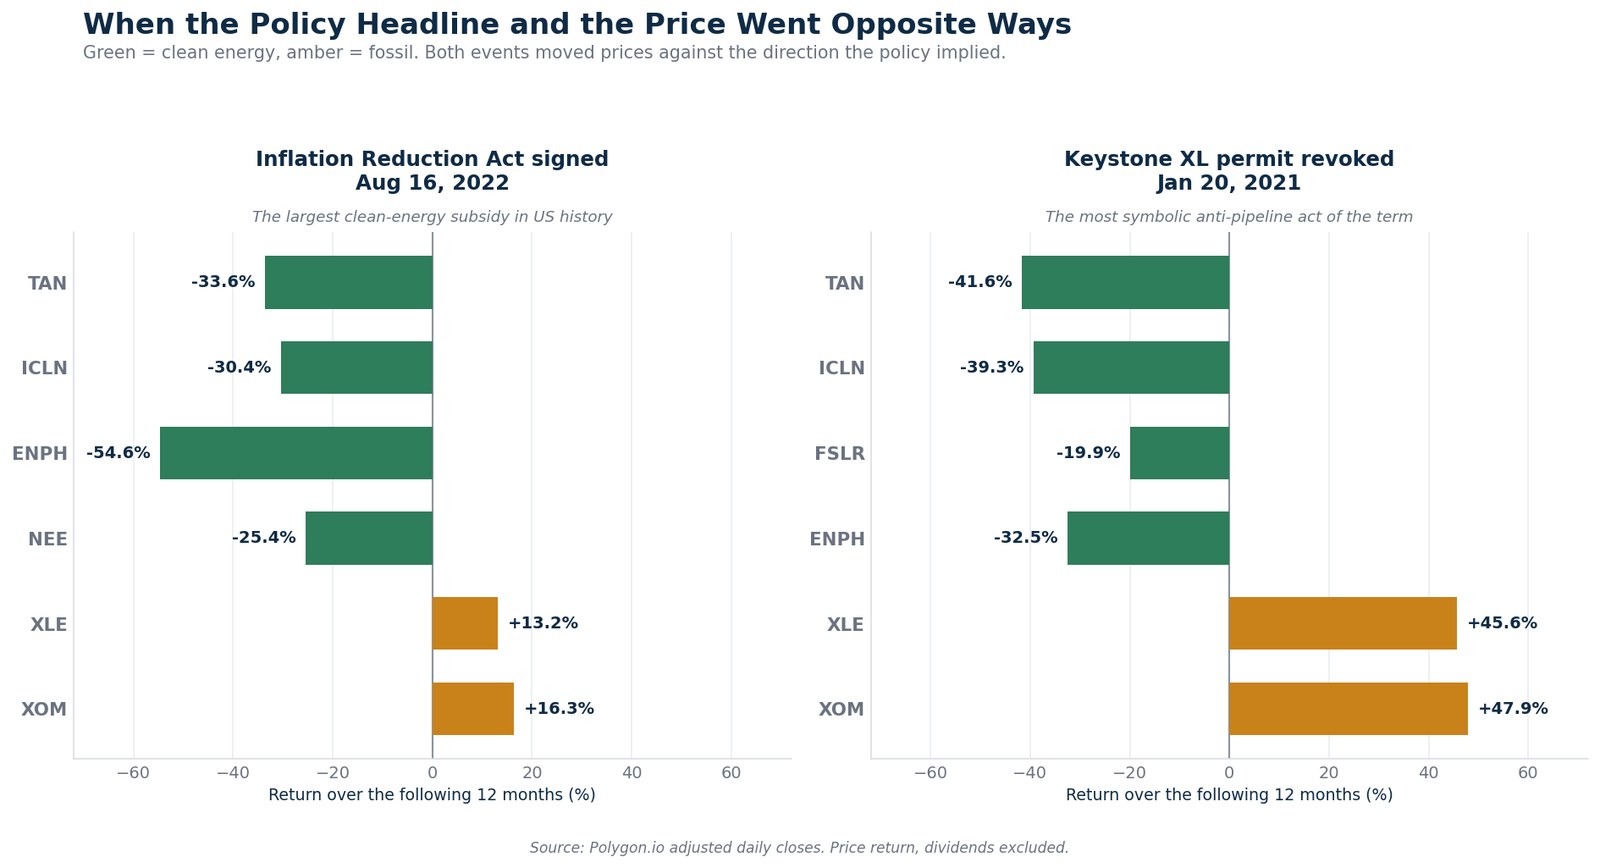
On August 16, 2022, the Inflation Reduction Act was signed into law. It was, by a wide margin, the most significant piece of clean-energy legislation the United States had ever passed — hundreds of billions of dollars in credits for renewable generation, storage, electric vehicles and domestic manufacturing.
Here is what the next twelve months delivered:
| Instrument | 12 months after IRA signing |
|---|---|
TAN solar ETF | −33.6% |
ICLN clean energy ETF | −30.4% |
ENPH Enphase Energy | −54.6% |
NEE NextEra Energy | −25.4% |
XLU utilities sector | −18.4% |
XLE energy sector | +13.2% |
XOM ExxonMobil | +16.3% |
SPY S&P 500 | +2.3% |
The largest clean-energy subsidy in history was followed by a roughly one-third decline in the solar complex and a gain in oil. The reason is the rate channel from the previous section: the Federal Reserve was in the steepest tightening cycle in four decades over exactly that window, and the discount rate did more damage than the subsidy did good.
But notice the exception, because it is the most instructive number in this article. First Solar returned +64.0% over the same twelve months. It was the one clean-energy name that rose, and it rose because the IRA's domestic manufacturing credit was written in a way that specifically advantaged a company that actually manufactures panels in the United States. The subsidy worked exactly as designed — for the one business it was designed for.
That is the difference between a sector bet and a company bet. The policy was real, its effect was real, and it was captured by one balance sheet rather than by the theme.
Case two: the most symbolic anti-pipeline act of the term
On January 20, 2021, the incoming administration revoked the Keystone XL pipeline permit on its first day in office. If any single action should have marked the top for American oil equities, this was it.
Twelve months later, ExxonMobil was up +47.9%, the energy sector was up +45.6%, and ConocoPhillips was up +88.8%. Over the same window solar fell 41.6% and clean energy broadly fell 39.3%.
The pipeline decision was genuinely consequential for the specific project and the specific companies attached to it. It was almost irrelevant to the earnings of a global integrated major whose realized price is set in international markets and whose 2021 was defined by demand recovering from the pandemic.
The First Month Lies
If the twelve-month record is counterintuitive, the shape of the path inside those twelve months is more useful still — and it is where most election-driven positioning actually goes wrong.
| Instrument | Nov 2016: +1 month | +3 months | +12 months |
|---|---|---|---|
XLE energy sector | +10.2% | +3.8% | +0.7% |
COP ConocoPhillips | +12.3% | +11.9% | +20.7% |
TAN solar ETF | −1.9% | −8.0% | +30.8% |
FSLR First Solar | −1.0% | −5.8% | +84.5% |
ICLN clean energy | −6.1% | −3.4% | +7.3% |
SPY S&P 500 | +5.2% | +7.1% | +21.0% |
The immediate reaction to the 2016 result was exactly what the narrative predicted. Energy jumped 10.2% in a month. Solar and clean energy fell. Anyone who traded the headline in the first week was rewarded, and quickly.
Then it unwound. Energy gave the entire move back and finished the year up 0.7%. Solar, down through the first quarter, finished up 30.8%. First Solar, down 5.8% at three months, finished up 84.5%. The sign flipped between month three and month twelve for the two most policy-exposed instruments in the table.
The 2020 election produced a different shape:
| Instrument | Nov 2020: +1 month | +3 months | +12 months |
|---|---|---|---|
XLE energy sector | +30.5% | +41.3% | +94.5% |
OXY Occidental | +69.1% | +127.2% | +249.3% |
TAN solar ETF | +17.1% | +68.5% | +40.5% |
ENPH Enphase | +21.9% | +87.4% | +125.9% |
SPY S&P 500 | +9.1% | +13.6% | +38.3% |
Here the fossil trade kept compounding — because the underlying driver was a global demand recovery, not a policy view. Solar rose too, but peaked at three months and gave back roughly two fifths of the gain by month twelve, as the rate cycle began to bite.
The lesson is the same in both directions. The first-month reaction is a sentiment adjustment; the twelve-month outcome is a cash-flow adjustment. They agree only when the underlying economics happen to point the same way as the politics. Sizing a position as though the first move is the whole move is the single most reliable way to lose money on an election trade.
Natural Gas, Power Demand and the AI Cross-Current
One structural change since the last midterm deserves separate treatment, because it is larger than anything on the ballot and it cuts across the fossil-versus-clean framing entirely.
United States electricity demand was essentially flat for about two decades. Efficiency gains in lighting, appliances and industrial processes offset population and economic growth almost exactly. Utility planning, regulatory rate cases and generation investment all adapted to a world with no load growth.
That era has ended. Data-center construction — driven by artificial-intelligence training and inference workloads — has produced the first sustained increase in American power demand in a generation. The consequences run in several directions at once:
- Natural gas is the swing beneficiary. Dispatchable generation that can run around the clock is the practical answer to a load that does not follow the sun. That supports gas producers, midstream operators and the turbine supply chain, and it is a demand story rather than a policy story.
- Utilities become growth businesses. Load growth means rate-base expansion, which means earnings growth for regulated utilities in a way that did not exist during the flat-demand decades. This is why `NEE` and the broader
XLUcomplex have a materially different outlook than their post-2010 history suggests. - Renewables gain a demand tailwind but hit a queue. More load is unambiguously good for anyone selling electrons. The binding constraint is interconnection — the queue to physically connect a project to the grid — which is a regulatory and infrastructure problem, not a subsidy problem.
- Permitting reform becomes genuinely bipartisan. This is the one area where a divided Congress might actually legislate, because faster approvals help pipelines and transmission lines simultaneously. Transmission is the shared bottleneck.
For an investor, the important implication is that the most powerful energy theme going into 2026 is not on the ballot at all. Load growth from computing infrastructure will do more to reshape American power markets over the next five years than any plausible outcome on November 3. The US Energy Information Administration's electricity data is the authoritative public tracker for that demand picture.
The 2026 Setup: What Is Actually at Stake
With the mechanism understood, the 2026 question becomes tractable. Election day is November 3, 2026. The presidency is not on the ballot; the executive levers described earlier stay where they are through January 2029 regardless of the outcome.
What is on the ballot is the composition of Congress, and therefore the fate of the tax code. The live questions are:
- Whether existing clean-energy credits are further trimmed, left alone, or protected.
- Whether a permitting-reform package — the one genuinely bipartisan possibility in energy policy — can pass.
- Whether appropriations constrain or enable the agencies that process leases, approvals and interconnection queues.
- Which committees hold hearings on which industry, which is headline risk rather than earnings risk.
| Outcome | Policy reading | Oil & gas | Clean energy | Utilities & power |
|---|---|---|---|---|
| Republican sweep | Further credit trimming possible; permitting reform likelier | Mildly positive | Negative headline risk | Mixed |
| Divided Congress (base case) | Gridlock; existing credits largely survive by default | Neutral | Relief — the repeal tail risk fades | Neutral to positive |
| Democratic sweep | Credit repeal stops; presidential veto still blocks reversal | Mildly negative | Most positive | Positive |
| No clear result or delayed counts | Uncertainty persists; fundamentals temporarily secondary | Volatile | Highly volatile | Volatile |
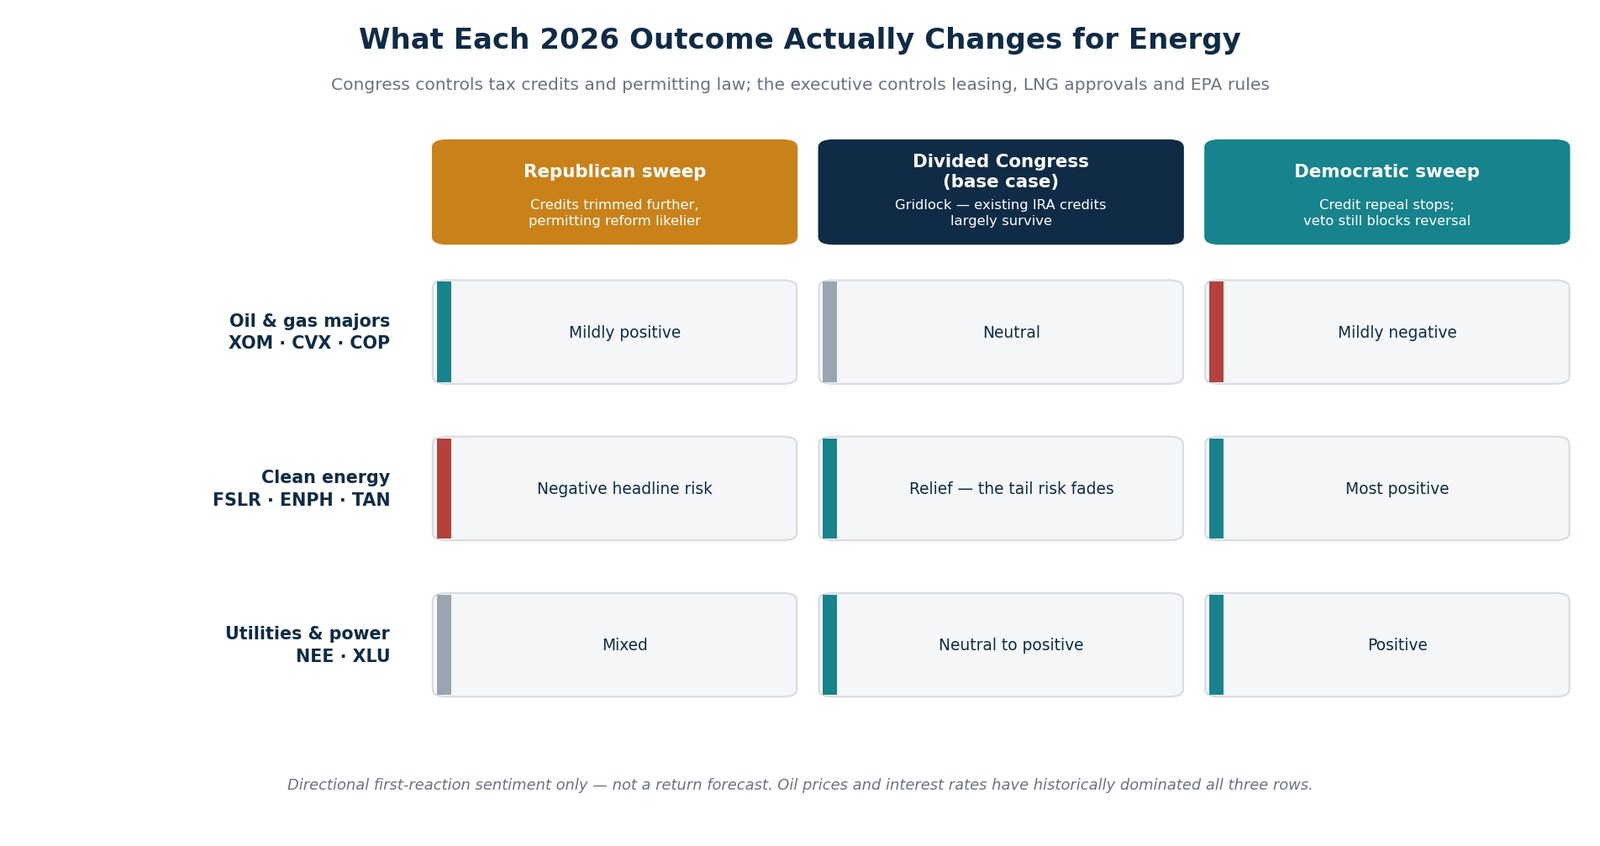
This table describes likely initial sentiment, not a forecast of twelve-month returns — and the entire body of evidence above is a warning about how weakly the two are related.
The one asymmetry genuinely worth noting: gridlock is quietly bullish for clean energy, because the sector's biggest political risk is the removal of credits it already has. A Congress that cannot pass anything cannot repeal anything either. That is a very different statement from "a Democratic sweep is bullish," and it is the kind of second-order reasoning the headline trade misses.
For the equivalent analysis on other sectors in this election, see defense stocks and healthcare stocks, or the broader twelve-ticker map across three congressional scenarios.
Company by Company
ExxonMobil and Chevron: the cash-return majors
`XOM` and `CVX` are the least election-sensitive names in this article, and that is by construction. Both are global businesses. Both realize prices set in international markets. Both have spent the last several years optimizing for free cash flow and shareholder return rather than production growth.
The variables that actually matter for them are the crude and natural gas price decks, refining margins, project execution on major developments, and the sustainability of the buyback. US federal policy affects the domestic portion of an internationally diversified asset base. Their post-midterm averages of +0.5% and +3.2% respectively, against the S&P 500's +8.2%, are consistent with businesses whose fortunes are set elsewhere.
Election read: low direct sensitivity. Watch the price deck, not the ballot.
ConocoPhillips and Occidental: the leveraged domestic plays
`COP` and `OXY` carry more US onshore exposure and, in Occidental's case, more balance-sheet leverage to the commodity. That is why Occidental posted both the best single observation in the presidential table (+249.3% after November 2020) and one of the worst in the midterm table (−46.0% after November 2018).
Higher beta to oil means higher beta to everything oil responds to — which is demand, OPEC policy and inventories, not congressional composition. Federal leasing policy matters more here than for the majors, but leasing is an executive function that a midterm does not touch.
Election read: moderate indirect sensitivity, dominated by the commodity.
SLB and the service complex
`SLB` sells to producers, so its revenue is a derivative of their capital budgets. Those budgets follow the strip price with a lag. Services is the highest-beta way to express a view on drilling activity and the worst way to express a view on an election — its post-midterm average of exactly 0.0% across five observations captures the point neatly.
Election read: low direct sensitivity, high sensitivity to capex cycles.
Cheniere and the LNG story
`LNG` sits at the one genuine intersection of policy and cash flow in this article. Export terminals need federal approval, and approval timing is a real variable. But it is a Department of Energy function — executive, not legislative. A midterm does not change who signs an export authorization.
What a midterm can change is appropriations and the political temperature around approvals. That is a second-order effect on a business whose contracts are long-dated and largely take-or-pay.
Election read: the most policy-exposed of the fossil names, but through an executive channel a midterm does not control.
First Solar: the domestic manufacturing exception
FSLR is the most genuinely policy-sensitive name in this entire study, and the IRA case study above is the proof. When legislation is written to advantage domestic manufacturing, a domestic manufacturer captures it. Its +64.0% in the twelve months after the IRA — against a solar ETF that fell 33.6% — is the cleanest example of policy actually paying that the data contains.
The corollary is that it is also the name with the most to lose if manufacturing credits are unwound. Of every ticker discussed here, this is the one where a congressional outcome maps most directly to a line in the income statement.
Election read: highest genuine legislative sensitivity, in both directions.
Enphase and the rate-sensitive residential complex
ENPH is the purest expression of the duration argument. Residential solar is a financed consumer purchase; when financing costs rise, demand falls, and the stock's history is a brutal illustration. It fell 85.1% in the twelve months after the 2014 midterm, rose 253.4% after 2018, and fell 72.5% after 2022.
Those swings are not political. They track the cost of money and the residential installation cycle. Anyone trading this name on an election result is taking a rates position without knowing it.
Election read: low genuine policy sensitivity, extreme rate sensitivity.
NextEra and the utilities: the AI cross-current
`NEE` and the broader XLU complex deserve their own note, because something has changed since the last midterm that has nothing to do with elections.
Power demand in the United States was essentially flat for roughly two decades. Data-center construction has ended that. Utilities are now growth businesses in a way they have not been in a generation, with load growth, interconnection queues and rate-base expansion driving the story. That structural change is a far larger input to 2026 earnings than any plausible congressional outcome.
Utilities are also bond proxies, which means they carry the same rate sensitivity that hurts clean energy — visible in the −18.4% for XLU in the year after the IRA signing.
Election read: low policy sensitivity, dominated by load growth and rates.
What Would Make This Analysis Wrong
Intellectual honesty requires stating the conditions under which the argument above fails.
- A genuine legislative surprise. If a sweep produced an actual repeal of manufacturing and investment credits — not a proposal, a signed law — the clean-energy names would reprice on cash flow rather than sentiment, and the historical pattern of inversion would not protect them.
- A rate regime change. The strongest claim in this article is that rates have dominated clean energy. If the rate cycle turns decisively, that same mechanism works in reverse and the sector's sensitivity to a friendly Congress rises.
- An oil supply shock. A geopolitical disruption would swamp every domestic policy consideration in both directions, exactly as it did in 1973, 1990 and 2022.
- Sample size. Five midterms is five observations. The mechanisms described here are more reliable than the averages, and this article has tried to lead with mechanisms for that reason.
- Survivorship in the thematic ETFs.
TANandICLNhave both changed their index methodology over the study period, which introduces discontinuity that a single-stock series does not have.
Key Dates After the 2026 Midterms
| Period | Potential catalyst |
|---|---|
| October 2026 | Third-quarter energy earnings; OPEC+ production decisions |
| November 3, 2026 | Federal midterm election day |
| November–December 2026 | Lame-duck session; any year-end tax package |
| January 3, 2027 | New Congress seated; committee assignments |
| Q1 2027 | Full-year guidance and capital-budget announcements |
| Spring 2027 | Any permitting-reform legislation reaches committee |
| Throughout 2027 | Interconnection queue reform, LNG approvals, EPA rulemaking |
How to Analyze an Energy Election Trade Properly
A disciplined process beats a directional guess:
- Separate the legislative channel from the executive channel. Ask which branch controls the lever you are betting on. If it is leasing, LNG approvals or EPA rules, a midterm does not touch it.
- Price the commodity first. Build the oil and gas price assumption before the political one. If your thesis breaks at a twenty-dollar move in crude, it is a commodity thesis wearing a political costume.
- Check the duration. For any clean-energy position, write down what happens if the ten-year yield moves a hundred basis points. If that number is larger than your policy number, you own a rates position.
- Prefer the company to the theme. First Solar captured the IRA; the solar ETF did not. Legislation is written in specifics, and specifics accrue to specific balance sheets.
- Distinguish headline risk from earnings risk. Hearings and subpoenas move multiples. Tax law moves cash flow. They are not the same trade and they do not have the same half-life.
- Size for the fact that the first move often reverses. The one-month and twelve-month reactions have repeatedly had opposite signs. Position sizing should reflect that.
- Write the invalidation condition before the election, not after. Decide in advance what evidence would tell you the thesis is wrong.
A practical SimianX AI watchlist can hold `XOM`, `CVX`, FSLR and `NEE` together and monitor earnings revisions, SEC filings, live news sentiment and technical reactions around each policy catalyst. You can run a full multi-agent session on any of them from the live analysis room, or browse the complete US stock coverage.
A Short Glossary for Energy-Policy Investing
These terms recur in every election-season energy discussion and are frequently used loosely. Precise definitions make the difference between analysing a policy and reacting to a headline.
Investment Tax Credit (ITC). A credit claimed against the capital cost of building a qualifying energy project. Because it is claimed up front, it improves project economics immediately and is especially valuable to developers with large construction pipelines.
Production Tax Credit (PTC). A credit earned per unit of electricity generated over a defined operating period. It rewards output rather than construction, which suits high-capacity-factor assets such as onshore wind.
Advanced manufacturing production credit. A per-unit credit for domestically manufactured components — cells, wafers, modules, inverters, battery parts. This is the provision that separated First Solar from the rest of the solar complex after 2022, and the IRS guidance page is the primary source for its mechanics.
Duration. The sensitivity of an asset's present value to a change in the discount rate. Long-duration assets — those whose cash flows arrive far in the future — fall more when rates rise. Renewable developers and residential solar financiers are structurally long-duration, which is why they behave like long bonds during tightening cycles.
Take-or-pay contract. An agreement under which a buyer pays for contracted volume whether or not it takes delivery. Common in liquefied natural gas, it converts a commodity business into something closer to a toll road and materially reduces sensitivity to spot prices.
Interconnection queue. The backlog of generation projects waiting for permission to connect to the transmission grid. In many US regions the queue, not capital or policy, is now the binding constraint on how fast new generation reaches the market.
Capital discipline. The post-2020 industry practice of prioritising free cash flow, dividends, buybacks and debt reduction over production growth. It is the main reason oil equities re-rated upward even as the long-term demand narrative grew more uncertain.
Strategic Petroleum Reserve. The federal crude stockpile. Releases and refills are an executive-branch tool that can influence prices at the margin and are not affected by a midterm election.
Realized price. What a producer actually receives per barrel or per thousand cubic feet after differentials, hedges and transport, as opposed to the headline benchmark price. Hedging programmes mean a company's realized price can lag a benchmark move by quarters.
Frequently Asked Questions
Do energy stocks go up when a pro-drilling party wins?
Not reliably. In the twelve months after the November 2016 election — the most explicitly pro-drilling result in modern US politics — the energy sector returned +0.7% while the S&P 500 returned +21.0%. The relationship between energy policy rhetoric and energy equity returns has been weak to negative in the modern data.
Which energy stock is most sensitive to a congressional election?
First Solar, because tax credits for domestic manufacturing map directly to its income statement. It returned +64.0% in the twelve months after the Inflation Reduction Act was signed, while the broader solar ETF fell 33.6% over the same period. Legislative specifics accrue to specific companies rather than to themes.
Why did clean energy fall after the largest clean-energy subsidy in history?
Interest rates. Clean energy is a long-duration asset class and residential solar is a financed consumer purchase, so both are acutely sensitive to the discount rate and to financing costs. The Federal Reserve's tightening cycle over 2022 and 2023 overwhelmed the subsidy's benefit for most of the sector.
Does a midterm election change oil drilling policy?
Not directly. Federal leasing, offshore permitting, LNG export approvals and EPA rules are executive-branch functions and are not on the ballot in a midterm. Congress controls tax credits, permitting law and appropriations. The presidency, which controls the rest, is not contested until 2028.
Is divided government good or bad for energy stocks?
For clean energy, gridlock is quietly favorable, because the sector's principal political risk is the repeal of credits it already holds — and a Congress that cannot pass legislation cannot repeal it either. For oil and gas, divided government is close to neutral, since the commodity price dominates.
What happened to energy stocks after the 2022 midterms?
The energy sector fell 11.1% over the following twelve months while the S&P 500 rose 14.5%. The decline reflected the normalization of energy prices after the 2022 spike rather than anything about the election result.
Should I buy solar stocks before an election?
This article does not make recommendations. What the data shows is that election-driven positioning in solar has repeatedly been a rates position in disguise, and that the one-month reaction and the twelve-month outcome have frequently had opposite signs. Understanding your actual exposure matters more than the political forecast.
How much does the oil price matter compared with policy?
Historically, far more. Between November 2014 and November 2015 crude fell by more than half, and no policy outcome available in that window could have offset the earnings impact. A twenty-dollar move in crude typically outweighs any plausible near-term change in federal energy tax policy.
Are utilities an energy-election trade?
Less than they used to be. Data-center-driven load growth has turned utilities into growth businesses after two decades of flat demand, and that structural change now dominates their earnings outlook. They remain rate-sensitive, which is a bigger risk than any congressional outcome.
What is the best way to track these catalysts?
Follow the specific measurable variables rather than the political narrative: the forward crude and natural gas strip, the ten-year yield, corporate capital budgets and buyback authorizations, interconnection queue data, and the actual legislative text of any tax package. The EIA's weekly petroleum status report and Today in Energy are the best free primary sources. Everything else is commentary.
Do oil majors pay enough dividends to change these comparisons?
Yes, meaningfully. Every figure in this article is a price return with dividends excluded, and the fossil complex has carried a substantially higher yield than clean energy throughout the study period. On a total-return basis the gap between XOM or CVX and the growth-stage clean-energy names narrows by several percentage points a year. That does not change the direction of any finding here, but it does mean the tables understate the majors.
Does OPEC matter more than Washington for these stocks?
For the oil-price-sensitive names, historically yes. Production decisions by OPEC and its partners set the global supply balance, and the global balance sets the realized price that drives earnings. American domestic policy influences US supply at the margin over multi-year horizons; an OPEC+ quota decision can move the strip within a day.
Why does LNG policy sit with the executive branch rather than Congress?
Export authorizations for liquefied natural gas are granted by the Department of Energy, with facility siting reviewed by the Federal Energy Regulatory Commission. Both are executive-branch functions operating under existing statute. Congress can change the underlying law or the agencies' funding, but it does not issue the approvals — which is why an LNG thesis is only weakly connected to a midterm result.
Is this analysis a recommendation to buy or avoid energy stocks?
No. It is a historical study of how a specific and widely held assumption — that election outcomes reliably drive energy sector returns — has performed against the actual price record. The conclusion is about the weakness of that relationship, not about the attractiveness of any security. Nothing here accounts for your circumstances, time horizon or risk tolerance.
Conclusion
The relationship between an American election and an energy portfolio is real but far weaker, slower and more inverted than the standard narrative claims.
- The energy sector underperformed the S&P 500 in the twelve months after four of the last five midterms, averaging a 6.7 percentage point shortfall.
- After the most pro-fossil presidential result in modern history, energy returned +0.7% and First Solar returned +84.5%. After the most pro-climate result, energy returned +94.5% and Occidental returned +249.3%.
- The largest clean-energy subsidy ever enacted was followed by a one-third decline in the solar complex, because the rate channel overwhelmed the subsidy channel.
- The single exception — First Solar's +64.0% after the IRA — is the template for how policy actually pays: through specific legislative language reaching a specific balance sheet, not through a thematic ETF.
- A midterm changes tax law, permitting law and appropriations. It does not change leasing, LNG approvals or EPA rules, which stay with the executive branch until 2029.
- Oil prices, interest rates and capital discipline have historically dominated all of it.
Build the thesis before Election Day, define the evidence that would invalidate it, and update the position when policy becomes measurable rather than when campaign rhetoric becomes louder.