 लेखक: Muke
$930 मिलियन ETF प्रवाह श्रृंखला: बिटकॉइन की $70K की दौड़ का डेटा
बिटकॉइन का $66,000 के ऊपर वापस आना बाजार के सबसे महत्वपूर्ण निकट-अवधि के सवालों में से एक को फिर से जीवित कर दिया है: क्या बिटकॉइन ETF प्रवाह BTC को $70K तक पहुंचा सकता है?
यह उछाल उल्लेखनीय है क्योंकि यह संस्थागत बिक्री के हफ्तों और $60,000 के निचले स्तर के आसपास समर्थन के बार-बार परीक्षण के बाद आया है। बिटकॉइन ने 21 जुलाई, 2026 को $66,000 के ऊपर थोड़ी देर के लिए कारोबार किया, जो कि जून की शुरुआत के बाद से इसका सबसे ऊंचा स्तर था, इसके बाद अगले दिन लगभग $65,600 की ओर वापस आ गया।
इस बीच, अमेरिका के स्पॉट बिटकॉइन ETF ने छह लगातार सत्रों में शुद्ध प्रवाह दर्ज किया, यह सुझाव देते हुए कि डिजिटल संपत्तियों के लिए एक कठिन अवधि के बाद नियामक संस्थागत मांग वापस आ सकती है।
व्यापारियों के लिए, मुद्दा केवल यह नहीं है कि क्या बिटकॉइन $70,000 को थोड़ी देर के लिए छू सकता है। अधिक उपयोगी सवाल यह है कि ETF मांग, तकनीकी गति, मैक्रो स्थितियां, और उपलब्ध बाजार तरलता का संयोजन स्थायी ब्रेकआउट उत्पन्न करने के लिए पर्याप्त मजबूत है या नहीं।
SimianX AI निवेशकों को इस सवाल का मूल्यांकन करने में मदद करता है, जो मूल्य कार्रवाई, संस्थागत प्रवाह, डेरिवेटिव्स स्थिति, बाजार की भावना, और मैक्रो संकेतों को एक साथ मिलाकर करता है, न कि किसी एक संकेतक पर निर्भर करता है।
कार्यकारी सारांश: बिटकॉइन को $70K तक क्या पहुंचा सकता है?
बिटकॉइन के $70,000 तक पहुंचने के लिए बुलिश तर्क चार प्रमुख विकासों पर आधारित है:
- अमेरिकी स्पॉट बिटकॉइन ETF ने शुद्ध खरीद में वापसी की है।
- BTC ने मनोवैज्ञानिक रूप से महत्वपूर्ण
$65,000–$66,000क्षेत्र को पुनः प्राप्त किया है।
- तकनीकी गति
$67,000के आसपास संभावित ब्रेकआउट स्तर के निकट सुधार रही है।
$70,000के माध्यम से एक कदम गति खरीद और शॉर्ट कवरिंग को ट्रिगर कर सकता है।
हालांकि, अभी भी महत्वपूर्ण जोखिम हैं:
- नवीनतम प्रवाह की लकीर मई और जून में दर्ज भारी ETF बहिर्वाह की तुलना में अपेक्षाकृत छोटी है।
- बिटकॉइन ने अभी तक
$67,000प्रतिरोध क्षेत्र के ऊपर निर्णायक दैनिक बंद नहीं किया है।
- फेडरल रिजर्व की जुलाई नीति बैठक जोखिम संपत्तियों में अस्थिरता पैदा कर सकती है।
- जब मैक्रो भावना बिगड़ती है तो ETF प्रवाह जल्दी पलट सकते हैं।
मुख्य निष्कर्ष: ETF प्रवाह बिटकॉइन को $70,000 तक पहुँचने में मदद कर सकते हैं, लेकिन संभावना तब ही काफी बढ़ती है जब प्रवाह सकारात्मक रहते हैं जबकि BTC
$67,000के आसपास प्रतिरोध को मजबूत स्पॉट-मार्केट वॉल्यूम के साथ साफ करता है।
| मार्केट वेरिएबल | बुलिश सिग्नल | वार्निंग सिग्नल |
|---|---|---|
| स्पॉट ETF प्रवाह | $150M के ऊपर कई सत्र | बड़े नेट बहिर्वाह की वापसी |
| BTC मूल्य | $67K के ऊपर दैनिक बंद | अस्वीकृति के बाद $65K के नीचे गिरावट |
| ट्रेडिंग वॉल्यूम | बढ़ता स्पॉट-नेतृत्व वाला वॉल्यूम | मुख्य रूप से लीवरेज द्वारा संचालित रैली |
| मैक्रो वातावरण | स्थिर उपज और कमजोर डॉलर | हॉकिश फेड या बढ़ती उपज |
| डेरिवेटिव्स | मध्यम फंडिंग और शॉर्ट कवरिंग | अत्यधिक लंबी लीवरेज |
| मार्केट ब्रेड्थ | ETH और क्रिप्टो इक्विटीज मजबूत होती हैं | BTC बढ़ता है जबकि व्यापक बाजार कमजोर होता है |
क्यों बिटकॉइन का $66K के ऊपर लौटना महत्वपूर्ण है
बिटकॉइन का $66,000 के ऊपर जाना जून की शुरुआत के बाद से उस सीमा को पुनः प्राप्त करने का इसका पहला विश्वसनीय प्रयास था। हालांकि BTC बाद में $65,600 की ओर वापस गिर गया, लेकिन उस क्षेत्र को पुनः प्राप्त करना दिखाता है कि खरीदार आपूर्ति को अवशोषित करने के लिए अधिक इच्छुक हो रहे थे, जो हफ्तों की रक्षात्मक स्थिति के बाद था।
यह जून की शुरुआत से एक महत्वपूर्ण बदलाव है, जब बिटकॉइन $60,000 के निचले क्षेत्र का परीक्षण कर रहा था जबकि ETF रिडेम्प्शन और कमजोर अटकल मांग ने बाजार पर दबाव डाला।
SimianX ने पहले 2026 के निचले स्तरों के पास Bitcoin और BTC पुनरुद्धार संकेतों के अपने विश्लेषण में उस नकारात्मक सेटअप का अध्ययन किया था। उस पहले के शोध ने संभावित निचले स्तर की पहचान पर ध्यान केंद्रित किया। वर्तमान प्रश्न यह है कि क्या पुनरुद्धार अब एक वास्तविक ब्रेकआउट बनने के लिए पर्याप्त संस्थागत समर्थन प्राप्त कर चुका है।
$66,000 स्तर तीन कारणों से महत्वपूर्ण है।
पहला, यह Bitcoin को इसके हाल के व्यापारिक दायरे के ऊपरी हिस्से के करीब रखता है। एक बाजार समर्थन से बार-बार पुनरुद्धार कर सकता है बिना बुलिश हुए, लेकिन दायरे के शीर्ष की ओर बढ़ने से शॉर्ट सेलर्स और कम आवंटित निवेशकों को अपनी स्थिति का पुनर्मूल्यांकन करने के लिए मजबूर करता है।
दूसरा, यह कदम ETF प्रवाह में सुधार के साथ हुआ है। स्पॉट मांग द्वारा समर्थित मूल्य वृद्धि आमतौर पर उन वृद्धि से अधिक टिकाऊ होती है जो मुख्य रूप से अत्यधिक लीवरेज किए गए फ्यूचर्स स्थितियों के कारण होती हैं।
तीसरा, $66,000 एक अधिक महत्वपूर्ण तकनीकी क्षेत्र के करीब है जो $67,000 के आसपास है। उस क्षेत्र के ऊपर एक पुष्टि ब्रेक $69,000 और मनोवैज्ञानिक रूप से महत्वपूर्ण $70,000 सीमा की ओर एक अपेक्षाकृत सीधा मार्ग खोल सकता है।
Bitcoin ETF प्रवाह: नवीनतम आंकड़े क्या दिखाते हैं
पुनरुद्धार का सबसे मजबूत सबूत सकारात्मक अमेरिकी स्पॉट Bitcoin ETF प्रवाह की वापसी है।
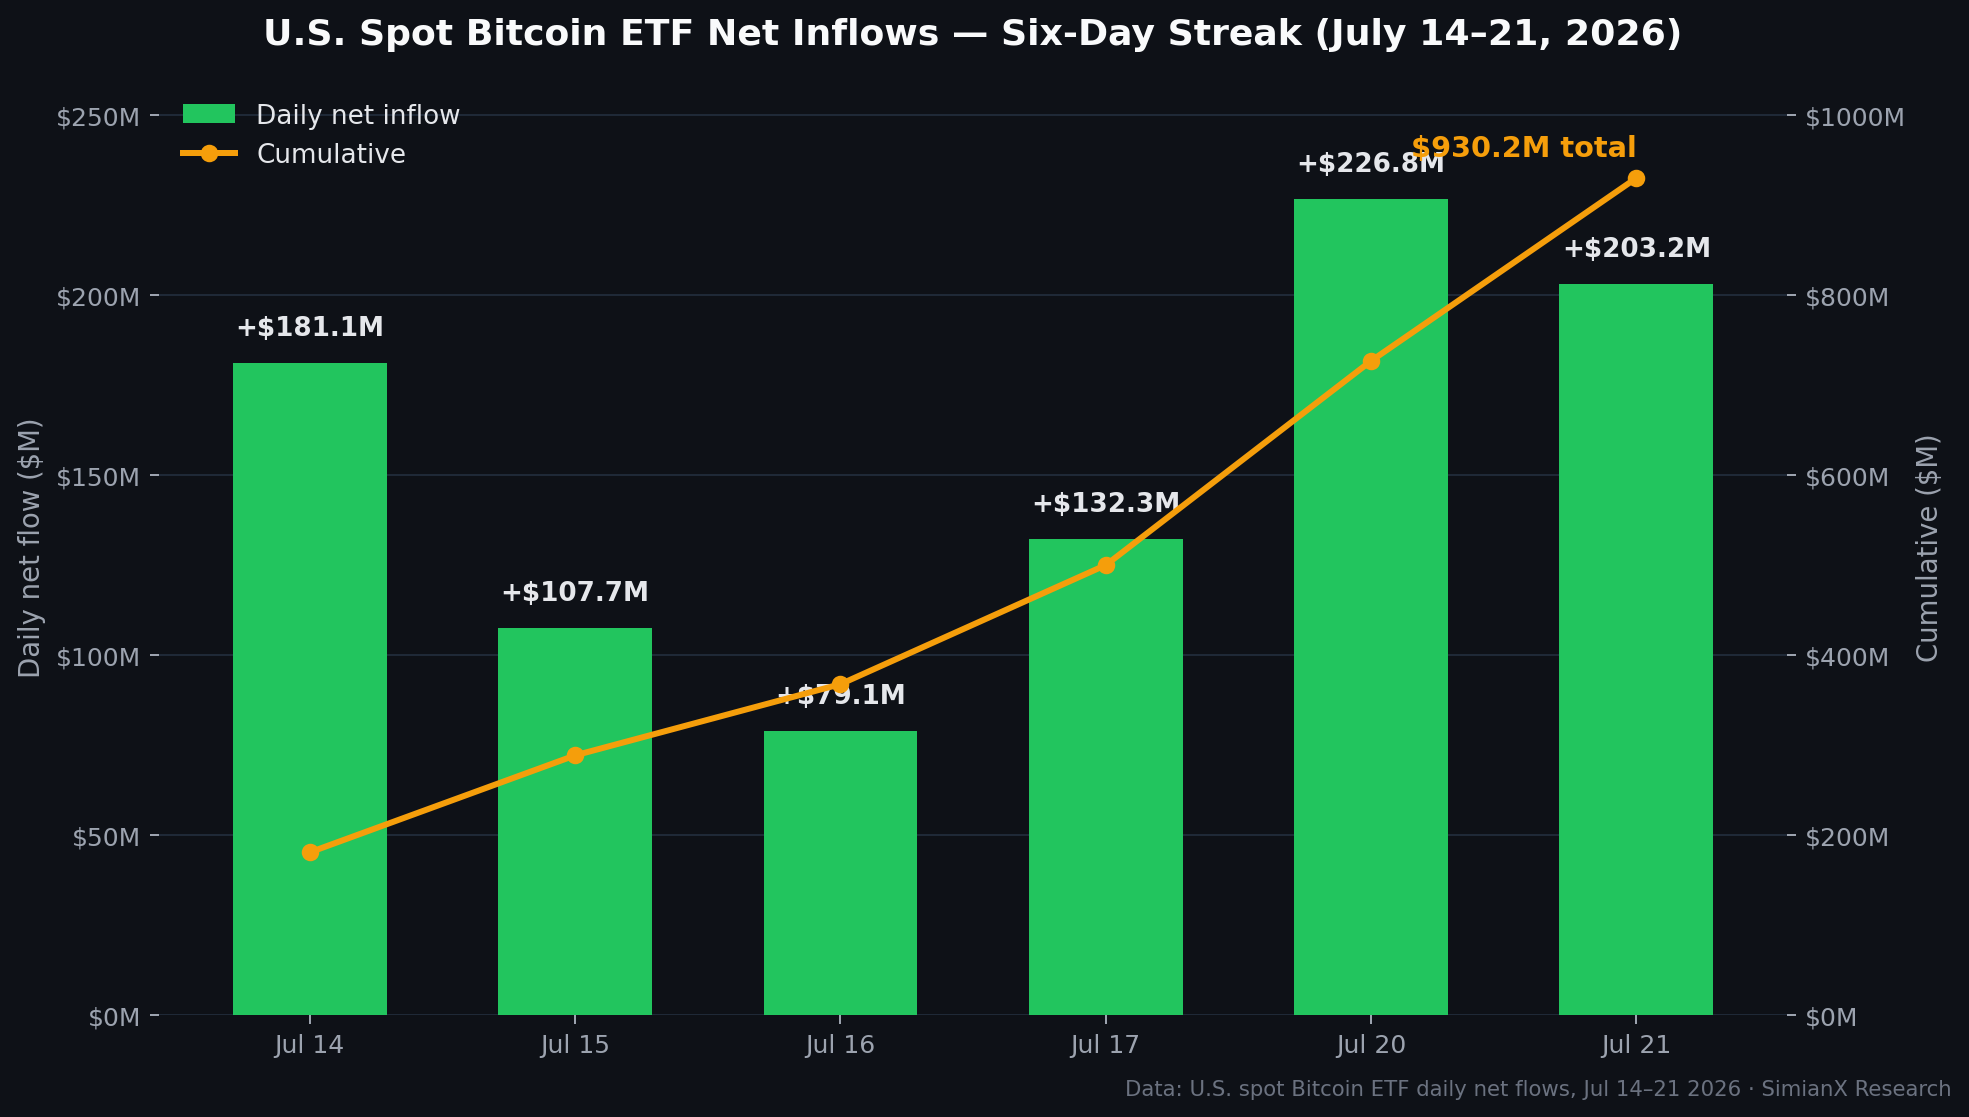
14 जुलाई से 21 जुलाई तक, अमेरिकी स्पॉट Bitcoin ETFs ने छह लगातार व्यापारिक दिनों में शुद्ध प्रवाह दर्ज किया:
| दिनांक | शुद्ध स्पॉट Bitcoin ETF प्रवाह |
|---|---|
| 14 जुलाई | +$181.1M |
| 15 जुलाई | +$107.7M |
| 16 जुलाई | +$79.1M |
| 17 जुलाई | +$132.3M |
| 20 जुलाई | +$226.8M |
| 21 जुलाई | +$203.2M |
| छह दिन का कुल | +$930.2M |
इस श्रृंखला ने छह सत्रों में अमेरिकी स्पॉट Bitcoin उत्पादों में लगभग $930 मिलियन लाए।
BlackRock का IBIT मांग का एक बड़ा हिस्सा था, जिसमें अकेले 21 जुलाई को लगभग $163.9 मिलियन शामिल था। Fidelity का FBTC उसी सत्र में लगभग $23.1 मिलियन जोड़ा।
फिर भी, मासिक चित्र छह-दिन के कुल से कम नाटकीय है। जुलाई की प्रारंभिक निकासी, जिसमें 13 जुलाई को एक महत्वपूर्ण शुद्ध निकासी शामिल है, ने महीने की कुल वसूली को कम कर दिया।
यह भेद महत्वपूर्ण है।
अल्पकालिक दिशा में सुधार हुआ है, लेकिन व्यापक संस्थागत वसूली अभी तक प्रभावशाली नहीं है।
हाल के प्रवाह भी पिछले हफ्तों में बिटकॉइन ईटीएफ उत्पादों से निकले अरबों डॉलर की तुलना में मामूली बने हुए हैं। इसलिए, वर्तमान प्रवाह संभावित रूप से एक महत्वपूर्ण उलटफेर संकेत का प्रतिनिधित्व करता है, लेकिन यह निश्चित प्रमाण नहीं है कि संस्थाएं पूरी तरह से वापस आ गई हैं।
ईटीएफ प्रवाह बिटकॉइन की कीमत को कैसे प्रभावित करते हैं?
स्पॉट बिटकॉइन ईटीएफ प्रवाह कई जुड़े हुए तंत्रों के माध्यम से बीटीसी को प्रभावित कर सकते हैं।
1. ईटीएफ निर्माण अंतर्निहित मांग उत्पन्न करते हैं
जब निवेशक नए ईटीएफ शेयर खरीदते हैं और मांग उपलब्ध द्वितीयक बाजार की आपूर्ति से अधिक होती है, तो अधिकृत प्रतिभागी अतिरिक्त शेयरों का निर्माण करने में मदद करते हैं।
फंड या इसके निष्पादन भागीदारों को तब संबंधित बिटकॉइन एक्सपोजर प्राप्त करना चाहिए।
प्रभाव हमेशा तात्कालिक या स्पॉट मार्केट में पूरी तरह से स्पष्ट नहीं होता है, लेकिन लगातार शुद्ध निर्माण आमतौर पर बिटकॉइन के लिए वृद्धिशील मांग का प्रतिनिधित्व करते हैं।
2. ईटीएफ खरीदने से उपलब्ध तरल आपूर्ति कम होती है
बिटकॉइन की एक निश्चित अधिकतम आपूर्ति है, जबकि एक्सचेंजों पर तत्काल बिक्री के लिए उपलब्ध मात्रा उसकी कुल परिसंचारी आपूर्ति से बहुत छोटी है।
इसलिए, लगातार संस्थागत खरीद तब असमान प्रभाव डाल सकती है जब विक्रेता अपने सिक्कों को वितरित करने में अनिच्छुक होते हैं।
उदाहरण के लिए, $1 बिलियन की मांग बिटकॉइन की कीमत $66,000 पर लगभग दर्शाती है:
$1,000,000,000 ÷ $66,000 = 15,152 BTC
यह यह नहीं बताता कि $1 बिलियन ETF प्रवाह स्वचालित रूप से एक्सचेंजों से ठीक 15,152 BTC हटा देता है। फंड विभिन्न निष्पादन विंडो, प्रतिपक्षों, तरलता प्रदाताओं और निपटान व्यवस्थाओं का उपयोग कर सकते हैं।
हालांकि, यह गणना यह दर्शाती है कि कई लगातार उच्च प्रवाह सत्र सीमित उपलब्ध आपूर्ति वाले बाजार को कैसे प्रभावित कर सकते हैं।
3. ETF प्रवाह संस्थागत विश्वास को मजबूत करते हैं
ETF प्रवाह भी एक भावना संकेतक हैं।
सकारात्मक प्रवाह डेटा यह संकेत दे सकता है कि वित्तीय सलाहकार, संस्थान, पारिवारिक कार्यालय, पेंशन से संबंधित खाते, और ब्रोकर ग्राहक बिटकॉइन में अपनी भागीदारी बढ़ा रहे हैं।
यह संकेत अतिरिक्त खरीदारों को आकर्षित कर सकता है जो स्वयं ETF के माध्यम से निवेश नहीं कर रहे हैं।
4. बढ़ती कीमतें एक फीडबैक लूप बना सकती हैं
एक सामान्य बाजार अनुक्रम है:
- ETF मांग उपलब्ध आपूर्ति को अवशोषित करती है।
- बिटकॉइन एक महत्वपूर्ण प्रतिरोध स्तर के माध्यम से बढ़ता है।
- शॉर्ट पोजीशन बंद की जाती हैं।
- मोमेंटम ट्रेडर्स बाजार में प्रवेश करते हैं।
- वित्तीय मीडिया कवरेज अधिक सकारात्मक हो जाती है।
- अतिरिक्त निवेशक पूंजी आवंटित करते हैं।
यह प्रत्यावर्ती प्रक्रिया $67,000 से $70,000 की ओर बढ़ने को तेज कर सकती है, विशेष रूप से यदि प्रारंभिक ब्रेकआउट वास्तविक स्पॉट खरीद द्वारा समर्थित हो।
क्या वर्तमान संस्थागत मांग पर्याप्त बड़ी है?
हालिया ETF प्रवाह की लकीर सकारात्मक है, लेकिन बिटकॉइन को शायद $70,000 के ऊपर एक स्थायी आंदोलन स्थापित करने के लिए एक मजबूत सप्ताह से अधिक की आवश्यकता है।
अमेरिकी स्पॉट बिटकॉइन ETF ने अपने लॉन्च के बाद से दर्जनों अरब डॉलर के संचयी शुद्ध प्रवाह को आकर्षित किया है। यह पुष्टि करता है कि उत्पाद बिटकॉइन मांग का एक प्रमुख संरचनात्मक स्रोत बन गए हैं।
ब्लैकरॉक का IBIT भी एक महत्वपूर्ण बिटकॉइन स्थिति जमा कर चुका है, यह दर्शाते हुए कि विनियमित ETF उत्पाद व्यापक क्रिप्टोकरेंसी बाजार में कितने महत्वपूर्ण बन गए हैं।
फिर भी परिवर्तन की दर अगली चाल के लिए पहले से रखी गई कुल राशि से अधिक महत्वपूर्ण है।
एक ETF जो अरबों डॉलर का Bitcoin रखता है, हर दिन कीमतों को स्वचालित रूप से ऊंचा नहीं करता है। कीमतें उपलब्ध आपूर्ति और मौजूदा बिक्री दबाव के सापेक्ष नए शुद्ध मांग पर प्रतिक्रिया करती हैं।
BTC को $70,000 की ओर स्थायी रूप से बढ़ने के लिए, निवेशकों को निम्नलिखित पर ध्यान देना चाहिए:
- सकारात्मक शुद्ध प्रवाह के लिए कम से कम कई और दिन।
- एक प्रमुख ETF के अलावा व्यापक भागीदारी।
- पांच-दिन या दस-दिन के ETF प्रवाह औसत में वृद्धि।
- दीर्घकालिक Bitcoin धारकों से सीमित बिक्री।
- प्रतिरोध टूटने के दौरान मजबूत स्पॉट-मार्केट वॉल्यूम।
- स्थिर या मध्यम स्थायी-फ्यूचर्स फंडिंग दरें।
ETF खरीद और स्पॉट वॉल्यूम द्वारा संचालित एक रैली आमतौर पर एक आक्रामक रूप से लीवरेज किए गए स्थायी फ्यूचर्स द्वारा संचालित रैली की तुलना में अधिक स्वस्थ होती है।
क्या Bitcoin ETF इनफ्लो BTC को $70K तक धकेल सकते हैं?
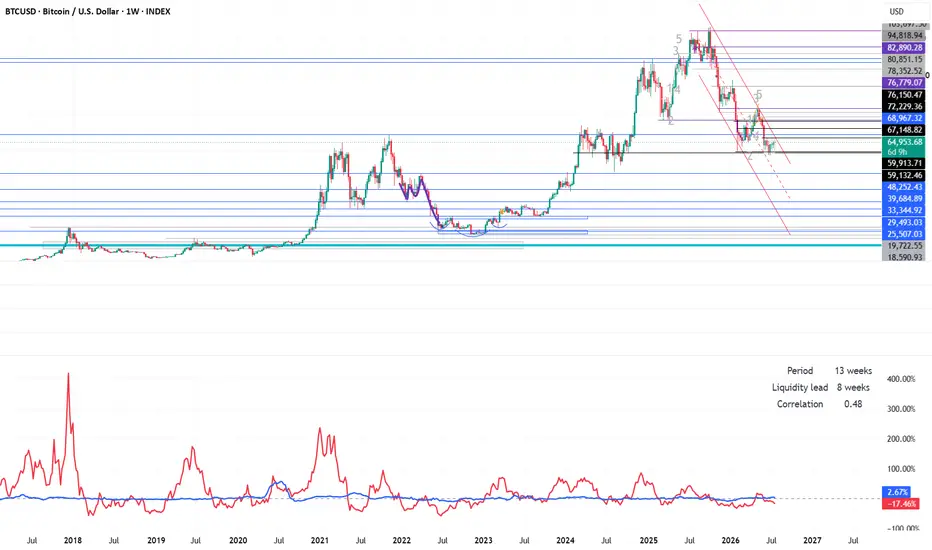
हाँ, लेकिन रास्ता संभवतः इस पर निर्भर करता है कि क्या Bitcoin पहले $66,500–$67,000 क्षेत्र को पार कर सकता है।
हाल की तकनीकी स्थितियाँ बेहतर गति, $60,000 के आसपास समर्थन, और एक बुलिश रिवर्सल संरचना के संभावित निर्माण का सुझाव देती हैं।
$67,000 के आसपास एक पुष्टि की गई ब्रेकआउट बाजार का ध्यान $70,000 से परे स्थानांतरित कर सकती है, जिसमें $70,000 के निम्न से मध्य रेंज की ओर एक व्यापक आंदोलन की संभावना है।
तत्काल तकनीकी मानचित्र को निम्नलिखित रूप में संक्षेपित किया जा सकता है:
| मूल्य क्षेत्र | बाजार महत्व |
|---|---|
$60K–$62K | प्रमुख मध्यम-कालिक समर्थन और हाल का बॉटमिंग क्षेत्र |
$63K–$64K | यदि गति कमजोर होती है तो द्वितीयक समर्थन |
$65K | शॉर्ट-टर्म ट्रेंड और भावना का पिवट |
$66.5K–$67K | प्राथमिक ब्रेकआउट प्रतिरोध |
$68.5K–$69K | संभावित आपूर्ति और लाभ-उठाने का क्षेत्र |
$70K | मनोवैज्ञानिक लक्ष्य और प्रमुख पुष्टि स्तर |
$72K–$75K | यदि ब्रेकआउट तेज होता है तो संभावित विस्तार |
$67,000 के ऊपर एक संक्षिप्त अंतर्दिन आंदोलन पर्याप्त नहीं होगा।
मजबूत ब्रेकआउट पुष्टि में शामिल होगा:
- प्रतिरोध के ऊपर दैनिक बंद।
- विस्तारित स्पॉट ट्रेडिंग वॉल्यूम।
- निरंतर ETF इनफ्लो।
- फ्यूचर्स फंडिंग में कोई चरम वृद्धि नहीं।
$66,000–$67,000को समर्थन के रूप में सफल पुनः परीक्षण।
सर्वश्रेष्ठ बुलिश सेटअप केवल यह नहीं है कि बिटकॉइन $70K को छूता है। यह बिटकॉइन का $67K तोड़ना, उस स्तर का सफल पुनः परीक्षण करना, और फिर निरंतर संस्थागत मांग के साथ आगे बढ़ना है।
बिटकॉइन की अगली चाल के लिए तीन परिदृश्य
बुल केस: ETF मांग में तेजी
बुलिश परिदृश्य में, दैनिक ETF प्रवाह लगभग $150 मिलियन के ऊपर रहते हैं और IBIT, FBTC, ARKB, और अन्य प्रमुख उत्पादों से भागीदारी शामिल होती है।
बिटकॉइन $67,000 के ऊपर बंद होता है, स्पॉट वॉल्यूम बढ़ता है, और बाजार $68,500 के माध्यम से बिना किसी प्रमुख अस्वीकृति के आगे बढ़ता है।
शॉर्ट कवरिंग और गति की मांग फिर BTC को $70,000 का परीक्षण करने में मदद करती है।
$70,000 के ऊपर सफल दैनिक बंद होने से ध्यान $72,000–$75,000 की ओर बढ़ सकता है।
बुल-केस की संभावना तब बढ़ती है जब:
- पांच-दिन के ETF प्रवाह मजबूत सकारात्मक रहते हैं।
- BTC
$65,000के ऊपर बना रहता है।
- एक्सचेंज बैलेंस में गिरावट जारी रहती है।
- फंडिंग दरें नियंत्रित रहती हैं।
- अमेरिकी डॉलर और ट्रेजरी यील्ड स्थिर रहते हैं।
- क्रिप्टो-संबंधित शेयर रैली में भाग लेते हैं।
बेस केस: बिटकॉइन $70K के नीचे समेकित होता है
बेस केस में, ETF प्रवाह सकारात्मक लेकिन मध्यम रहते हैं।
बिटकॉइन बार-बार $67,000–$69,000 का परीक्षण करता है बिना पर्याप्त स्पॉट वॉल्यूम के जो इसे तोड़ सके।
BTC तब लगभग $64,000 और $68,500 के बीच समेकित हो सकता है जबकि निवेशक एक मजबूत मैक्रो या संस्थागत उत्प्रेरक की प्रतीक्षा करते हैं।
यह परिणाम पुनर्प्राप्ति को अनिवार्य रूप से अमान्य नहीं करेगा।
एक पुनरुद्धार के बाद समेकन अत्यधिक लीवरेज को रीसेट करने, अल्पकालिक धारकों को लाभ उठाने, और महत्वपूर्ण मूविंग एवरेज को सुधारने की अनुमति दे सकता है।
एक लंबी समेकन अवधि अंततः $70,000 की ओर एक तात्कालिक, लीवरेज-प्रेरित चाल की तुलना में एक स्वस्थ ब्रेकआउट उत्पन्न कर सकती है।
बियर केस: ETF प्रवाह उलटते हैं
बियरिश परिदृश्य तब शुरू होता है जब ETF से निकासी, एक हॉकिश मैक्रो सरप्राइज, या व्यापक जोखिम संपत्तियों में तेज गिरावट होती है।
यदि बिटकॉइन $65,000 के नीचे गिरता है, तो बाजार $63,000–$64,000 के आसपास समर्थन पर फिर से विचार कर सकता है।
एक गहरी गिरावट $60,000–$62,000 क्षेत्र को फिर से ध्यान में लाएगी।
सबसे गंभीर चेतावनी एक संयोजन होगा:
- एक या अधिक सत्रों में ETF निकासी
$300 मिलियनसे अधिक होना।
$67,000के ऊपर एक असफल ब्रेकआउट।
- जबकि स्पॉट मांग कमजोर होती है, फ्यूचर्स लीवरेज बढ़ रहा है।
$63,000के नीचे एक दैनिक बंद।
- केंद्रीकृत एक्सचेंजों में बिटकॉइन जमा बढ़ना।
फेडरल रिजर्व निकट-अवधि का सबसे बड़ा मैक्रो जोखिम है
बिटकॉइन का ETF-प्रेरित पुनर्प्राप्ति फेडरल रिजर्व की जुलाई नीति बैठक से ठीक पहले हो रहा है।
बैठक, नीति वक्तव्य, और प्रेस कॉन्फ्रेंस ट्रेजरी यील्ड, अमेरिकी डॉलर, शेयरों, और क्रिप्टोक्यूरेंसी कीमतों को प्रभावित कर सकते हैं।
जब वित्तीय परिस्थितियाँ अधिक सहायक होती हैं, तो बिटकॉइन आमतौर पर लाभान्वित होता है, विशेष रूप से जब:
- वास्तविक यील्ड गिरती है।
- अमेरिकी डॉलर कमजोर होता है।
- निवेशक आसान मौद्रिक नीति की अपेक्षा करते हैं।
- शेयर बाजार में जोखिम लेने की भावना बेहतर होती है।
- वैश्विक तरलता की अपेक्षाएँ बढ़ती हैं।
विपरीत परिस्थितियाँ ETF मांग के प्रभाव को सीमित कर सकती हैं।
उदाहरण के लिए, यहां तक कि मजबूत ETF प्रवाह भी BTC को प्रतिरोध के माध्यम से धकेलने में विफल हो सकते हैं यदि ट्रेजरी यील्ड तेज़ी से बढ़ती है या निवेशक अधिक प्रतिबंधात्मक मौद्रिक नीति के दृष्टिकोण को मूल्यांकन करना शुरू करते हैं।
उस वातावरण में, संस्थाएँ ब्रेकआउट का पीछा करने के बजाय जोखिम को कम करने के लिए मूल्य ताकत का उपयोग कर सकती हैं।
इसका मतलब है कि ETF प्रवाह का विश्लेषण अलग-थलग नहीं किया जाना चाहिए।
एक व्यापक ढांचा संयोजित करना चाहिए:
- ETF निर्माण और रिडेम्प्शन
- बिटकॉइन स्पॉट-मार्केट वॉल्यूम
- ट्रेजरी यील्ड और डॉलर की दिशा
- परपेचुअल-फ्यूचर्स फंडिंग
- ऑप्शंस पोजिशनिंग
- ऑन-चेन एक्सचेंज फ्लोज़
- क्रिप्टो इक्विटी प्रदर्शन
SimianX AI इन संकेतों को एकीकृत बाजार दृष्टिकोण में व्यवस्थित करने में मदद कर सकता है, एक आकर्षक शीर्षक के आधार पर निर्णय लेने के जोखिम को कम कर सकता है।
$70K थिसिस को क्या अमान्य कर सकता है?
कई विकास ऐसे तर्क को कमजोर कर देंगे कि ETF प्रवाह बिटकॉइन को $70,000 तक पहुंचा सकते हैं।
ETF प्रवाह संकेंद्रित या अधूरा हो जाता है
यदि सकारात्मक शीर्षक प्रवाह केवल एक उत्पाद द्वारा संचालित होते हैं जबकि कई प्रतिस्पर्धी फंडों में रिडेम्प्शन होते हैं, तो संस्थागत मांग उतनी व्यापक नहीं हो सकती जितनी यह प्रतीत होती है।
कई ETF उत्पादों में व्यापक भागीदारी यह पुष्टि करेगी कि निवेशकों की रुचि में सुधार हो रहा है।
बिटकॉइन बार-बार $67K के पास असफल होता है
बार-बार प्रतिरोध असफलताएँ शॉर्ट सेलर्स को प्रोत्साहित कर सकती हैं और हाल के खरीदारों को लाभ उठाने के लिए प्रेरित कर सकती हैं।
तीन या चार असफल प्रयास एक ब्रेकआउट स्तर को अधिक महत्वपूर्ण बना सकते हैं बजाय इसके कि वह कम महत्वपूर्ण हो।
यदि $67,000 की ओर प्रत्येक रैली घटते वॉल्यूम पर होती है, तो बाजार में $70,000 तक पहुंचने के लिए आवश्यक मांग की कमी हो सकती है।
लीवरेज स्पॉट मांग से तेज़ी से बढ़ता है
तेज़ी से बढ़ता ओपन इंटरेस्ट और फंडिंग दरें एक नाजुक रैली बना सकती हैं।
यदि मूल्य गति धीमी होती है, तो मजबूर लिक्विडेशन तेजी से उन्नति को उलट सकता है।
एक स्वस्थ ब्रेकआउट में आदर्श रूप से बढ़ती स्पॉट वॉल्यूम शामिल होनी चाहिए बिना स्थायी-फ्यूचर्स फंडिंग में अत्यधिक वृद्धि के।
दीर्घकालिक धारक ताकत में वितरण करते हैं
पुराने बिटकॉइन धारक निचले कीमतों पर जमा किए गए सिक्कों को बेचने के लिए रिकवरी का उपयोग कर सकते हैं।
ETF मांग को फिर सामान्य बाजार आपूर्ति और दीर्घकालिक निवेशकों से अतिरिक्त लाभ उठाने को अवशोषित करना होगा।
मैक्रो स्थितियाँ कड़ी होती हैं
उच्च बांड उपज, मजबूत डॉलर, भू-राजनीतिक तनाव, या एक हॉकिश फेडरल रिजर्व आश्चर्य निवेशकों की अस्थिर संपत्तियों को रखने की इच्छा को कम कर सकते हैं।
यहां तक कि मजबूत संस्थागत बिटकॉइन मांग भी एक व्यापक जोखिम-ऑफ वातावरण को पार करने में संघर्ष कर सकती है।
ब्रेकआउट की निगरानी के लिए एक व्यावहारिक चेकलिस्ट
निवेशक यह मूल्यांकन करते समय कि क्या बिटकॉइन $70,000 तक पहुंच सकता है, निम्नलिखित प्रक्रिया का उपयोग कर सकते हैं:
- दैनिक ईटीएफ प्रवाह की जांच करें। एक अलग सत्र के बजाय पांच-दिन के कुल पर ध्यान केंद्रित करें।
$67,000प्रतिरोध स्तर पर नज़र रखें। दैनिक बंद और उसके बाद के पुनः परीक्षण की तलाश करें।
- स्पॉट वॉल्यूम की तुलना डेरिवेटिव्स वॉल्यूम से करें। स्पॉट-नेतृत्व वाली खरीद आमतौर पर अधिक टिकाऊ होती है।
- फंडिंग दरों की निगरानी करें। अत्यधिक सकारात्मक फंडिंग ओवरक्राउडेड लॉन्ग पोजीशंस का संकेत दे सकती है।
- डॉलर और ट्रेजरी यील्ड को ट्रैक करें। बढ़ती यील्ड ईटीएफ मांग को संतुलित कर सकती है।
- एक्सचेंज इनफ्लोज़ की समीक्षा करें। एक्सचेंजों में बड़े ट्रांसफर आगामी बिक्री का संकेत दे सकते हैं।
- व्यापक क्रिप्टो भागीदारी पर नज़र रखें। एक स्वस्थ रैली पूरी तरह से बिटकॉइन पर निर्भर नहीं होनी चाहिए।
- एकल मोमबत्ती का पीछा करने से बचें। पुष्टि सटीक ब्रेकआउट क्षण की भविष्यवाणी करने से अधिक मूल्यवान है।
एक अधिक प्रणालीबद्ध दृष्टिकोण के लिए, व्यापारी SimianX का उपयोग कर सकते हैं ताकि संस्थागत प्रवाह, तकनीकी स्थितियों, बाजार की भावना, और एआई-जनित क्रिप्टो विश्लेषण की तुलना एक ही कार्यप्रवाह में की जा सके। लाइव SimianX क्रिप्टो लीडरबोर्ड यह भी दिखाता है कि 30+ AI मॉडल इसी बाजार में रियल-टाइम में कैसे ट्रेड कर रहे हैं।
बिटकॉइन ईटीएफ इनफ्लोज़ और $70K लक्ष्य के बारे में अक्सर पूछे जाने वाले प्रश्न
क्या बिटकॉइन जुलाई 2026 में $70K तक पहुंच सकता है?
बिटकॉइन $70,000 तक पहुंच सकता है यदि यह $67,000 के आसपास के प्रतिरोध को पार करता है और ईटीएफ प्रवाह सकारात्मक रहते हैं।
लक्ष्य हाल के $66,000 स्तर से केवल कुछ प्रतिशत अंक ऊपर है, लेकिन प्रतिरोध, मैक्रो अनिश्चितता, और लाभ-उठाने से गति धीमी हो सकती है।
बिटकॉइन को $70K तक पहुंचाने के लिए कितनी ईटीएफ इनफ्लो की आवश्यकता है?
कोई निश्चित राशि नहीं है क्योंकि मूल्य प्रभाव उपलब्ध तरलता और बिक्री दबाव पर निर्भर करता है।
लगभग $150 मिलियन–$250 मिलियन के ऊपर कई लगातार सत्र, मजबूत स्पॉट वॉल्यूम के साथ मिलकर, एक असामान्य रूप से बड़े इनफ्लो दिन की तुलना में अधिक विश्वसनीय समर्थन प्रदान करेगा।
क्या बिटकॉइन ईटीएफ इनफ्लो हमेशा BTC के लिए बुलिश होते हैं?
सकारात्मक ETF प्रवाह सामान्यतः सहायक होते हैं क्योंकि वे नए विनियमित मांग का प्रतिनिधित्व करते हैं।
हालांकि, वे तत्काल मूल्य वृद्धि की गारंटी नहीं देते, विशेष रूप से जब खनिक, दीर्घकालिक धारक, हेज फंड, या विदेशी निवेशक एक ही समय में बिक्री कर रहे होते हैं।
$70K से पहले सबसे महत्वपूर्ण बिटकॉइन प्रतिरोध क्या है?
तत्काल प्रतिरोध क्षेत्र लगभग $66,500–$67,000 है।
इस रेंज के ऊपर एक पुष्टि की गई दैनिक बंद $69,000 और $70,000 की ओर बढ़ने की संभावना को बढ़ाएगी।
बिटकॉइन $70K पूर्वानुमान को मंदी में क्या बदल सकता है?
यदि ETF प्रवाह नकारात्मक हो जाते हैं, बिटकॉइन $63,000 के नीचे बंद होता है, या फेडरल रिजर्व वित्तीय परिस्थितियों में तेज कसावट को प्रेरित करता है, तो यह सिद्धांत कमजोर हो जाएगा।
बिना मेल खाते स्पॉट मांग के एक लीवरेज्ड रैली भी एक चेतावनी संकेत होगी।
निष्कर्ष
बिटकॉइन का $66,000 के ऊपर वापस जाना एक महत्वपूर्ण सुधार संकेत है, विशेष रूप से क्योंकि यह छह लगातार सत्रों और लगभग $930 मिलियन के अमेरिकी स्पॉट बिटकॉइन ETF प्रवाह के साथ हुआ है।
हालांकि, ETF प्रवाह अकेले $70,000 की ओर बढ़ने की गारंटी नहीं देते।
बाजार को अभी भी $67,000 के ऊपर एक स्थायी ब्रेकआउट, मजबूत स्पॉट-मार्केट वॉल्यूम, नियंत्रित डेरिवेटिव लीवरेज, और एक मैक्रो वातावरण के माध्यम से पुष्टि की आवश्यकता है जो संस्थागत मांग पर हावी न हो।
निकट-अवधि का ढांचा सीधा है:
$67,000के ऊपर, बिटकॉइन का$70,000की ओर बढ़ना अधिक विश्वसनीय हो जाता है।
$64,000और$67,000के बीच, समेकन आधार मामला बना रहता है।
$63,000के नीचे, सुधार सिद्धांत का पुनर्मूल्यांकन आवश्यक है।
ETF प्रवाह, तकनीकी चार्ट, और मैक्रो संकेतों को अलग-अलग कहानियों के रूप में देखने के बजाय, निवेशकों को यह मूल्यांकन करना चाहिए कि वे कैसे इंटरैक्ट करते हैं।
क्रिप्टोक्यूरेंसी बाजार संकेतों को ट्रैक करने, AI-जनित विश्लेषण की तुलना करने, और बिटकॉइन की अगली बड़ी चाल का मूल्यांकन करने के लिए एक अधिक अनुशासित ढांचा बनाने के लिए SimianX AI का अन्वेषण करें।
संबंधित लेख
- बिटकॉइन 2026 के निचले स्तर: BTC सपोर्ट और रिबाउंड संकेत
- बिटकॉइन फरवरी 2026 क्रैश: $60K असली बॉटम है या और गिरावट?
- हर फेड दर कटौती के बाद बिटकॉइन: 2019-2026 पूर्ण संदर्भ डेटा
- Bitcoin हाफिंग चक्र: 2012-2028 पूर्ण रिटर्न संदर्भ गाइड
- Bitcoin quarterly returns: 2013–2026 की पूरी तिमाही तालिका
- क्रिप्टो लीवरेज रडार: फंडिंग, OI, लिक्विडेशन AI सिग्नल गाइड
संदर्भ
- Farside Investors — स्पॉट बिटकॉइन ETF के दैनिक फ्लो डेटा
- Federal Reserve — FOMC बैठक कैलेंडर
- iShares Bitcoin Trust (IBIT)
- Fidelity Wise Origin Bitcoin Fund (FBTC)
- CoinGecko — बिटकॉइन मूल्य और बाजार डेटा
- Investopedia — शॉर्ट कवरिंग की व्याख्या
यह शोध केवल सूचना के उद्देश्यों के लिए प्रदान किया गया है और यह निवेश सलाह का गठन नहीं करता है।