
 By Marcus Reeve
Ethereum Price History by Year: Year-End Prices and Annual Returns Since 2015
Updated October 2026. Data through the October 15, 2026 close (UTC). The 2026 row will be finalized after the December 31, 2026 close.
Short answer: Ether (ETH) ended 2025 at $2,968, down 10.9% for the year. It rose in 6 of the 10 full calendar years from 2016 to 2025, with a median annual return of +68.4%; from the end of 2017 it compounded at 18.9% a year. Best year: 2017, +9,034%. Worst: 2018, −82.4%. 2026 through October 15: −17.8%, at $2,439. Record close: $4,831 on August 22, 2025.
This page lists the Ethereum price by year for every year since the network went live on July 30, 2015, plus 2026 to date: the year-end price, the calendar-year return, the highest and lowest daily close, and the largest decline inside each year. Every year-end price was checked against at least two independent data sources. It also compares Ether with Bitcoin year by year, lists every decline of 50% or more from a record close, and ranks the best and worst years. The Bitcoin figures come from our Bitcoin returns by year table, which uses the same conventions.
Ethereum historical returns at a glance
| Measure (calendar-year price return) | 2016–2025 | 2018–2025 | 2020–2025 | 2022–2025 |
|---|---|---|---|---|
| Years | 10 | 8 | 6 | 4 |
| Up years | 6 (60%) | 4 (50%) | 4 (67%) | 2 (50%) |
| Median annual return | +68.4% | +22.2% | +68.4% | +17.6% |
| Compound annual growth | +124% | +18.9% | +68.8% | −5.3% |
| Best year | +9,034% (2017) | +475% (2020) | +475% (2020) | +90.7% (2023) |
| Worst year | −82.4% (2018) | −82.4% (2018) | −67.6% (2022) | −67.6% (2022) |
The 2015 starting price was so low that the compound rate from it means little: from $0.95 at the end of 2015 to $2,968 at the end of 2025, Ether compounded at 124% a year. The arithmetic average of the ten yearly returns is even more distorted, at +1,064%, almost all of it from 2017 (+9,034%). The median and the compound rate from later start dates describe the record better. From the end of 2017 ($742.26), after that year's rally, Ether compounded at 18.9% a year; from the end of 2021 ($3,687), it lost 5.3% a year.
Ethereum price by year: the complete table, 2015–2026
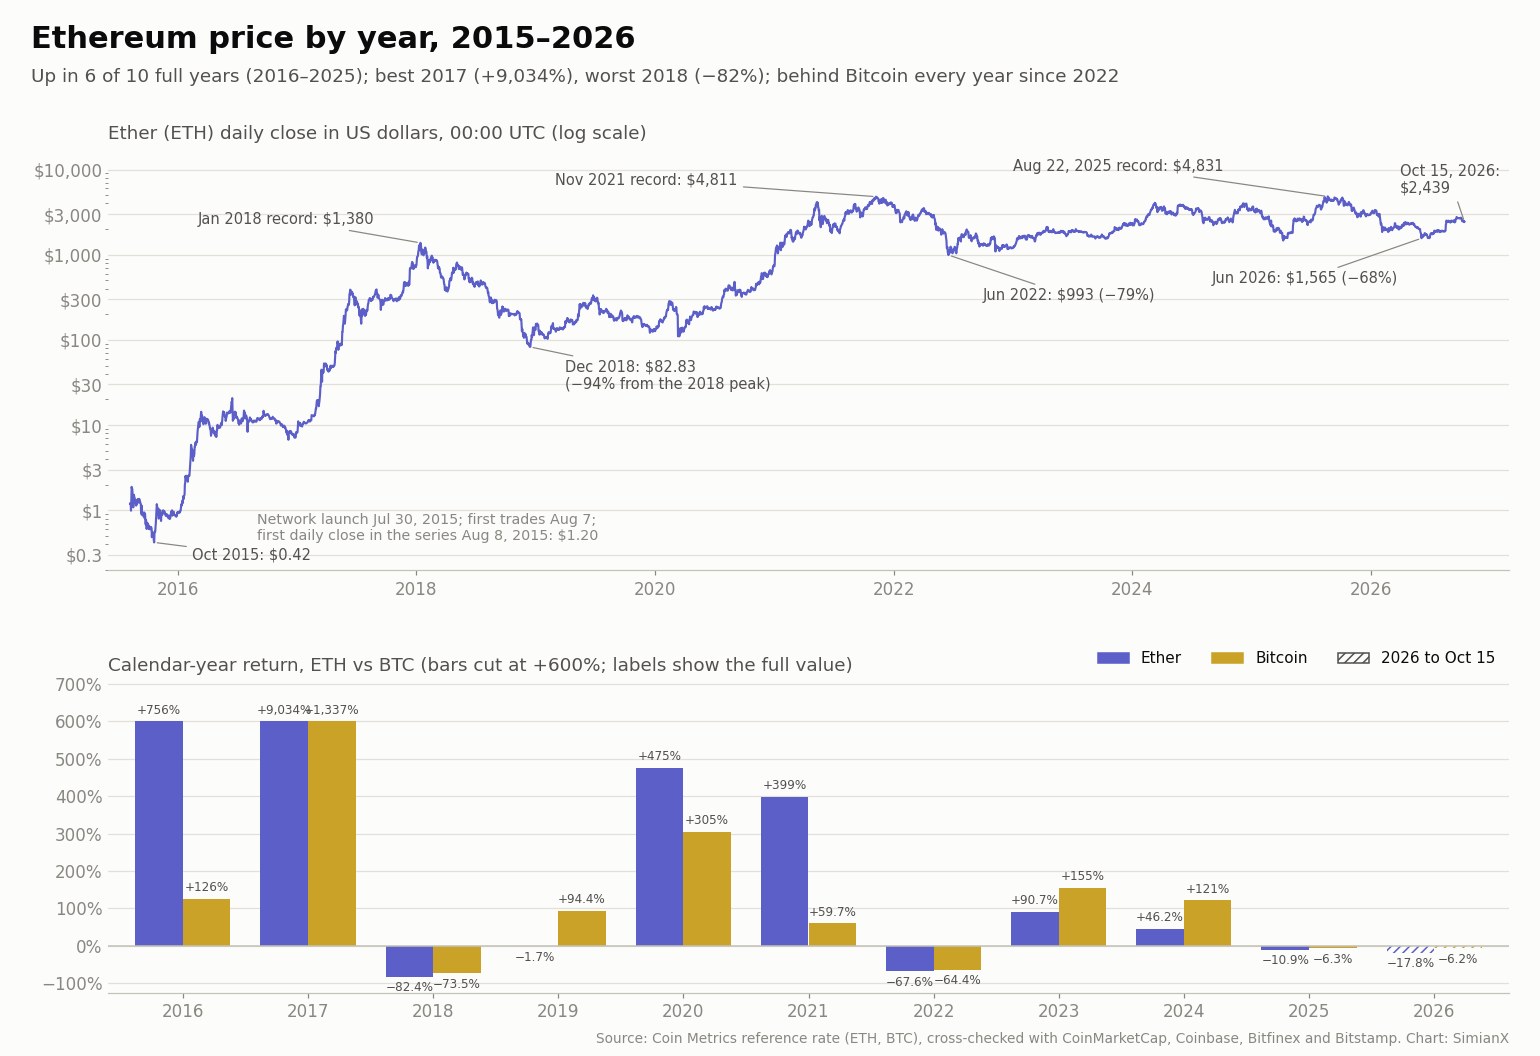
Newest first. Down years are in bold. Prices are in U.S. dollars at the end of each UTC day; "largest decline within the year" is the deepest fall from a high close to a later low close inside the calendar year, starting from the previous year-end price.
| Year | Year-end price | Calendar-year return | Highest close | Lowest close | Largest decline within the year |
|---|---|---|---|---|---|
| 2026 (to Oct 15) | $2,439 | −17.8% | $3,356 | $1,565 | −53.4% |
| 2025 | $2,968 | −10.9% | $4,831 | $1,471 | −60.1% |
| 2024 | $3,332 | +46.2% | $4,073 | $2,207 | −45.5% |
| 2023 | $2,279 | +90.7% | $2,379 | $1,200 | −27.4% |
| 2022 | $1,195 | −67.6% | $3,832 | $992.79 | −74.1% |
| 2021 | $3,687 | +399% | $4,811 | $730.91 | −57.0% |
| 2020 | $739.03 | +475% | $751.21 | $110.33 | −61.3% |
| 2019 | $128.51 | −1.7% | $334.04 | $103.30 | −63.6% |
| 2018 | $130.79 | −82.4% | $1,380 | $82.83 | −94.0% |
| 2017 | $742.26 | +9,034% | $823.85 | $8.18 | −60.1% |
| 2016 | $8.13 | +756% | $20.73 | $0.92 | −67.5% |
| 2015 (from Aug 8) | $0.95 | −20.9% | $1.88 | $0.42 | −77.7% |
Notes: Year-end prices are the Coin Metrics reference rate at the end of each UTC day, cross-checked with CoinMarketCap daily closes, Coinbase (from May 2016), Bitfinex (from March 2016) and Bitstamp (from August 2017). From 2019 on, every year-end price agrees within 0.9% in all sources, and from 2020 within 0.5%; every return from 2021 to 2026 agrees within 1 point, and from 2018 to 2020 within 6 points (2020: +475% here, +469% on CoinMarketCap). The sources differ more in the early years, when the price was tiny and trading thin: CoinMarketCap's year-end prices are 1.6% to 2.0% away from Coin Metrics in 2015–2018 (Bitfinex 4.0% in 2018), and on its closes 2016 returns +754% and 2017 +9,396%, against +8,984% on Coinbase and +9,107% on Bitfinex. 2015 is a partial year. The network launched on July 30, 2015, but the first exchange trades came on August 7 (Kraken); Coin Metrics' daily series starts on August 8 at $1.20, so the 2015 row runs from August 8 to December 31. CoinMarketCap's first close, $2.77 on August 7 on a handful of trades, would make 2015 a 66% loss instead. Kraken's last 2015 trade, at $0.949, matches the $0.95 year-end price. Ether was first sold in a 42-day presale for bitcoin starting July 22, 2014, before any exchange quoted it.
Ethereum vs. Bitcoin by year
| Year | Ether (ETH) | Bitcoin (BTC) | Difference (points) | ETH/BTC at year-end | Better of the two |
|---|---|---|---|---|---|
| 2026 (to Oct 15) | −17.8% | −6.2% | −11.6 | 0.0297 | BTC |
| 2025 | −10.9% | −6.3% | −4.6 | 0.0339 | BTC |
| 2024 | +46.2% | +121% | −75.0 | 0.0357 | BTC |
| 2023 | +90.7% | +155% | −64.8 | 0.0540 | BTC |
| 2022 | −67.6% | −64.4% | −3.2 | 0.0723 | BTC |
| 2021 | +399% | +59.7% | +339 | 0.0795 | ETH |
| 2020 | +475% | +305% | +170 | 0.0255 | ETH |
| 2019 | −1.7% | +94.4% | −96.1 | 0.0179 | BTC |
| 2018 | −82.4% | −73.5% | −8.9 | 0.0355 | BTC |
| 2017 | +9,034% | +1,337% | +7,697 | 0.0533 | ETH |
| 2016 | +756% | +126% | +631 | 0.0084 | ETH |
| 2015 (from Aug 8) | −20.9% | +64.3% | −85.3 | 0.0022 | BTC |
| 2016–2025 (10 years) | Ether | Bitcoin | S&P 500 |
|---|---|---|---|
| Up years | 6 | 7 | 8 |
| Median annual return | +68.4% | +108% | +17.9% |
| Compound annual growth | +124% | +70.2% | +12.8% |
| Best year | +9,034% (2017) | +1,337% (2017) | +28.9% (2019) |
| Worst year | −82.4% (2018) | −73.5% (2018) | −19.4% (2022) |
| $100 at the end of 2015 grew to | $312,816 | $20,368 | $335 |
| $100 at the end of 2017 grew to | $400 | $629 | $256 |
Ether beat Bitcoin in 4 of the 10 full years from 2016 to 2025 — 2016, 2017, 2020 and 2021 — and trailed it in the other six, including every year since 2022 and 2026 so far. When both fell, Ether fell further: 2018 (−82.4% vs. −73.5%), 2022 (−67.6% vs. −64.4%) and 2025 (−10.9% vs. −6.3%). In 2019 Bitcoin gained 94.4% while Ether slipped 1.7%. The ETH/BTC column shows the same story as a price: one ether bought 0.0084 bitcoin at the end of 2016, 0.0795 at the end of 2021 (the highest year-end) and 0.0297 on October 15, 2026. The full history of that ratio, with every cycle turn, is in our ETH/BTC ratio history.
The start date decides which asset looks better. From the end of 2015, $100 in Ether grew to $312,816 by the end of 2025, against $20,368 in Bitcoin and $335 in the S&P 500 (price return, from our S&P 500 returns by year table). From the end of 2017, $100 grew to $400 in Ether, $629 in Bitcoin and $256 in the S&P 500: 18.9% a year for Ether, 25.8% for Bitcoin and 12.5% for the S&P 500.
Ether has no halving of its own, but its big years have lined up with Bitcoin's four-year cycle. In the halving years 2016, 2020 and 2024 it rose 756%, 475% and 46.2%; in the years after a halving, 2017, 2021 and 2025, it returned +9,034%, +399% and −10.9%; and in the second years after a halving, 2018 and 2022, it lost 82.4% and 67.6%. 2026 is the next such year, and Ether was down 17.8% on October 15, against −72.4% and −65.4% on the same date in 2018 and 2022. Bitcoin's halving dates and cycle peaks are in our halving cycles reference.
Every Ethereum decline of 50% or more from a record
| Record close (peak) | Lowest close after it | Decline | Days to the low | Next record close | Peak to next record |
|---|---|---|---|---|---|
| August 13, 2015: $1.88 | October 21, 2015: $0.42 | −77.7% | 69 | January 23, 2016 | 163 days |
| June 16, 2016: $20.73 | December 5, 2016: $6.73 | −67.5% | 172 | March 11, 2017 | 268 days |
| June 12, 2017: $389.19 | July 16, 2017: $155.12 | −60.1% | 34 | September 1, 2017 | 81 days |
| January 13, 2018: $1,380 | December 15, 2018: $82.83 | −94.0% | 336 | January 19, 2021 | 3.0 years |
| May 11, 2021: $4,156 | July 20, 2021: $1,785 | −57.0% | 70 | October 23, 2021 | 165 days |
| November 8, 2021: $4,811 | June 18, 2022: $992.79 | −79.4% | 222 | August 22, 2025 | 3.8 years |
| August 22, 2025: $4,831 | June 6, 2026: $1,565 | −67.6% | 288 | not yet (−49.5% on October 15, 2026) | — |
Ether has fallen at least 50% from a record close seven times. The three cycle peaks — January 2018, November 2021 and August 2025 — were followed by declines of 94.0%, 79.4% and 67.6% so far. After the 2018 peak it took three years, until January 19, 2021, to close at a new record; after November 2021 it took 3.8 years, until August 22, 2025, when the close of $4,831 passed the $4,811 of November 8, 2021 by less than half a percent. On October 15, 2026 Ether stood 49.5% below that record. The decline is measured on daily closes; intraday the high was higher, above $4,950 on August 24, 2025 on CoinMarketCap, Coinbase and Bitfinex, when the close was lower than on August 22. Bitcoin's falls of 50% or more are listed in our Bitcoin crash history.
Ethereum's best and worst years
The best calendar years were 2017 (+9,034%), 2016 (+756%), 2020 (+475%) and 2021 (+399%). The worst were 2018 (−82.4%), 2022 (−67.6%), 2025 (−10.9%) and 2019 (−1.7%). Ether fell in 4 of its 10 full years, and unlike Bitcoin it has already had two down years in a row, 2018 and 2019. If 2026, down 17.8% through October 15, ends lower, 2025–2026 will be the second pair.
Every year contained a deep fall. The median largest decline inside a calendar year from 2016 to 2025 was 60.7%; 8 of the 10 years had a decline of more than 50%, and only 2023 (27.4%) and 2024 (45.5%) stayed below that. In 2017 Ether rose 9,034% but fell 60.1% between June 12 and July 16; in 2021 it gained 399% after a 57.0% fall between May 11 and July 20.
Protocol milestones fall inside the table but do not map neatly onto it. According to ethereum.org's list of upgrades, the DAO fork came on July 20, 2016, after a hack of a large contract; the London upgrade (EIP-1559 fee burning) on August 5, 2021; the Merge to proof of stake on September 15, 2022; Dencun on March 13, 2024; Pectra on May 7, 2025; and Fusaka on December 3, 2025. 2016, 2021 and 2024 were up years; 2022 and 2025 were down years.
2026 so far
Through October 15, 2026, Ether stood at $2,439, down 17.8% from its 2025 year-end price of $2,968. Its highest close of the year was $3,356 on January 14; its lowest, $1,565 on June 6, a decline of 53.4% inside the year (CoinMarketCap, Coinbase and Bitfinex put the low on June 25, within 0.3%). Over the same period Bitcoin lost 6.2% and the S&P 500 gained 13.1%. One ether bought 0.0297 bitcoin on October 15, against 0.0339 at the end of 2025. Live analysis of the current market is on the Ethereum page of the SimianX crypto leaderboard, and Market Pulse scores crypto-moving news as it breaks.
How to read Ethereum's historical returns
- The start date dominates the answer. From the end of 2015, Ether compounded at 124% a year; from the end of 2017, at 18.9%; from the end of 2021, at −5.3%. Quoting an Ethereum return without its period says little.
- Averages mislead more than medians. 2017 alone (+9,034%) lifts the ten-year arithmetic average above +1,000%.
- Year-end prices depend on the time and the source. Ether trades around the clock, so this page uses the price at the end of the UTC day; an exchange's own close can differ by a few percent, especially before 2019.
- Calendar years hide the path. Every full year had a decline of at least 27%, and most a decline of more than 50%.
- Returns are in nominal U.S. dollars. Inflation is not removed, and staking rewards are not included; this is the price return only.
Frequently asked questions
What was the price of Ethereum at the end of each year?
$0.95 (2015), $8.13 (2016), $742.26 (2017), $130.79 (2018), $128.51 (2019), $739.03 (2020), $3,687 (2021), $1,195 (2022), $2,279 (2023), $3,332 (2024) and $2,968 (2025). On October 15, 2026 it was $2,439.
What was Ethereum's price in 2015?
The first exchange trades came on August 7, 2015, a week after the network launched on July 30. The first daily close in the Coin Metrics series was $1.20 (August 8); the lowest close of the year was $0.42 on October 21, and the year ended at $0.95.
What was Ethereum's price in 2017?
It started the year at about $8 and ended it at $742.26, a gain of 9,034%. The highest close of 2017 was $823.85 on December 19; the record close of the cycle, $1,380, came on January 13, 2018.
What was Ethereum's best year?
2017, at +9,034%. The next best were 2016 (+756%), 2020 (+475%) and 2021 (+399%). Since 2022 the best year was 2023, at +90.7%.
What was Ethereum's worst year?
2018, at −82.4% (from $742.26 to $130.79). The other down years were 2022 (−67.6%), 2025 (−10.9%) and 2019 (−1.7%).
What is Ethereum's average annual return?
From 2016 to 2025 the median calendar-year return was +68.4%. The compound rate depends heavily on the start: 18.9% a year from the end of 2017, −5.3% a year from the end of 2021. The arithmetic average (+1,064%) is distorted by 2017.
Has Ethereum beaten Bitcoin?
In 4 of 10 full years (2016, 2017, 2020, 2021). From the end of 2015, Ether gained far more, because it started from $0.95; from the end of 2017, Bitcoin did better ($100 grew to $629 vs. $400). Ether has trailed Bitcoin every year since 2022.
What is Ethereum's highest price ever?
The record daily close is $4,831 on August 22, 2025, just above the $4,811 of November 8, 2021. The intraday high was above $4,950 on August 24, 2025.
Methodology and sources
- Ether prices are the Coin Metrics community reference rate in U.S. dollars at the end of each UTC day. Each year-end price was cross-checked against CoinMarketCap daily closes (the source Yahoo Finance displays, so Yahoo is not counted separately), Coinbase daily candles (from May 2016), Bitfinex daily candles (from March 2016), Bitstamp daily candles (from August 2017) and, for 2015, Kraken trade records. Disagreements are footnoted under the main table.
- Returns are calendar-year changes from the December 31 price of the previous year to the December 31 price of the year; 2015 runs from the first daily close (August 8, 2015). Highest and lowest closes and declines within the year use the same daily series. The decline table lists every fall of 50% or more from a record close before the next record.
- Bitcoin returns are from our Bitcoin returns by year table (Coin Metrics, same conventions); for 2015 they are measured over the same August 8 to December 31 window. S&P 500 returns are price returns from our S&P 500 table (Yahoo Finance ^GSPC, cross-checked with CNBC .SPX).
- Upgrade dates are from ethereum.org.
- Data compiled October 17, 2026. This page is for information only and is not investment advice.
Related Reading
- Bitcoin Returns by Year: Every Year 2011–2026 Table
- ETH/BTC Ratio History: Every Cycle and Signal, 2016-2026
- Bitcoin Halving Cycles: Complete Returns Reference 2012-2028
- Altcoin Season History: Bitcoin Dominance Cycles 2017-2026
- Every Bitcoin Crash Over 50%: Recovery Times Since 2011
- S&P 500 Returns by Year: Every Year 1928–2026 Table
- Crypto cycles: all SimianX reference pages
References
- Coin Metrics — Community network data (ETH PriceUSD)
- CoinMarketCap — Ethereum historical data
- Coinbase — Ethereum price
- Bitfinex — ETH/USD
- Bitstamp — ETH/USD market
- Kraken — Ethereum price
- ethereum.org — The history of Ethereum's forks and upgrades
- Ethereum whitepaper (ethereum.org)
- Wikipedia — Ethereum
- Wikipedia — The DAO