JPMorgan Stock 2026: 23% ROTCE vs a 3.2x Book Premium

JPMorgan Stock 2026: 23% ROTCE vs a 3.2x Book Premium

JPMorgan earned $16.9B in Q2 2026 once one-off gains come out: 23% ROTCE, 14.1% CET1 and a 3.17x tangible-book price at $359. What that actually buys.

2026-08-05
·
17 min read
Market Pulse
Listen to article

What JPMorgan's Record Quarter Is Actually Worth at $359 a Share

JPMorgan Chase (NYSE: JPM) entered the second half of 2026 with record business-line revenue, resilient credit, a powerful capital position, and renewed momentum in trading and investment banking. Yet the stock already reflects much of that strength. The whole question is therefore a debate about quality versus price: investors need to separate recurring earnings from one-time gains, and then decide how much of JPMorgan's premium profitability can persist.

This research uses disclosures available through August 5, 2026. SimianX AI can complement that work by monitoring filings, market data, and changing risk signals, but neither this article nor the platform is personalized financial advice.

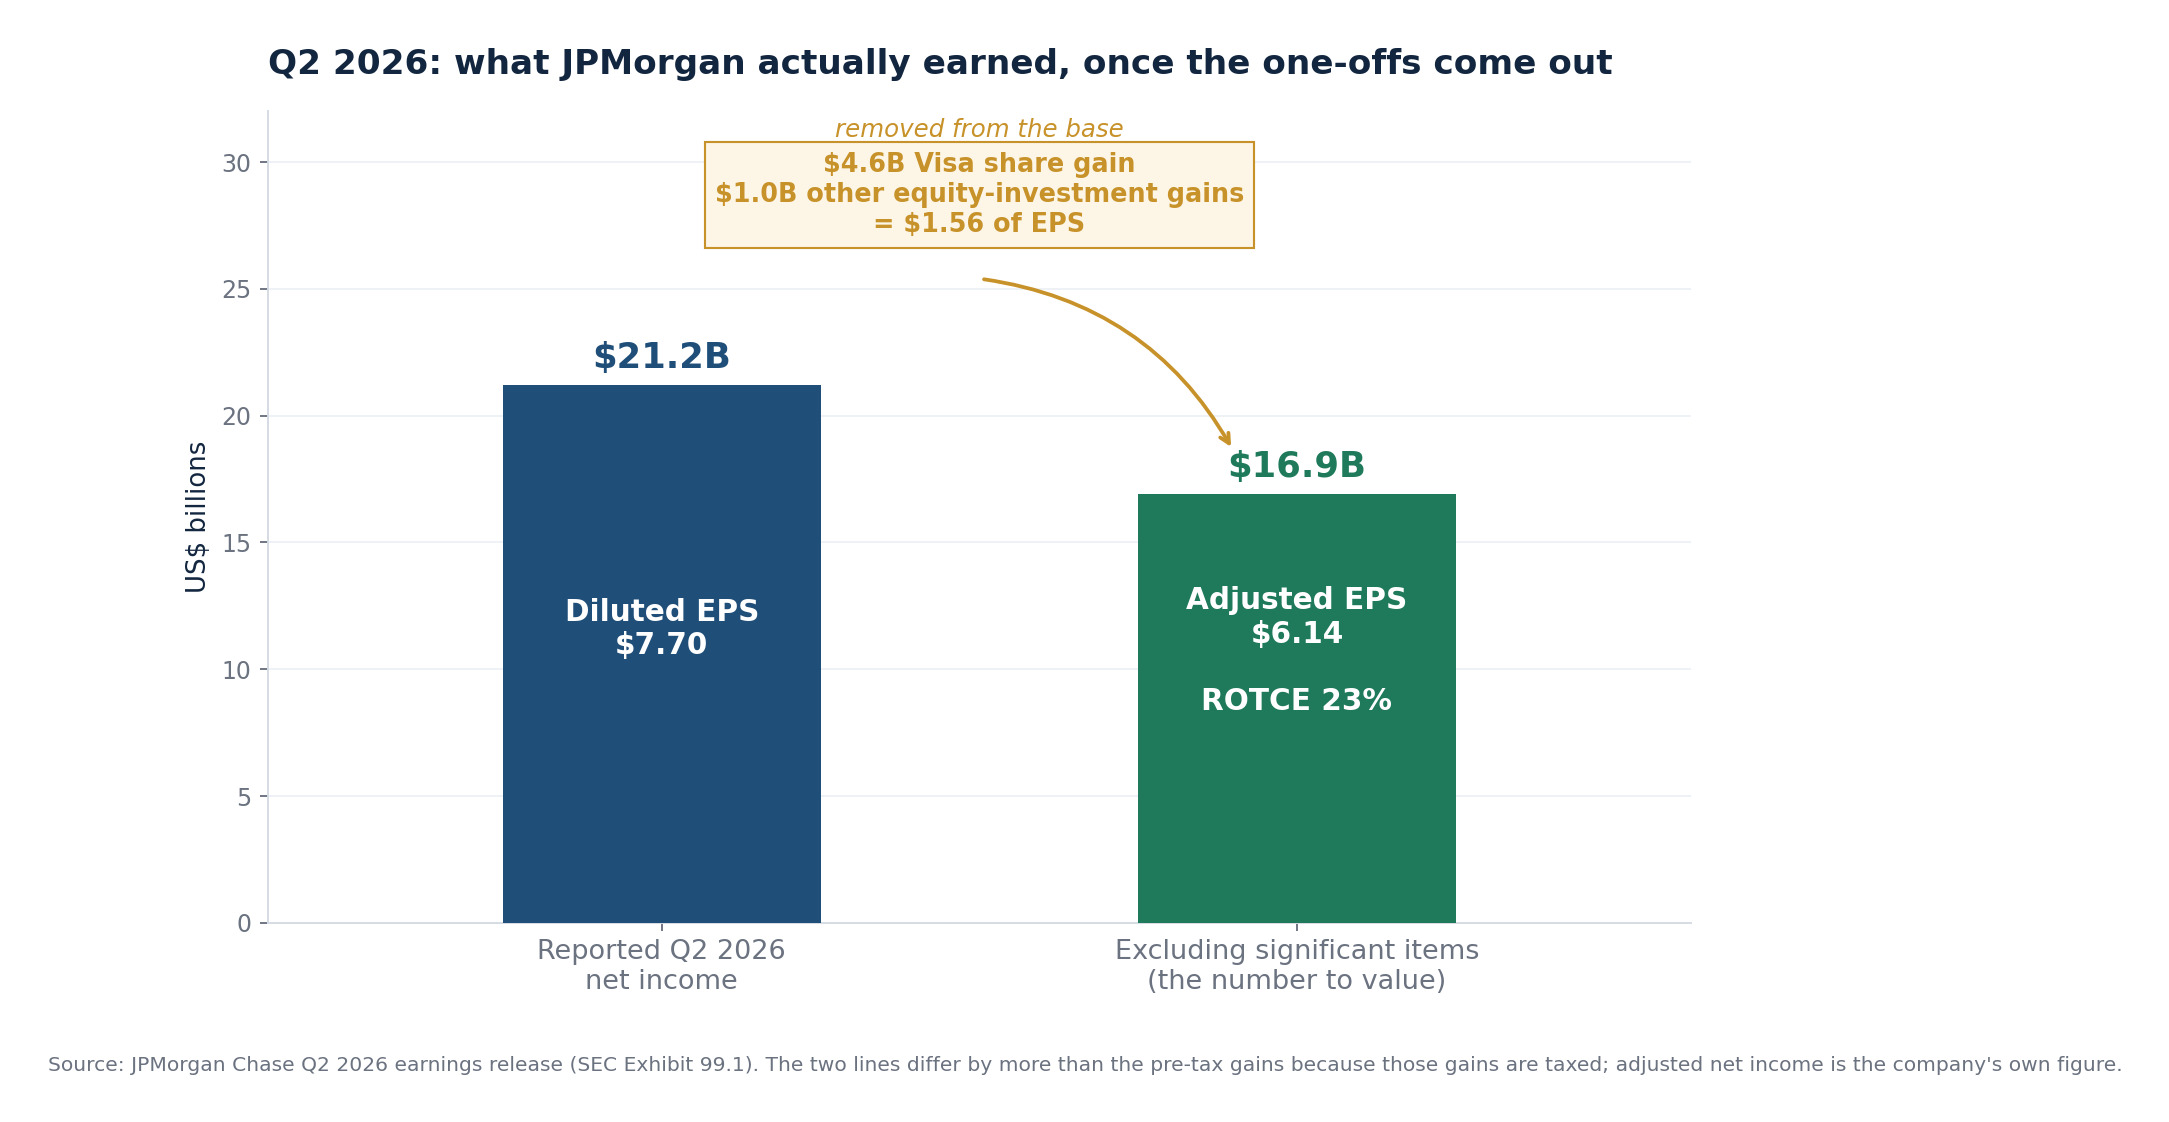
SimianX AI JPMorgan Q2 2026 reported net income of $21.2 billion beside adjusted net income of $16.9 billion, with the $4.6 billion Visa share gain and $1.0 billion of other equity-investment gains removed
JPMorgan Q2 2026 reported net income of $21.2 billion beside adjusted net income of $16.9 billion, with the $4.6 billion Visa share gain and $1.0 billion of other equity-investment gains removed

JPMorgan Stock 2026 at a Glance

The headline numbers are formidable. JPMorgan reported second-quarter net income of $21.2 billion and diluted EPS of $7.70. However, a $4.6 billion gain related to Visa shares and $1.0 billion of gains on other equity investments added $1.56 to EPS. Excluding those significant items, net income was $16.9 billion, EPS was $6.14, and return on tangible common equity, or ROTCE, was 23%. That adjusted result is the better starting point for valuation. See the official Q2 2026 SEC earnings release, filed alongside the rest of the bank's quarterly earnings materials.

Q2 2026 metricReported resultWhat it means for investors
Managed revenue$58.0BUp 27% YoY; up 15% excluding significant items
Net interest income$25.6BUp 10% YoY despite lower-rate pressure
Adjusted EPS$6.14Better measure of recurring quarterly earning power
Adjusted ROTCE23%Still materially above a typical large-bank cost of equity
CET1 ratio14.1%Strong capital buffer versus an 11.5% requirement
Tangible book value per share$113.35Up 10% YoY, supporting intrinsic-value growth
Card net charge-off rate3.34%Stable enough to support the base case, but worth monitoring

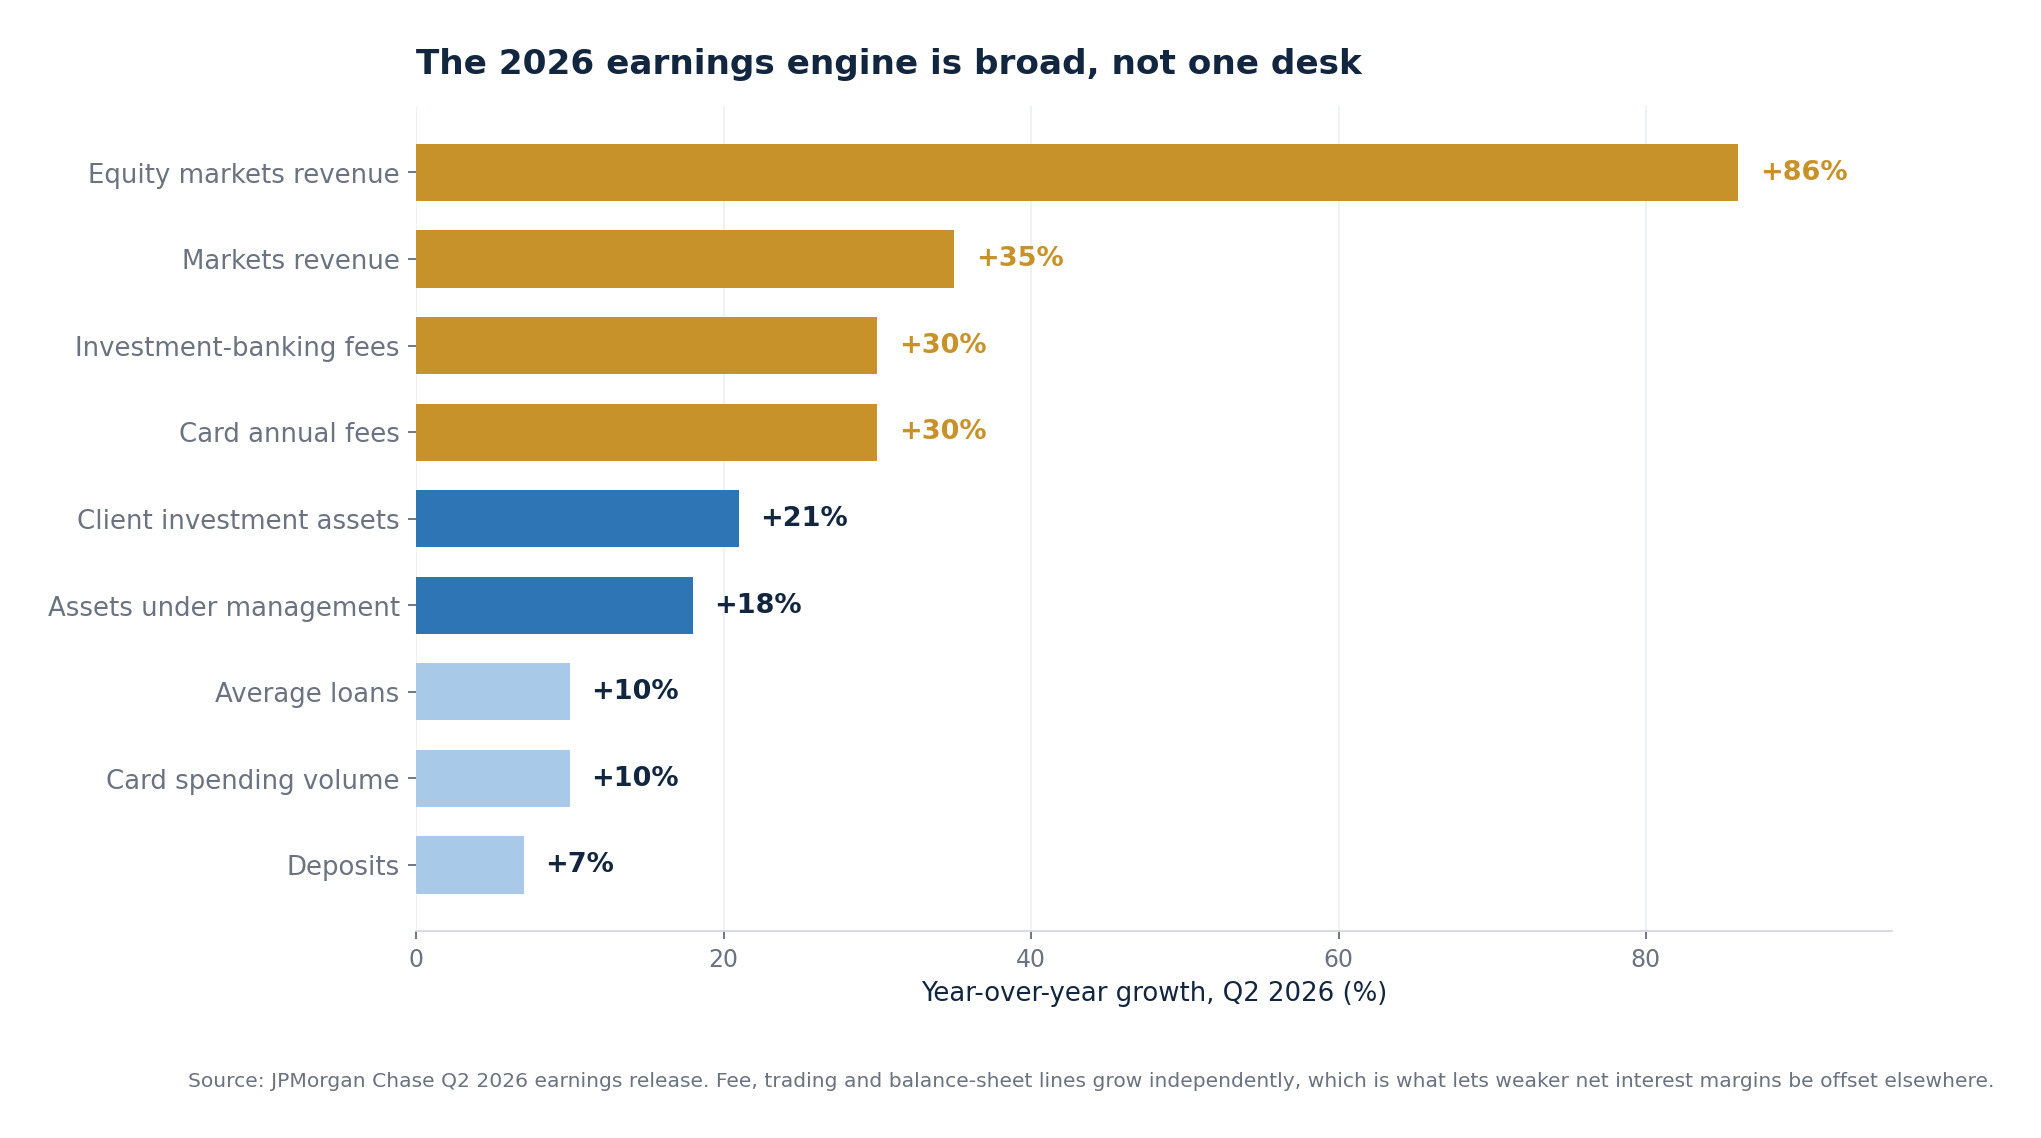
The operating engine was broad rather than dependent on one desk. Average loans rose 10% year over year, average deposits rose 7%, card spending volume increased 10%, investment-banking fees advanced 30%, Markets revenue grew 35%, and assets under management reached $5.1 trillion, up 18%. This diversification matters because weaker net interest margins can be offset by fees, trading, investment banking, payments, and asset management.

Key insight: JPMorgan's 2026 earnings story is not simply "higher rates equal more profit." It is increasingly a market-share, fee-income, balance-sheet-growth, and capital-deployment story.

What Is Driving JPMorgan Earnings Growth in 2026?

1. Net interest income remains a durable foundation

Management raised its full-year outlook for net interest income excluding Markets to approximately $96.5 billion, while total NII was expected to be about $105.5 billion. Higher deposit balances and loan growth are helping counter the margin pressure created when benchmark rates fall. The Q2 release showed NII excluding Markets of $23.7 billion, up 4%, as deposit growth, card revolving balances, and wholesale loans outweighed most of the rate headwind.

Investors should track both the level and the composition of NII. Deposit growth is encouraging, but aggressively priced deposits can increase funding costs. Similarly, card loan growth can lift revenue while increasing future credit losses. A high-quality NII beat is one driven by durable customer balances and sensible loan growth—not a temporary asset-liability positioning benefit.

Because that line moves with the policy rate, it is worth knowing the historical base rates rather than guessing. Our reference tables on every Fed rate-cut cycle since 1980 and every hiking cycle since 1983 show how long each regime actually lasted, and Warsh's first Fed meeting is where the current hawkish turn first became visible in the dot plot.

2. Capital markets have reaccelerated

Corporate & Investment Bank momentum was exceptional in Q2. Investment-banking fees grew 30% year over year, while Markets revenue climbed 35%; equity-markets revenue alone rose 86%. JPMorgan also retained the top global investment-banking fee ranking with 9.3% year-to-date wallet share.

This is a meaningful earnings catalyst, but it is also cyclical. Elevated volatility and client activity can benefit trading, while constructive markets can reopen underwriting and merger pipelines. Neither condition should be annualized mechanically. A prudent model assumes some normalization rather than treating Q2's record environment as the new quarterly floor.

SimianX AI Year-over-year growth in JPMorgan's Q2 2026 business lines, led by equity markets revenue up 86 percent, Markets revenue up 35 percent and investment-banking fees up 30 percent, down to deposits up 7 percent
Year-over-year growth in JPMorgan's Q2 2026 business lines, led by equity markets revenue up 86 percent, Markets revenue up 35 percent and investment-banking fees up 30 percent, down to deposits up 7 percent

3. Consumer and wealth franchises keep compounding

Consumer & Community Banking produced a 34% ROE in Q2. Active mobile customers grew 6%, client investment assets rose 21%, and annual card fees increased more than 30% after product refreshes. Meanwhile, Asset & Wealth Management generated a 48% ROE, with $50 billion of long-term net inflows helping push AUM above $5 trillion.

These franchises add recurring fee income and deepen customer relationships. They also create operating leverage when markets rise. The offset is expense growth: firmwide noninterest expense rose 15% year over year in Q2, and management raised its full-year adjusted expense expectation to roughly $107.5 billion. Higher compensation tied to strong revenue is economically different from uncontrolled fixed-cost inflation, but shareholders still need evidence that revenue grows faster than costs through a full cycle.

Deposits are also no longer a captive franchise. Regulated dollar tokens now compete for the same idle balances, a shift we track in Stablecoins 2026: Visa, Stripe and the USDT vs USDC race and in the policy debate heading into Jackson Hole 2026. Deposit beta is a competitive variable now, not only a rate variable.

4. Buybacks reduce the share count—but price matters

JPMorgan repurchased a net $6.2 billion of common stock in Q2. In June, the board authorized a new $50 billion repurchase program effective July 1 and announced its intention to increase the quarterly dividend from $1.50 to $1.65 per share. The company's capital-return announcement also confirmed that its 2.5% stress capital buffer remains unchanged through September 2027.

Buybacks create the most value when shares trade below conservative intrinsic value. At more than three times tangible book, each repurchase deserves scrutiny. Management itself has emphasized discipline when bank-stock valuations are full.

Is JPMorgan Stock Overvalued in 2026?

The valuation is reasonable on earnings but demanding on book value. An S&P Global-based consensus snapshot dated August 3 estimated 2026 adjusted EPS of $24.07, up 22% from 2025, and revenue of about $208.5 billion, up 14.3%. At a reference share price near $359, those figures imply approximately:

  • 14.9x 2026 adjusted earnings;
  • 3.17x Q2 tangible book value of $113.35 per share;
  • 2.70x book value of $133.01 per share;
  • roughly a 1.8% forward dividend yield using a $1.65 quarterly run rate.

The consensus data and analyst range are available in this JPM stock forecast summary. Its 23-analyst average target was $372.65, with a $305 low and $420 high—only about 4% above the reference market price. Price targets are not intrinsic values, but the narrow average upside shows that expectations were already high.

The re-rating has already happened

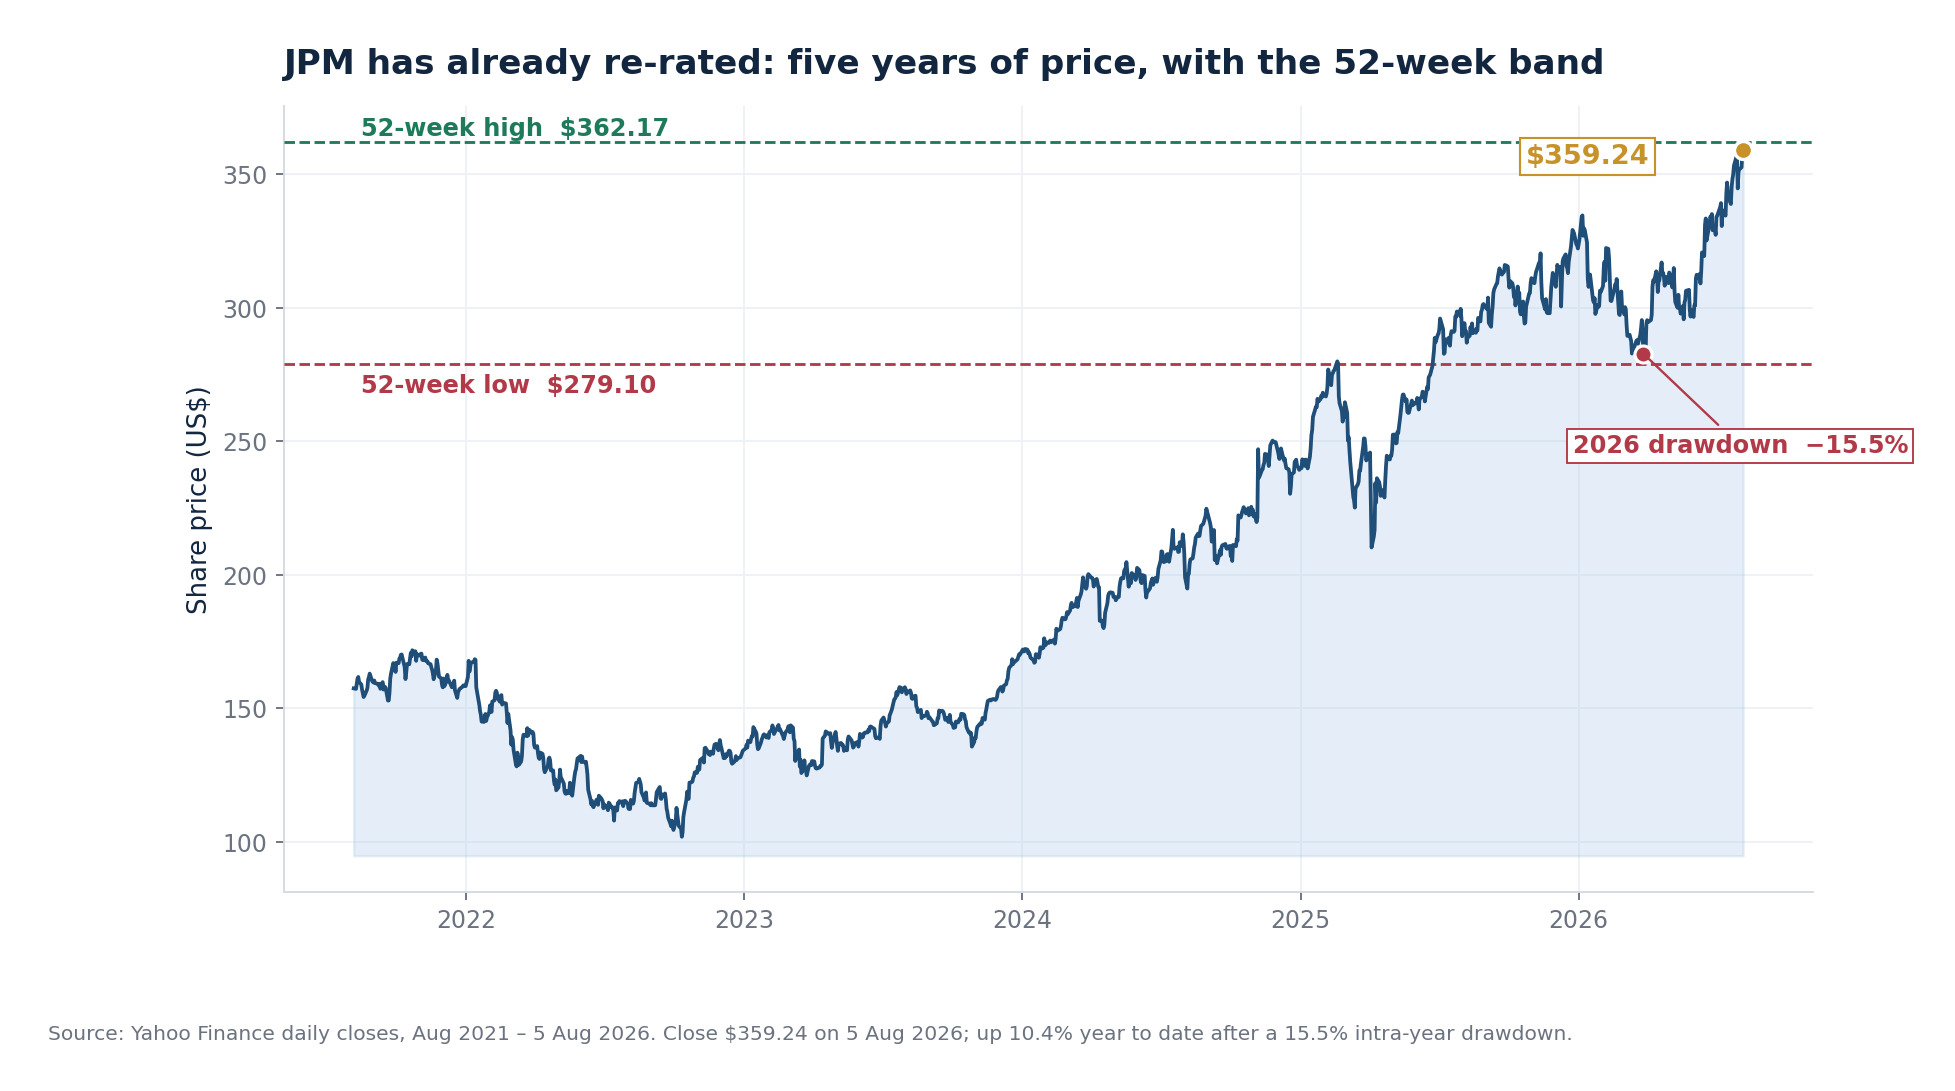
It is worth being precise about where the stock actually is, because the multiple debate only makes sense against the tape. JPM closed at **$359.24** on August 5, 2026, inside a 52-week range of $279.10 to $362.17 — roughly 1% below its 52-week high and 29% above its 52-week low. The shares are up 10.4% year to date, and that gain came after a 15.5% intra-year drawdown, a reminder that a fortress balance sheet does not produce a straight line.

SimianX AI JPMorgan share price from August 2021 to August 2026, closing at $359.24 with the 52-week high of $362.17 and low of $279.10 marked, plus the 15.5 percent drawdown inside 2026
JPMorgan share price from August 2021 to August 2026, closing at $359.24 with the 52-week high of $362.17 and low of $279.10 marked, plus the 15.5 percent drawdown inside 2026

Over five years the move is larger than most bank investors remember: JPM closed at $101.96 on October 11, 2022, so the stock is up roughly 3.5x from that low. Most of that is genuine per-share earnings and tangible-book growth — but part of it is multiple expansion, and multiple expansion is the part that can be taken back without the business doing anything wrong.

For banks, price-to-tangible-book should be interpreted alongside sustainable ROTCE. A bank capable of generating a low-20s ROTCE deserves a major premium to tangible book. The problem is duration: if normalized ROTCE settles closer to the mid-teens as trading cools, rates fall, credit costs rise, or expenses persist, the justified premium can contract even while JPMorgan remains an excellent institution. That distinction — great business, demanding price — is the same one we worked through for Nvidia's boom and, at market level, in every tech bubble since 1929.

A great bank is not automatically a great stock at every price. The investment return depends on future per-share earnings growth plus dividends, adjusted for any expansion or contraction in the valuation multiple.

JPM Stock Valuation 2026: Bear, Base and Bull Cases

Rather than rely on one target, investors can combine an adjusted EPS range with different P/E multiples. The following is an analytical framework, not a forecast or recommendation.

Scenario2026 adjusted EPSP/E assumptionImplied valueCore conditions
Bear$21.5012.5x$269Credit normalizes sharply, Markets cool, NII disappoints, premium compresses
Base$24.0715.0x$361Consensus earnings broadly hold and ROTCE stays near 20%+
Bull$25.0016.5x$413Strong fee cycle, benign credit, NII resilience, effective capital returns
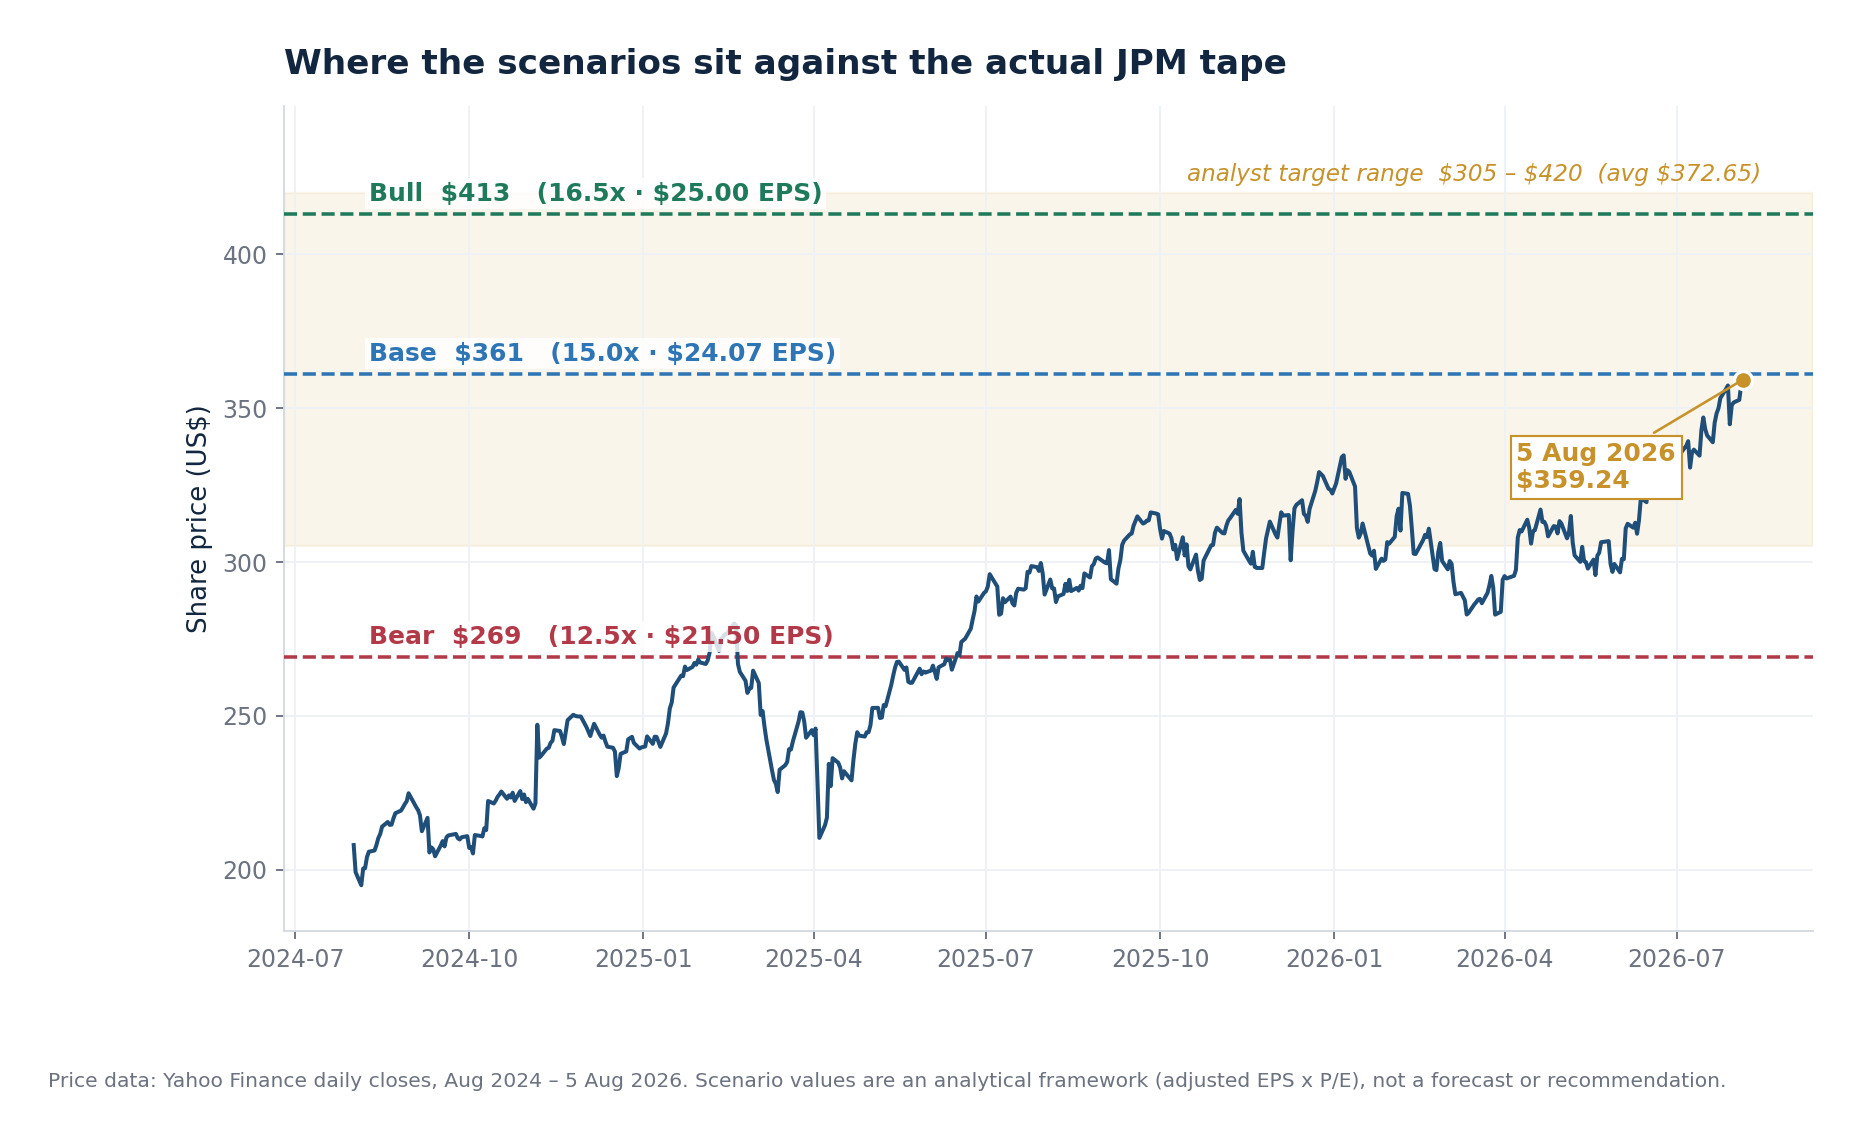
SimianX AI The bear, base and bull values of $269, $361 and $413 drawn across JPMorgan's actual daily share price from August 2024 to August 2026, with the $305 to $420 analyst target range shaded
The bear, base and bull values of $269, $361 and $413 drawn across JPMorgan's actual daily share price from August 2024 to August 2026, with the $305 to $420 analyst target range shaded

Laid over the real price series, the arithmetic is uncomfortable in a useful way. The base case sits within $2 of where the stock actually trades, meaning the market already discounts strong execution. The bull case requires both higher earnings and continued willingness to award JPM a premium multiple. And the bear case does not require a financial crisis: JPM last closed below $269 on June 13, 2025, barely fourteen months before this reference date, so a routine mix of earnings normalization and multiple compression can produce roughly 25% downside without anything breaking.

How should investors build their own JPMorgan stock valuation?

Use a repeatable five-step process:

  1. Normalize EPS. Remove gains such as the Q2 Visa and equity-investment items rather than annualizing GAAP EPS.
  2. Stress the revenue mix. Model NII, Markets, investment banking, card revenue, and asset-management fees separately.
  3. Model credit costs. Raise card and wholesale loss assumptions in the downside case before applying a multiple.
  4. Check capital and share count. Estimate how dividends, RWA growth, acquisitions, and repurchases affect CET1 and EPS.
  5. Triangulate valuation. Compare forward P/E, price-to-tangible-book, and a sustainable-ROTCE framework.

SimianX AI's fundamental-analysis workflow is relevant here because it structures SEC filings and cross-checks financial metrics across models. Investors can use that kind of process to update scenarios after each 10-Q instead of anchoring to a static annual target. The same discipline applied to a single ticker's earnings history is what makes our NVDA post-earnings reference table useful: it replaces "the stock usually pops" with a distribution you can actually check.

The Biggest Risks to JPMorgan Stock in 2026

Credit normalization and consumer stress

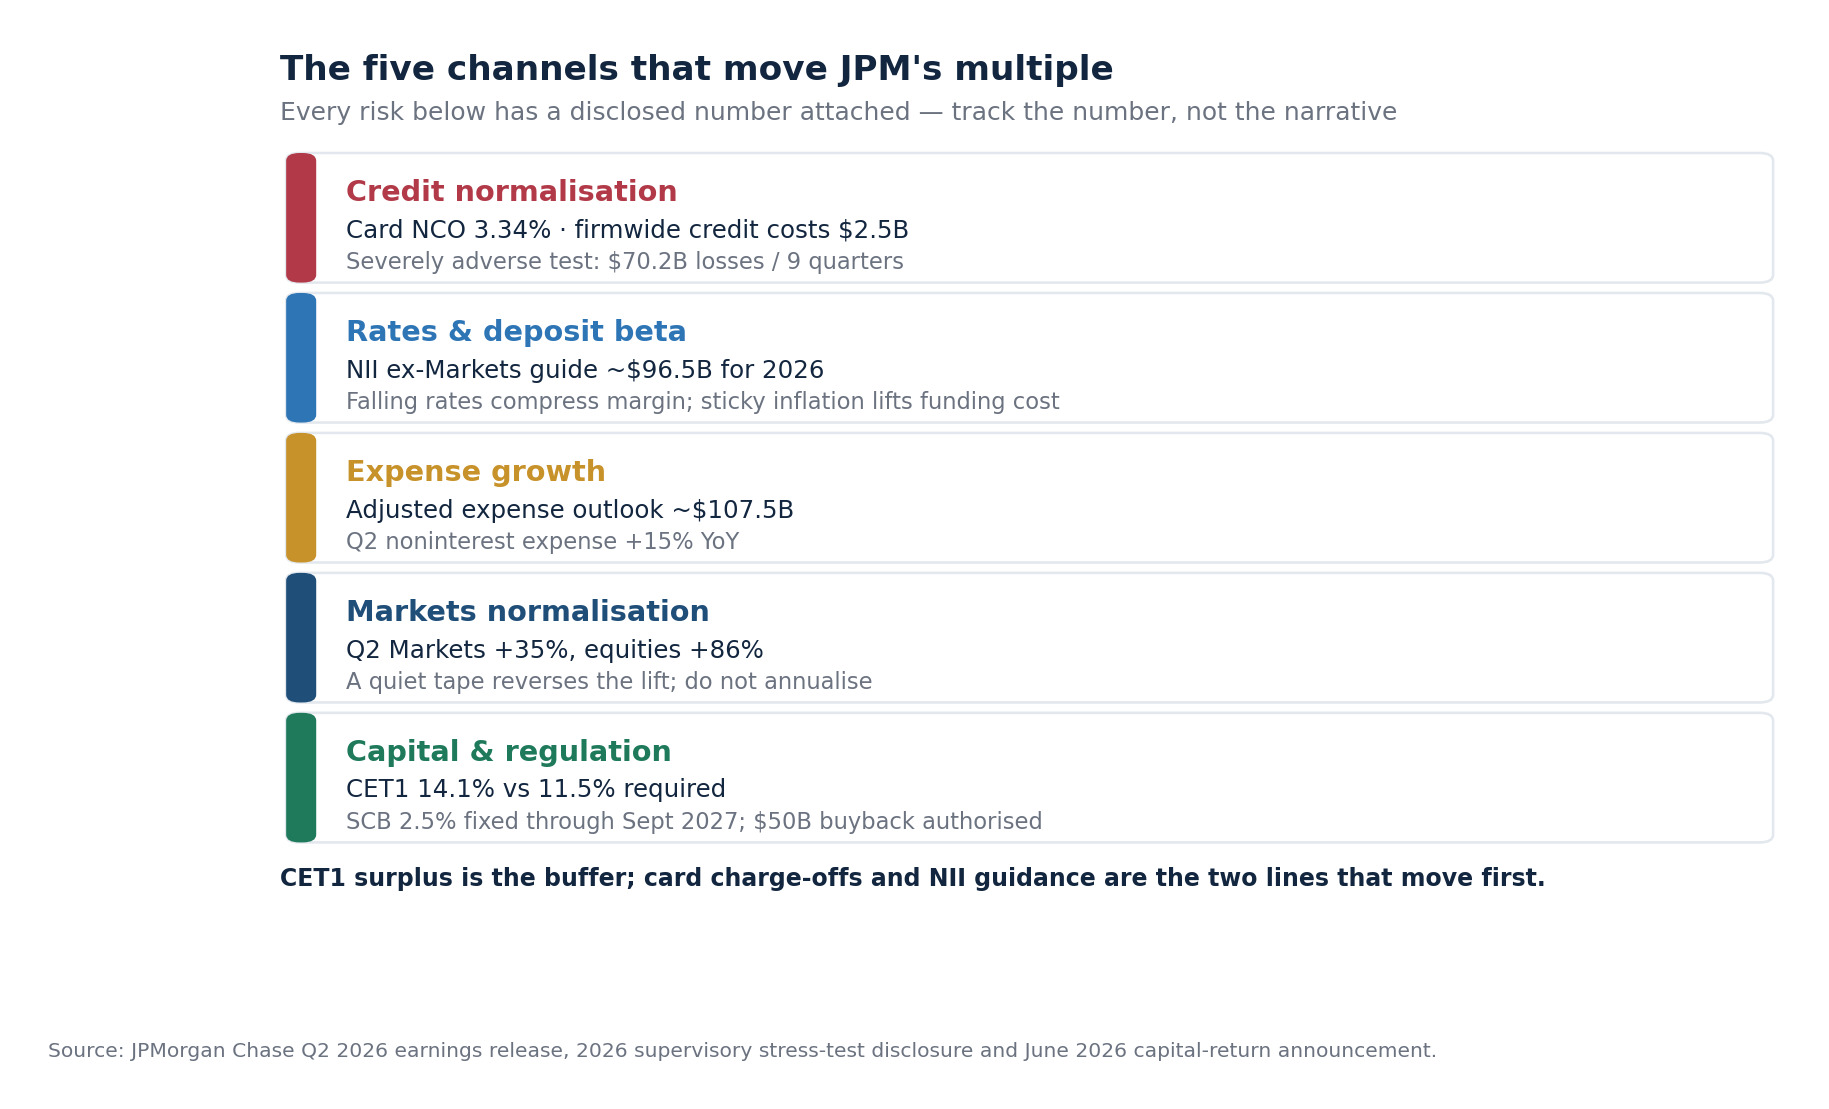
JPMorgan's Q2 Card Services net charge-off rate was 3.34%, slightly below 3.40% a year earlier, while firmwide credit costs were $2.5 billion. That is reassuring, not risk-free. Credit-card balances reprice quickly, and losses can rise if employment weakens. Commercial real estate, leveraged finance, and other wholesale exposures can also deteriorate nonlinearly. The early warning usually shows up in retail results before it shows up in a bank's charge-offs — which is why the signals in US consumer cracking in 2026 matter to a JPM thesis, and why yield-curve inversions and US recessions is the right base-rate table to keep open.

The bank's own 2026 supervisory severely adverse scenario illustrates the tail. It projected $70.2 billion of cumulative loan losses over nine quarters, including $27.1 billion in cards, while the minimum CET1 ratio remained 12.4%. The official stress-test disclosure, part of the Federal Reserve's Dodd-Frank stress-test program, supports the "fortress balance sheet" case—but a stress test demonstrates resilience, not immunity from earnings or share-price volatility.

Interest-rate and deposit-beta risk

Falling rates can compress deposit margins; sticky inflation can keep funding costs elevated and hurt borrowers. Either path can undermine a simplistic NII thesis. Watch average deposits, deposit margin, loan growth, and management's revised NII guidance together.

Expense growth and investment payback

Technology, bankers, branches, marketing, compensation, and the Apple Card portfolio may strengthen the franchise, but they lift the near-term cost base. The question is whether those investments deliver enough revenue and market share to preserve operating leverage. A sustained efficiency-ratio deterioration would challenge the premium valuation.

Markets normalization and elevated asset prices

Q2 benefited from unusually strong client activity. A quiet trading environment or weaker dealmaking could reverse that lift. Conversely, a sharp market decline would hurt investment-banking pipelines, AUM-linked fees, and credit simultaneously. CEO Jamie Dimon explicitly flagged geopolitical conflict, sticky inflation, large fiscal deficits, and elevated asset prices in the Q2 release. Index-level concentration is part of that picture too: as the Magnificent 7's 2026 weights show, a drawdown in a handful of mega-caps now transmits straight into the AUM and underwriting lines of every large bank.

Regulation, litigation, cyber, and succession

Capital requirements — anchored in the Basel III framework that defines CET1 — can change the amount available for buybacks. Compliance failures, litigation, fraud, model errors, and cyber incidents can produce direct losses and reputational damage. Leadership succession also matters: investors associate JPMorgan's risk culture closely with Dimon, so uncertainty around timing and continuity can affect the multiple even if operating performance remains intact.

SimianX AI Five risk channels for JPMorgan with the disclosed number attached to each: card charge-offs 3.34 percent, NII guidance $96.5 billion, adjusted expense $107.5 billion, Markets revenue up 35 percent, and CET1 of 14.1 percent against an 11.5 percent requirement
Five risk channels for JPMorgan with the disclosed number attached to each: card charge-offs 3.34 percent, NII guidance $96.5 billion, adjusted expense $107.5 billion, Markets revenue up 35 percent, and CET1 of 14.1 percent against an 11.5 percent requirement

What Should JPM Investors Monitor Next?

The strongest research process focuses on revisions, not headlines. Track these indicators every quarter:

  • adjusted EPS and adjusted ROTCE, excluding material one-time gains;
  • NII excluding Markets versus the $96.5 billion 2026 guide;
  • adjusted expense versus the roughly $107.5 billion outlook;
  • card charge-offs, delinquencies, reserve builds, and wholesale criticized loans;
  • deposit growth, deposit margin, and customer cash migration;
  • Markets and investment-banking revenue versus normalized levels;
  • tangible book value growth per share;
  • CET1 surplus over the 11.5% requirement;
  • repurchase price and the net reduction in diluted shares.

Bullish confirmation would be EPS upgrades driven by recurring revenue, stable credit, and continued tangible-book compounding. Bearish confirmation would be an NII downgrade, rising loss expectations, fixed-cost pressure, and buybacks that fail to offset slowing per-share growth.

FAQ About JPMorgan Stock 2026

Should I buy JPMorgan stock in 2026?

JPMorgan combines best-in-class profitability, scale, and capital resilience, but the reference valuation already assumes strong execution. Whether it fits depends on your required return, time horizon, diversification, and willingness to accept cyclical bank risk; consider staged buying or a valuation threshold rather than treating a quality franchise as price-insensitive.

What is JPMorgan's 2026 earnings growth forecast?

The August 3 consensus snapshot estimated adjusted EPS of $24.07, representing approximately 22% growth, with a range of $23.50 to $25.00. Forecasts can change quickly with rates, trading activity, credit costs, and management guidance.

Is JPM stock overvalued based on tangible book value?

At roughly 3.17x Q2 tangible book value, JPM trades at a substantial premium. A persistent 20%+ ROTCE can justify that premium, but the stock becomes vulnerable if profitability normalizes faster than investors expect.

What are the biggest risks to JPMorgan stock?

The primary risks are credit deterioration, deposit-margin compression, expense growth, weaker capital-markets activity, tougher regulation, cyber or legal events, and valuation compression. Several can occur together during an economic slowdown.

How much does JPMorgan pay in dividends in 2026?

The board announced its intention to raise the quarterly dividend to $1.65 per share for Q3 2026, subject to customary approval. That equals a $6.60 annualized run rate and an approximate 1.8% yield at a $359 reference price.

Where does JPM stock trade right now?

JPM closed at $359.24 on August 5, 2026, within a 52-week range of $279.10 to $362.17. The shares are listed on the New York Stock Exchange under the ticker JPM.

Conclusion

The conclusion is balanced rather than promotional. JPMorgan is producing exceptional adjusted returns, gaining share, growing tangible book value, and returning surplus capital. Its diversified franchise and strong stress-test performance make it one of the highest-quality large banks in the world.

But quality is well recognized. At $359.24, the shares trade within $2 of the base-case value and about 4% below the average analyst target. Upside requires durable low-20s ROTCE, recurring earnings beats, benign credit, and disciplined buybacks; downside can emerge from ordinary normalization rather than catastrophe.

Build a watchlist around NII, expenses, credit, capital, and per-share tangible-book growth, then update the valuation after every filing. If you want to follow those revisions without reading every filing yourself, our tooling is built for exactly that:

Treat every AI output as research input, not a substitute for judgment or professional advice.

Related Reading

References

Data cutoff: August 5, 2026. Price data from Yahoo Finance daily closes. All investments involve risk, and past performance does not guarantee future results.

Ready to Transform Your Trading?

Join thousands of investors using AI-powered analysis to make smarter investment decisions

Today's most analyzed — click to enter the Live Command Room