
 By Marcus Reeve
Every Semiconductor Bear Market Since 1995: The SOX Crash Reference Table
Updated October 2026. Data through October 15, 2026.
Short answer: Since 1995 the PHLX Semiconductor Index has had 13 declines of 20% or more. The median completed one fell about 38% over nine months. The 2026 episode fell 28.6% from its June 22 record to July 29 and was still 20.9% below that peak on October 15, 2026.
How deep do semiconductor bear markets go, and how long do they take to recover? With the PHLX Semiconductor Index (SOX) 28.6% below its June 22, 2026 record at the July 29 low, and still about 21% below it on October 15, the question is a current one. This page answers it with data: a complete reference table of every SOX drawdown of 20% or more since 1995 — thirteen episodes across three decades — with the depth, the primary trigger, the time to the bottom, and the time back to the prior peak for each one.
Three numbers frame everything that follows. The median semiconductor bear market since 1995 has cut the SOX by about 38%, and the average is closer to 44%. The median decline has taken roughly nine months from peak to trough. And the median wait from the bottom back to the old high has been around a year — but the distribution has a long tail: after the dot-com bust, the index needed roughly fifteen years to durably reclaim its March 2000 peak.
The SOX, launched by the Philadelphia Stock Exchange in December 1993 and now maintained by Nasdaq, tracks 30 of the largest U.S.-listed semiconductor companies — today dominated by NVIDIA, Broadcom, AMD, Taiwan Semiconductor's U.S. listing, Micron and Intel. Because chipmakers sit at the front of every technology capex cycle, the index is both a common momentum trade and one of the most volatile sector indexes. That is exactly why a clean historical baseline matters when the sector is falling.
The July 2026 Selloff, in Context
First, the episode that prompted this table. The SOX closed at a record 14,634.72 on June 22, 2026 after gaining more than 80% in the first half of the year — a pace of ascent the index had not sustained since 1999–2000, with trailing-12-month gains near 180% at the peak. Then, in under three weeks, the sector gave a fifth of it back. By July 10 the index had closed near 12,967, in official correction territory, and by July 17 it was trading around 20% below the peak, with the iShares Semiconductor ETF (SOXX) down more than 10% in that week alone and over $1 trillion in combined chip market value erased.
The proximate triggers stack up like a checklist from past cycles: a Bloomberg report that Meta plans to resell excess AI computing capacity, which crystallized the question of whether Big Tech has overbuilt AI infrastructure; the first big wave of custom AI accelerators from Amazon, OpenAI and others shipping against NVIDIA's near-monopoly; a disappointing Samsung quarter that reset memory expectations; and Taiwan Semiconductor raising its 2026 capex guidance to $60–64 billion, which the market read as more supply chasing less certain demand. Add an oil spike above $80 on the Iran conflict, and you get the AI momentum unwind that has dominated July's tape.
None of that tells you what happens next. History might. Here is every comparable episode since 1995.
Where the 2026 Decline Stands Now
Since this page was first published on July 17, 2026, the decline has deepened and then partly reversed. The SOX's lowest close so far was 10,447.49 on July 29, 2026, 28.6% below the June 22 record. The index recovered to 12,628.62 at the end of September, then fell to 11,581.22 on October 15, 2026 — 20.9% below the peak and 10.9% above the July low. Because it has not closed back above the June 22 record, the episode is still counted as an ongoing bear market. By month, the index fell 20.6% in July, rose 2.0% in August and 9.5% in September, and was down 8.3% in October through the 15th. The rise into the peak included a 38.4% gain in April 2026, the largest monthly increase since February 2000.
| Measure | 2026 episode (to Oct 15) | Median of 12 completed bears | Mildest completed (2018) | Deepest (2000–02) |
|---|---|---|---|---|
| Peak-to-trough decline | −28.6% so far | ≈ −38% | ≈ −26% | ≈ −85% |
| Months from peak to low | ~1 (to July 29) | ~9 | ~9 | ~31 |
| Months from low back to prior peak | not yet | ~12 | ~4 | ~183 |
| Gain needed to regain the peak | +26.4% from the Oct 15 close | — | — | — |
Method: 2025–2026 levels are daily closes from the St. Louis Fed's FRED series, cross-checked against Yahoo Finance's ^SOX history; the two give identical closes for every date quoted here. Medians are computed from the twelve completed rows of the reference table below.
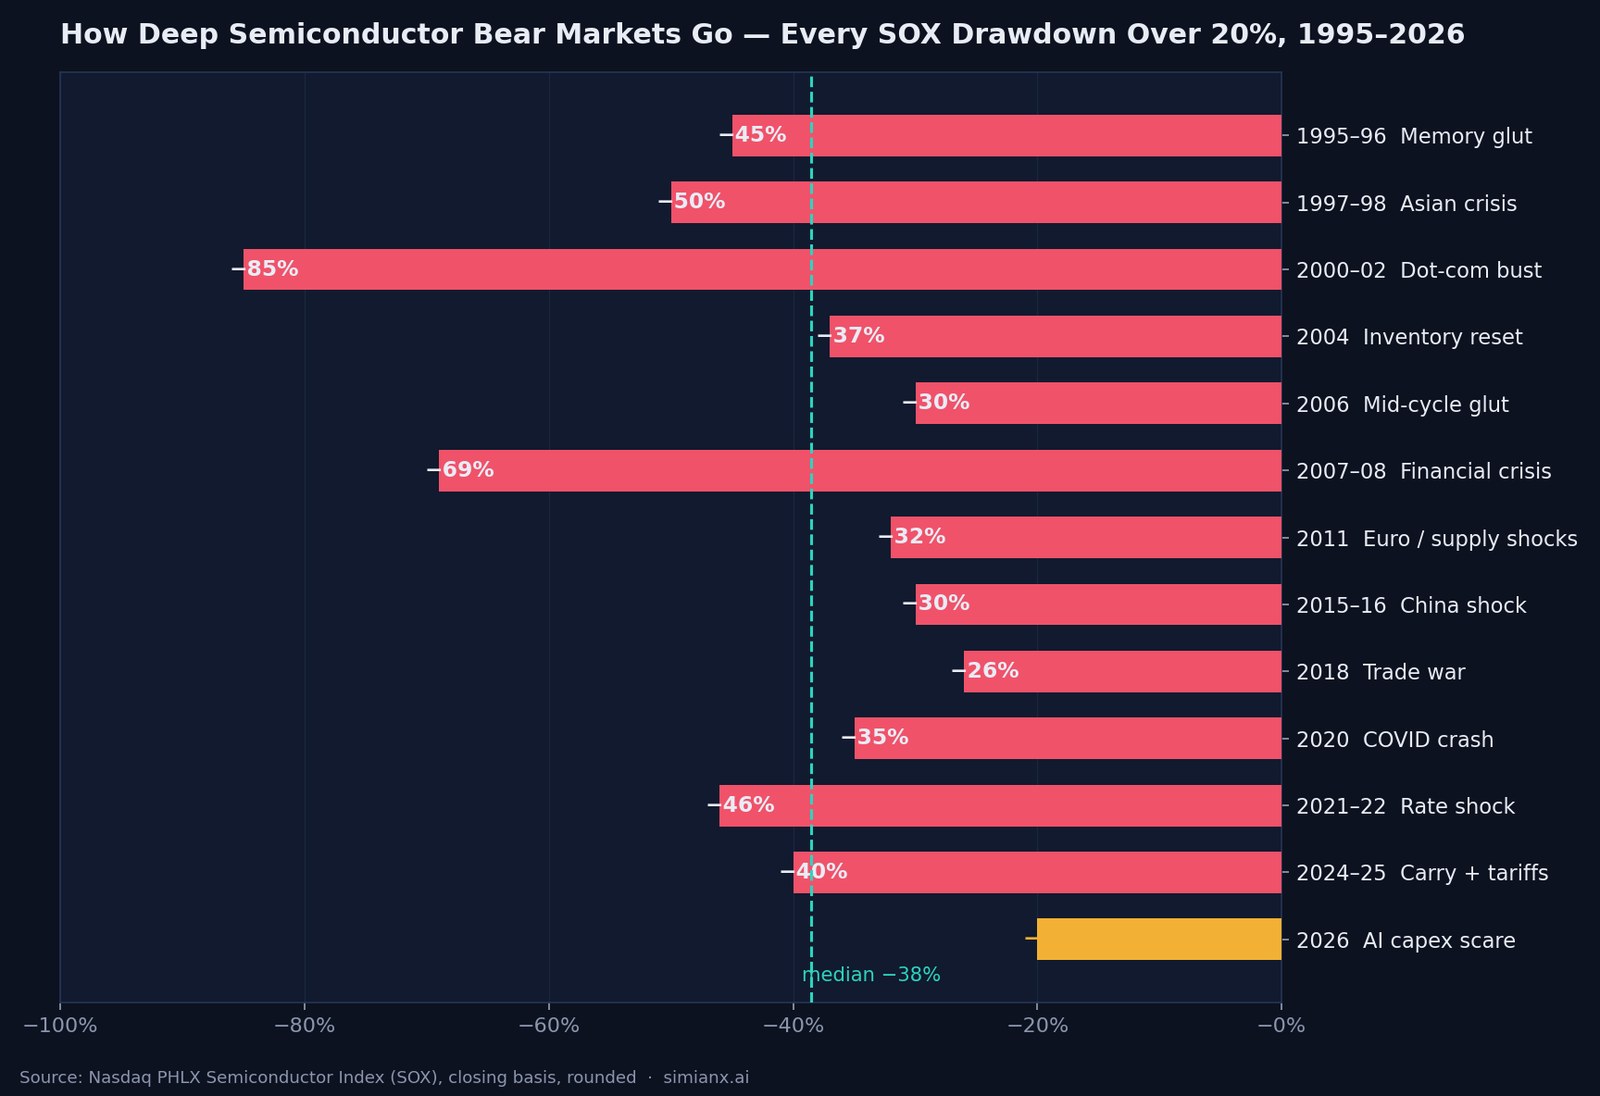
Every SOX Bear Market Since 1995: The Reference Table
The table covers every peak-to-trough decline of 20% or more in the SOX on a closing basis. Figures are rounded; see the methodology section for sourcing and caveats.
| Episode | Peak | Trough | Drawdown | Months down | Months back to prior peak | Primary trigger |
|---|---|---|---|---|---|---|
| 1995–96 memory glut | Sep 1995 | Jul 1996 | ≈ −45% | ~10 | ~9 | DRAM price collapse, PC inventory glut |
| 1997–98 Asian crisis | Aug 1997 | Oct 1998 | ≈ −50% | ~14 | ~3 | Asian financial crisis, memory oversupply |
| 2000–02 dot-com bust | Mar 2000 (≈1,362) | Oct 2002 (≈209) | ≈ −85% | ~31 | ~183 (≈15 yr) | Internet and telecom capex collapse |
| 2004 inventory reset | Jan 2004 (≈560) | Sep 2004 (≈352) | ≈ −37% | ~8 | ~118 (≈10 yr) | Post-recovery inventory correction |
| 2006 mid-cycle glut | Jan 2006 (≈560) | Jul 2006 (≈390) | ≈ −30% | ~6 | ~90 (≈8 yr) | Inventory build, Fed tightening |
| 2007–08 financial crisis | Jul 2007 (≈549) | Nov 2008 (≈171) | ≈ −69% | ~16 | ~62 (≈5 yr) | Global financial crisis |
| 2011 euro / supply shocks | Feb 2011 (≈474) | Oct 2011 (≈323) | ≈ −32% | ~8 | ~21 | Eurozone crisis, U.S. downgrade, Japan quake and Thai flood supply chains |
| 2015–16 China shock | Jun 2015 (≈746) | Feb 2016 | ≈ −30% | ~8 | ~6 | Yuan devaluation, smartphone plateau |
| 2018 trade war | Mar 2018 (≈1,446) | Dec 2018 (≈1,069) | ≈ −26% | ~9 | ~4 | U.S.–China tariffs, memory downcycle, crypto-GPU bust |
| 2020 COVID crash | Feb 2020 (≈1,980) | Mar 2020 (≈1,287) | ≈ −35% | ~1 | ~4 | Pandemic shutdown shock |
| 2021–22 rate shock | Dec 2021 (≈4,040) | Oct 2022 (≈2,162) | ≈ −46% | ~10 | ~14 | Inflation and rate surge, PC/memory bust, export controls |
| 2024–25 carry + tariffs | Jul 2024 (≈5,905) | Apr 2025 (≈3,563) | ≈ −40% | ~9 | ~5 | Yen carry unwind, DeepSeek efficiency scare, April 2025 tariff shock |
| 2026 AI capex scare | Jun 2026 (≈14,635) | Jul 2026 (≈10,447), lowest close so far | ≈ −29% so far | ~1 | not yet (as of Oct 15) | AI overbuild fears, custom silicon competition, memory reset |
Reading notes. First, the two mid-2000s entries overlap in level: the January 2004 high near 560 was essentially re-tested in January 2006 and not durably exceeded until 2014 — more on that below. Second, the 2024–25 episode was one drawdown with two legs: a 24%–26% plunge into the August 5, 2024 yen-carry unwind, a partial rebound, then a slide that culminated in the April 2025 tariff crash roughly 40% below the July 2024 peak. Third, the 2026 row is unfinished by definition; it enters the table because a 20% closing decline is the conventional bear-market threshold, as Investopedia's definition has it.
How Deep Do Semiconductor Bear Markets Go?
The depth distribution is wide but has a clear shape. Nine of the twelve completed episodes bottomed between −26% and −50%. Only two — the 2000–02 dot-com bust at roughly −85% and the 2007–08 financial crisis at roughly −69% — went materially deeper, and both required something beyond an ordinary chip cycle: the first was the unwind of the largest valuation bubble in modern U.S. history, the second a global banking collapse. A garden-variety semiconductor downcycle, in other words, historically bottoms somewhere in the −30% to −50% band.
That band is also far deeper than what the broad market experiences. For comparison, the median bear market in the S&P 500 since 1929 is roughly −34% — see our companion table of every S&P 500 bear market since 1929 — while the median SOX bear is −38% with an average near −44%. Chips fall harder than stocks at large in almost every shared episode: in 2018 the S&P dipped 19.8% while the SOX lost about 26%; in 2021–22 the S&P fell about 25% while the SOX nearly halved. High beta is the price of the sector's structural growth.
At its July 29 low, the 2026 decline had reached −28.6%: deeper than the mildest completed episode (2018's −26%) but short of the −38% median. That is not a forecast; it is a base rate.
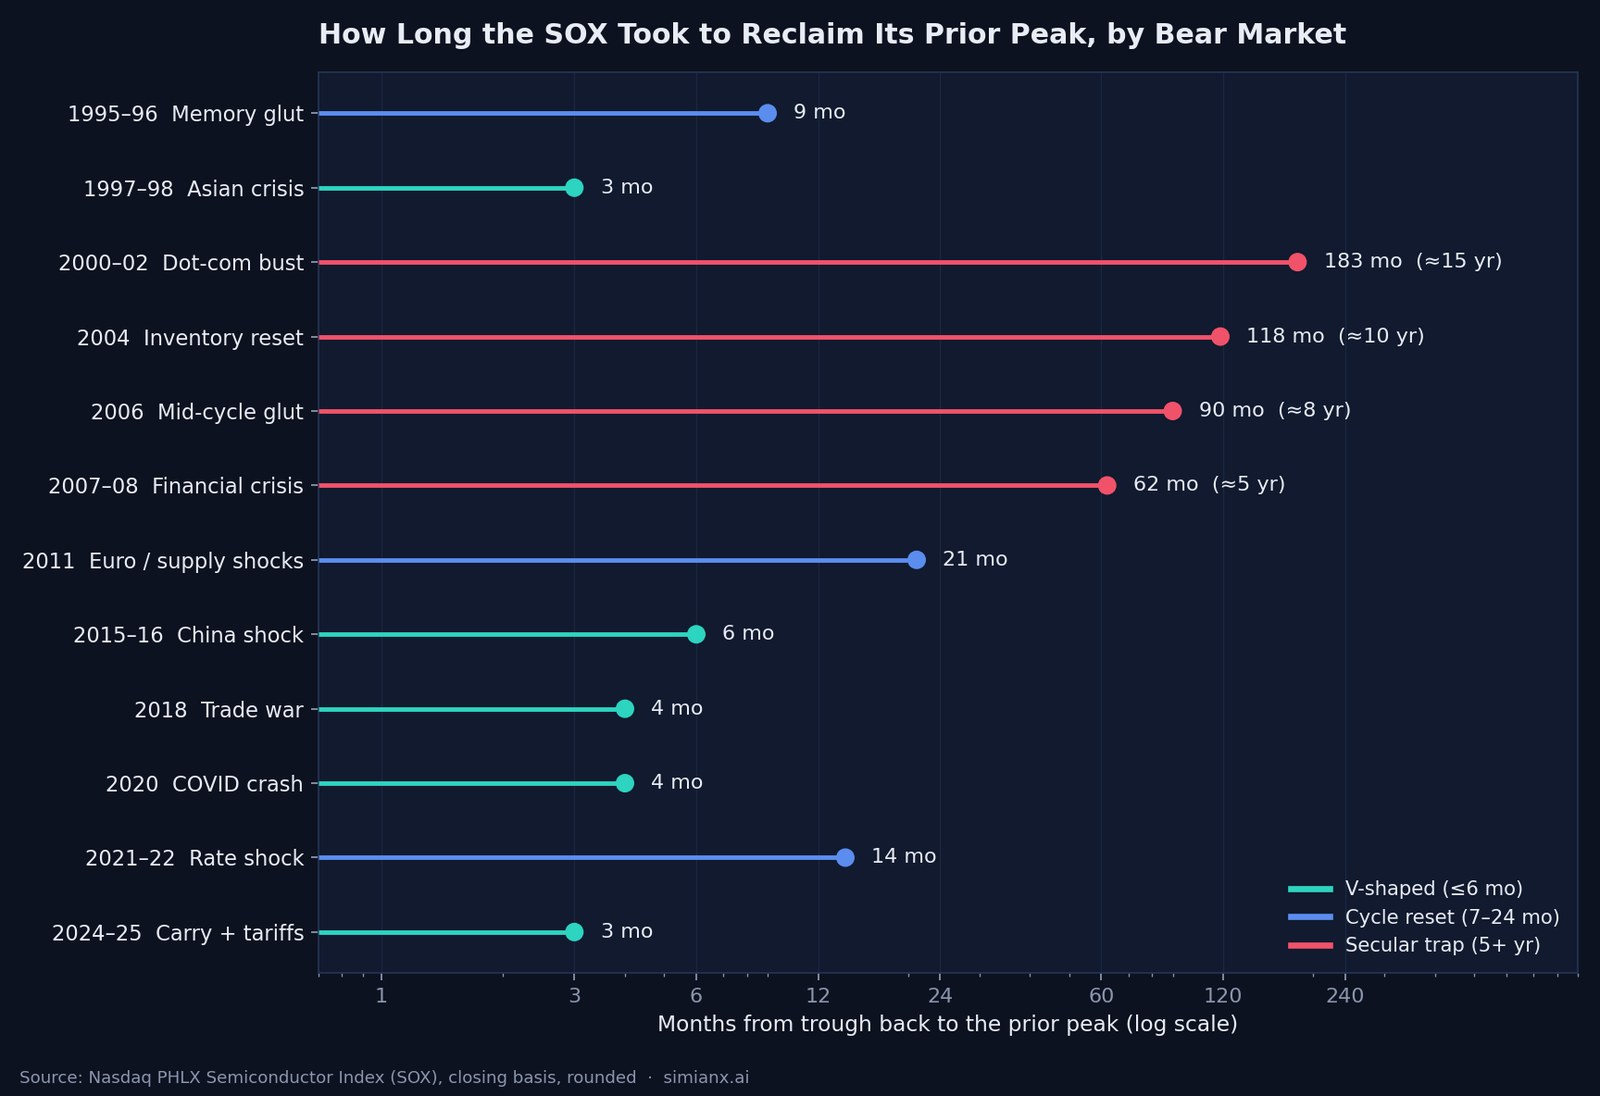
Three Recovery Regimes: V-Shape, Cycle Reset, Secular Trap
Depth is only half the story — the other half is how long capital stays trapped. The recovery times in the table sort cleanly into three regimes.
V-shaped recoveries (six months or less). The Asian-crisis bottom of October 1998 was reclaimed within about three months; the 2015–16, 2018 and 2020 bottoms were all repaired in four to six months; the April 2025 tariff crash was erased in about five months, with a new closing high on September 10, 2025. The common thread: the shock was external to the chip cycle, demand never actually broke, and policy or positioning snapped back.
Cycle resets (seven to twenty-four months). The 1995–96 memory glut (about nine months back to highs), 2011 (about twenty-one months) and the 2021–22 rate shock (about fourteen months, with new highs in December 2023) were genuine industry downcycles: inventories had to clear and earnings had to trough before the index could reclaim its peak.
Secular traps (five years or more). Three episodes kept investors underwater for half a decade or longer. The dot-com bust needed roughly fifteen years from the October 2002 trough — the SOX did not durably close above its March 2000 peak of about 1,362 until the rally that ran into January 2018, a round trip of nearly eighteen years. The 2007–08 crash took about five years from the bottom. And the mid-2000s highs formed their own trap, which deserves its own section.
The lost decade, 2004–2014. Here is the least-known fact in the table: the SOX peaked near 560 in January 2004, re-tested almost exactly the same level in January 2006, topped out at 549 in July 2007 — still below the 2004 high — and then did not durably trade above the 2004 peak until 2014. An investor who bought the index at the January 2004 top waited roughly ten years to break even, through an entire decade in which global semiconductor revenue nearly doubled. Multiple expansion had simply run too far ahead of the industry in the early 2000s, and it took ten years of earnings growth to grow back into the price. That is the cautionary template for what "AI overbuild" bears say 2026 could become — not a crash, but a long flat purgatory.
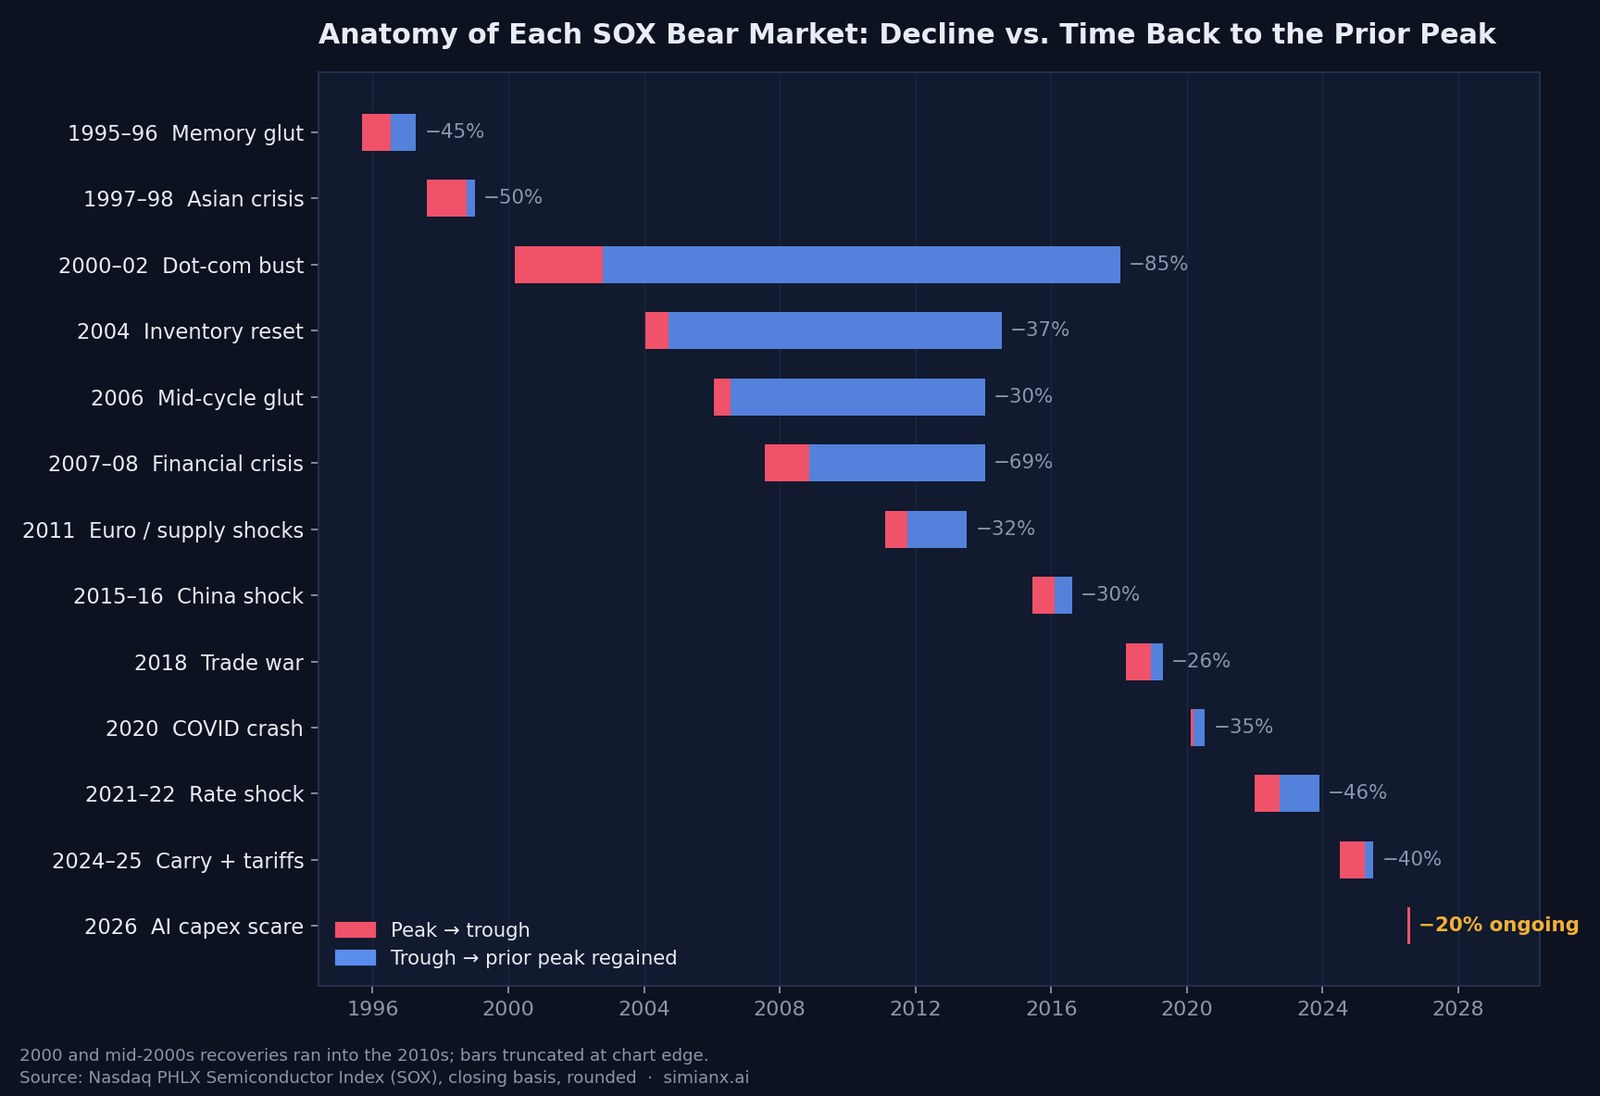
What Actually Triggers Chip Bear Markets?
Grouping the thirteen episodes by primary cause produces three recurring archetypes — with the caveat that real cycles usually mix at least two.
Industry downcycles — 1995–96, 2004, 2006, 2015–16, and the memory leg of 2018. Chipmakers over-order capacity into strong demand, inventories balloon, prices crack. Median depth in this group: roughly −30% to −37%. These are the "normal" semiconductor bears, and outside the mid-2000s trap they tend to resolve within a year or two.
Macro and systemic shocks — 1997–98, 2007–08, 2011, 2020, and the carry-trade leg of 2024–25. The chip cycle gets hit by something much bigger than chips. Depth varies with the size of the macro event, from −32% (2011) to −69% (2008), but recoveries are often the fastest in the table once the macro shock passes, because semiconductor demand itself never broke.
Capex and speculation busts — 2000–02, 2021–22, and, if the bears are right, 2026. A technology investment boom that chips supplied — telecom and internet buildout in 2000, pandemic digitization in 2021, AI datacenters today — turns out to have been pulled forward or overbuilt. This group has produced the largest losses: the two completed examples produced the deepest crash (−85%) and one of the longest recoveries in the table. The reason is structural: when the customer's capex was the bubble, chip earnings and chip multiples deflate together.
This taxonomy is why the July 2026 debate matters so much. A Fed still deciding whether to hike puts a macro overlay on the tape, but the core dispute — whether hyperscaler AI spending is durable — is a category-three question, and category three has the worst historical outcomes. The optimists' counter is that 2024–25 was also framed as an AI capex scare and resolved as a five-month V-shape once earnings kept beating, and that unlike March 2000 the leading AI chipmakers trade on real, delivered profits. The Korean market's February 2026 AI chip reckoning sits as a live regional case study of the same argument.
Is 2026 More Like 2000, 2018, or 2024?
Map the current episode against the table and three analogues stand out.
The 2000 analogue (bear case). Matches: a vertical pre-peak run (the SOX roughly doubled in the year into March 2000 and rose ~180% in the twelve months into June 2026), record retail and momentum participation, and a capex-bust trigger. Differences: today's flagship chipmakers earn tens of billions in free cash flow, and the AI buildout is funded largely from operating profits rather than debt and equity issuance. An 85% crash requires valuations and financing structures 2026 does not obviously have; our comparison of every tech bubble since 1929 sets the AI cycle against 2000 and earlier manias.
The 2018 analogue (base case for a correction). A policy-and-cycle correction of about −26% over nine months that ended when the macro pressure lifted, and was fully recovered in four months. If June's peak turns out to be a sentiment top rather than an earnings top, the 2026 episode most resembles this: painful, fast, and forgettable within a year.
The 2024–25 analogue (recent memory). The market's own most recent template: an AI-related scare compounded by an external shock, a ~40% full-cycle drawdown across two legs — and then a five-month climb back to highs once the earnings held. Traders who anchored on that episode are conditioned to buy this dip; that itself is a risk if the capex data disappoints, because the crowd's playbook is now one-sided.
The honest answer is that the analogue cannot be identified in real time — it depends on hyperscaler capex guidance and AI monetization data that will arrive over the next two to four quarters. What history does say: the median completed SOX bear fell −38% over nine months, every completed episode exceeded −25%, and triggers that put "capex" in the first sentence deserve wider error bars than triggers that put "tariffs" there. By October 15, 2026 the current episode had matched the 2018 depth but not the 2018 recovery: in 2018 the index was back at its prior peak about four months after the low, while in 2026 it was still 26.4% short of the record two and a half months after the July 29 low.
Tracking a Live Drawdown with AI
A reference table tells you the base rates; it cannot tell you which row July 2026 will become. For the live question, we run the experiment in public. SimianX's Live Command Room streams multi-agent AI analysis on individual names — you can open a live session on NVDA, AMD or MU and watch indicator, news and decision agents argue the drawdown in real time. Our autopilots publish every AI trade with full reasoning, which is exactly the dataset behind our study of whether AI models panic-sell in a crash. And for the systematic view of downside conditions, our drawdown watch framework explains the early-warning signals the agents monitor. Base rates from this table plus live evidence from those tools beats either one alone.
Methodology and Sources
Episodes are peak-to-trough declines of 20% or more in the PHLX Semiconductor Index (SOX) on a closing basis, from the index's first major cycle in 1995 through October 15, 2026. Index levels are closing values rounded to whole points; drawdowns, durations and recovery times are rounded and marked as approximate — daily closing series from different vendors can shift a figure by a point or two, and the 1990s values predate Nasdaq's current index feed. Recovery is measured from the trough date until the index first durably closed above the prior peak; for the overlapping mid-2000s episodes (2004 and 2006), recovery is measured to the 2014 breakout that finally exceeded both highs. Historical levels were cross-checked against the Nasdaq SOX index page, the St. Louis Fed's FRED series, and contemporaneous press coverage, including CNBC's July 2026 market reports. The 2026 figures reflect FRED and Yahoo Finance daily closes through October 15, 2026, and will change; this page treats the episode as ongoing. This table is part of our market history reference hub. Nothing here is investment advice — it is a historical reference.
FAQ
What counts as a semiconductor bear market? This table uses the conventional threshold: a decline of at least 20% from a closing high in the PHLX Semiconductor Index. Declines of 10–20% are corrections. The SOX has had many more of those, including roughly −22% in 2010 and −24% in the single August 2024 leg, which do not appear as separate rows here.
Are chip stocks in a bear market right now? Yes, by the 20% definition. On October 15, 2026 the SOX closed at 11,581.22, 20.9% below its June 22, 2026 record of 14,634.72. Its lowest close so far was 10,447.49 on July 29, a 28.6% decline. The episode ends only when the index closes above the June record again.
When was the last semiconductor bear market before 2026? The 2024–25 episode. The SOX fell about 40% from its July 10, 2024 close of 5,904.54 to 3,562.94 on April 8, 2025, in two legs: the August 2024 yen-carry unwind and the April 2025 tariff shock. It closed at a new high on September 10, 2025, about five months after the low.
What was the worst semiconductor crash in history? The dot-com bust. The SOX fell roughly 85% from its March 2000 peak near 1,362 to its October 2002 trough near 209, and needed about fifteen years from the bottom to durably reclaim the old high.
How long do chip bear markets usually last? The median completed decline took about nine months from peak to trough, and the median climb from the trough back to the prior peak took about a year. The range runs from one month down and four months back (2020) to thirty-one months down and fifteen years back (2000–02).
How fast can semiconductor stocks recover from a 40% crash? The fastest deep recovery in the table is 2024–25: after a decline of about 40%, the index was back at a new high about five months after the April 2025 low, as AI-related earnings kept growing. After the 46% decline of 2021–22, the climb back took about fourteen months.
Related Reading
- Why TSMC Stock Fell After Q3 2026: Every Earnings Reaction
- Every S&P 500 bear market since 1929 — the broad-market companion table.
- How long every bear market took to recover, 1929–2022 — recovery times beyond the chip sector.
- Why semiconductor stocks are falling in 2026 — the week-by-week anatomy of the current unwind.
- Can Meta's excess AI capacity drive revenue? — the report that lit the fuse.
- Every Fed rate-hike cycle since 1983 — the macro overlay on chip cycles.
- Do AI models panic-sell in a crash? — what 31 trading bots did in a live drawdown.
- Every tech bubble since 1929 — how the AI cycle compares with 2000 and earlier manias.
- AI capex in 2026 — the hyperscaler spending behind chip demand.
- Market history reference hub — all of our long-run market tables.
Explore all of our data references on the stories index, or put the table to work in a live AI analysis — plans start on the pricing page.
References
- Nasdaq — PHLX Semiconductor Index (SOX) overview
- Nasdaq Global Indexes — SOX index data
- FRED, Federal Reserve Bank of St. Louis — NASDAQSOX daily series
- Investopedia — bear market definition
- Yahoo Finance — PHLX Semiconductor Index (^SOX) history
- CNBC — July 2026 stock market coverage
- Bloomberg — markets and technology news
- iShares — Semiconductor ETF (SOXX)