Every Trillion-Dollar Milestone, From Apple in 2018 to Amazon in 2026
On Monday, August 3, 2026, Amazon ended the trading day worth more than $3 trillion for the first time in its history. It became just the fifth company ever to reach that valuation, joining Apple, Microsoft, NVIDIA and Alphabet in what is arguably the most exclusive club in modern markets.
The milestone landed in the middle of a remarkable week. The S&P 500 closed Friday, August 7 at a record 7,757.64, up 3.6% for the week, while the Nasdaq gained 5.2% — its best stretch of the summer. A surprisingly weak July jobs report convinced traders that the Federal Reserve, holding its benchmark rate at 3.50%–3.75%, is done tightening. Into that backdrop, Amazon's post-earnings rally simply kept going until the market cap counter rolled over into thirteen digits — for the third time.
This page is built as a permanent reference: every $1 trillion milestone ever crossed, the exact dates, how many days each leap took, and the full roster of the trillion-dollar club as it stands in August 2026. Bookmark it; we will keep the numbers anchored to the dates below.
What Pushed Amazon Over the Line
Amazon's push through $3 trillion was earned the old-fashioned way: a blowout earnings report.
On July 30, 2026, the company posted second-quarter results that beat on nearly every line:
- Revenue of $200.6 billion, up 20% year over year — the first time Amazon has cleared $200 billion in a single quarter.
- AWS revenue of $42.2 billion, up 37% year over year — the cloud unit's fastest growth in 18 quarters, against analyst expectations of about 31%. That puts Amazon Web Services on an annualized run rate near $169 billion.
- Operating income of $27.5 billion, up 43% from $19.2 billion a year earlier. AWS alone contributed $16.6 billion at a 39.4% operating margin.
- Capital expenditure guidance raised to roughly $220 billion for 2026, up from about $200 billion, most of it aimed at AI and cloud infrastructure.
The stock rallied through the following sessions, hit a record high on Monday, August 3, and closed with a market capitalization above $3 trillion, as reported by CNBC.
The champagne got a small splash of cold water a day later. On August 4, a filing with the U.S. Securities and Exchange Commission revealed that founder Jeff Bezos plans to sell roughly 15 million shares — about $4.07 billion — under a Rule 10b5-1 trading plan adopted in November 2025. The stock slipped about 2% on the news, a reminder that even milestone weeks include profit-taking. It changed nothing about the club membership: Amazon remains comfortably in thirteen-digit territory at roughly $2.96–$3.0 trillion as of the August 7 close.
The $3 Trillion Club at a Glance
Five companies have ever been worth $3 trillion. Here is the complete list, in the order they arrived:
| # | Company | First crossed $3T | Days from $1T to $3T | Market cap (Aug 7, 2026) |
|---|---|---|---|---|
| 1 | Apple | January 3, 2022 | 1,250 (3.4 yrs) | ≈ $4.57T |
| 2 | Microsoft | January 24, 2024 | 1,735 (4.8 yrs) | ≈ $3.71T |
| 3 | NVIDIA | June 5, 2024 | 372 (1.0 yr) | ≈ $5.42T |
| 4 | Alphabet | September 15, 2025 | 2,069 (5.7 yrs) | ≈ $4.32T |
| 5 | Amazon | August 3, 2026 | 2,890 (7.9 yrs) | ≈ $2.96T |
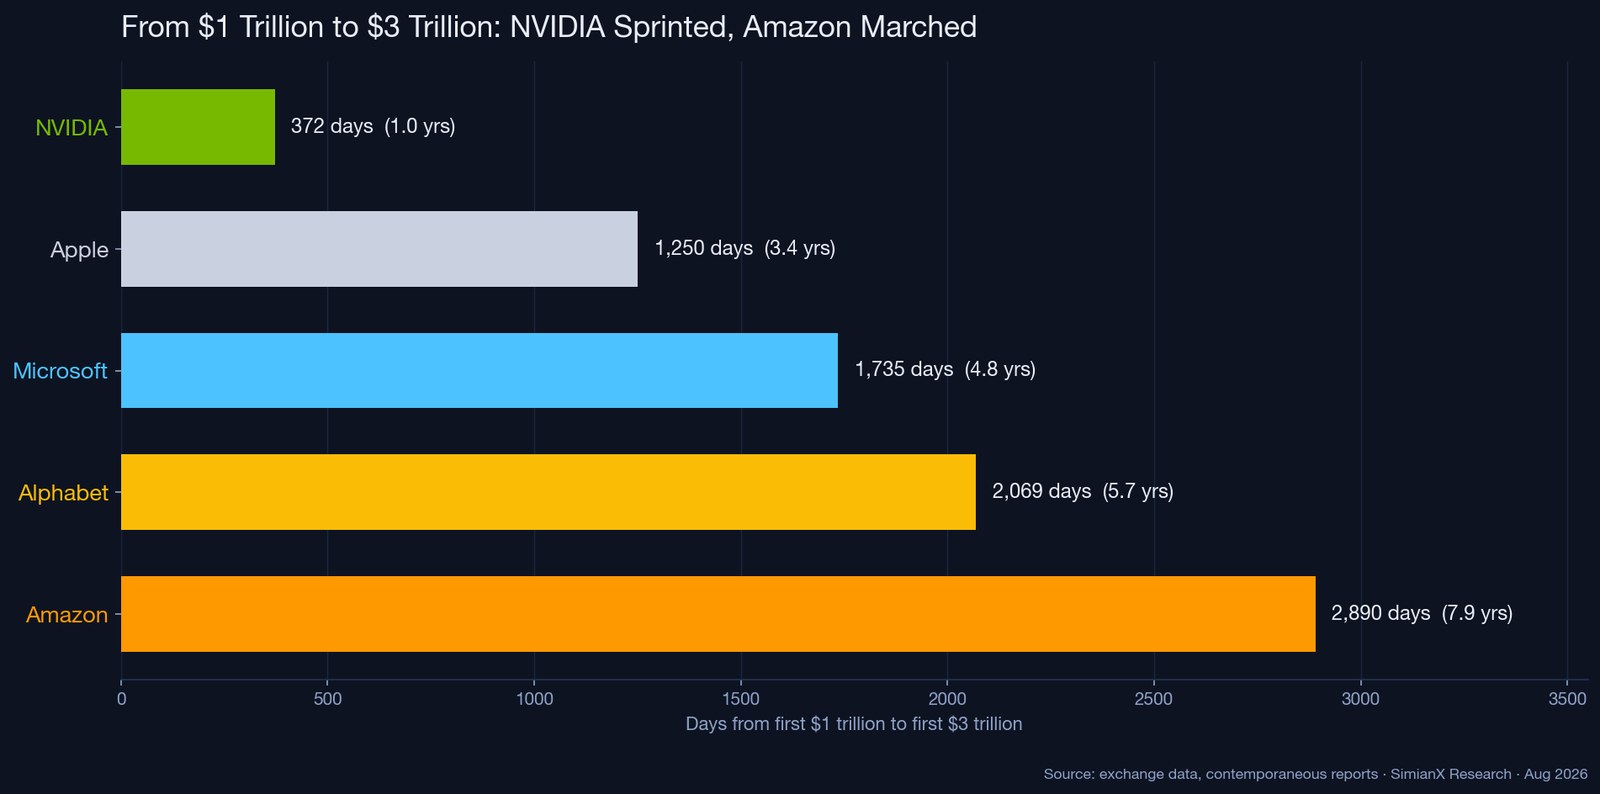
Two details jump out of that table. First, NVIDIA's sprint: barely a year separated its first $1 trillion close from its first $3 trillion. Second, Amazon's marathon: nearly eight years passed between its first touch of $1 trillion in September 2018 and this week's milestone — the longest such journey of any member.
The Complete Milestone Table: $1T to $5T
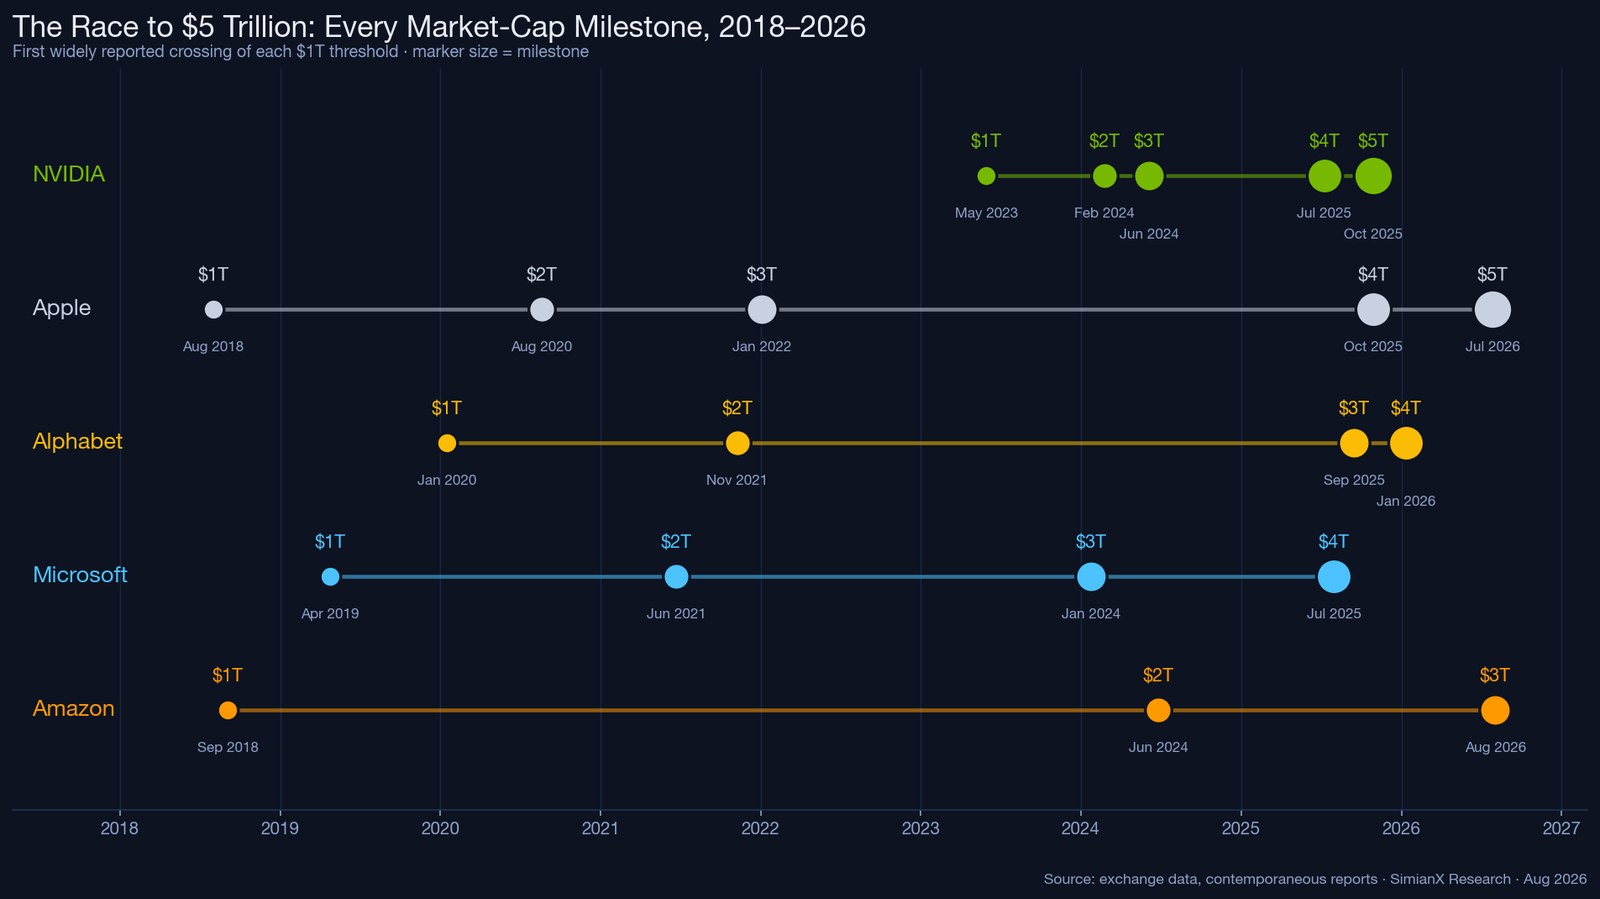
The table below records the first widely reported crossing of each trillion-dollar threshold by the five club members. These are the dates the financial press marked the event, whether the level first broke intraday or held into the close (see the methodology note at the end of this page).
| Milestone | Apple | Microsoft | NVIDIA | Alphabet | Amazon |
|---|---|---|---|---|---|
| $1 trillion | Aug 2, 2018 | Apr 25, 2019 | May 30, 2023 | Jan 16, 2020 | Sep 4, 2018 |
| $2 trillion | Aug 19, 2020 | Jun 22, 2021 | Feb 23, 2024 | Nov 8, 2021 | Jun 26, 2024 |
| $3 trillion | Jan 3, 2022 | Jan 24, 2024 | Jun 5, 2024 | Sep 15, 2025 | Aug 3, 2026 |
| $4 trillion | Oct 28, 2025 | Jul 31, 2025 | Jul 9, 2025 | Jan 12, 2026 | — |
| $5 trillion | Jul 28, 2026 | — | Oct 29, 2025 | — | — |
Historical footnotes that belong in any honest version of this table:
- PetroChina briefly traded above $1 trillion on its Shanghai debut in November 2007 — a figure widely treated as an artifact of a tiny free float, which is why Apple's August 2018 crossing is conventionally called the first.
- Saudi Aramco listed in December 2019 at a $1.88 trillion valuation and touched $2 trillion on its second trading day — making it, technically, the first company to trade at $2 trillion, ahead of Apple's August 2020 crossing.
- NVIDIA was the first to $4 trillion (July 9, 2025) and the first to $5 trillion (October 29, 2025), a level Apple briefly joined on July 28, 2026.
How Long Each Leap Took
Speed is where the five stories diverge most dramatically.
| Leap | Apple | Microsoft | NVIDIA | Alphabet | Amazon |
|---|---|---|---|---|---|
| $1T → $2T | 748 days | 789 days | 269 days | 662 days | 2,122 days |
| $2T → $3T | 502 days | 946 days | 103 days | 1,407 days | 768 days |
| $3T → $4T | 1,394 days | 554 days | 399 days | 119 days | — |
| $4T → $5T | 273 days | — | 112 days | — | — |
A few patterns worth internalizing:
- NVIDIA's $2T → $3T leap took 103 days. That is the fastest trillion ever added — driven by the 2024 AI-datacenter boom, when the company was regularly adding more value in a month than most S&P 500 members are worth in total.
- Each successive trillion is a smaller percentage gain. Going from $1T to $2T requires a double; from $4T to $5T only +25%. That arithmetic is why late milestones cluster together: Apple needed 748 days for its first doubling but only 273 days for the $4T → $5T step.
- Amazon's $1T → $2T gap of 2,122 days is the longest single leg on the board — and it contains the whole story of the 2022 bear market, which we cover below.
- Alphabet's $3T → $4T in 119 days is the fastest post-$3T follow-through, powered by a favorable antitrust ruling in late 2025 and the market's re-rating of its AI position.
The Full Trillion-Dollar Club, August 2026
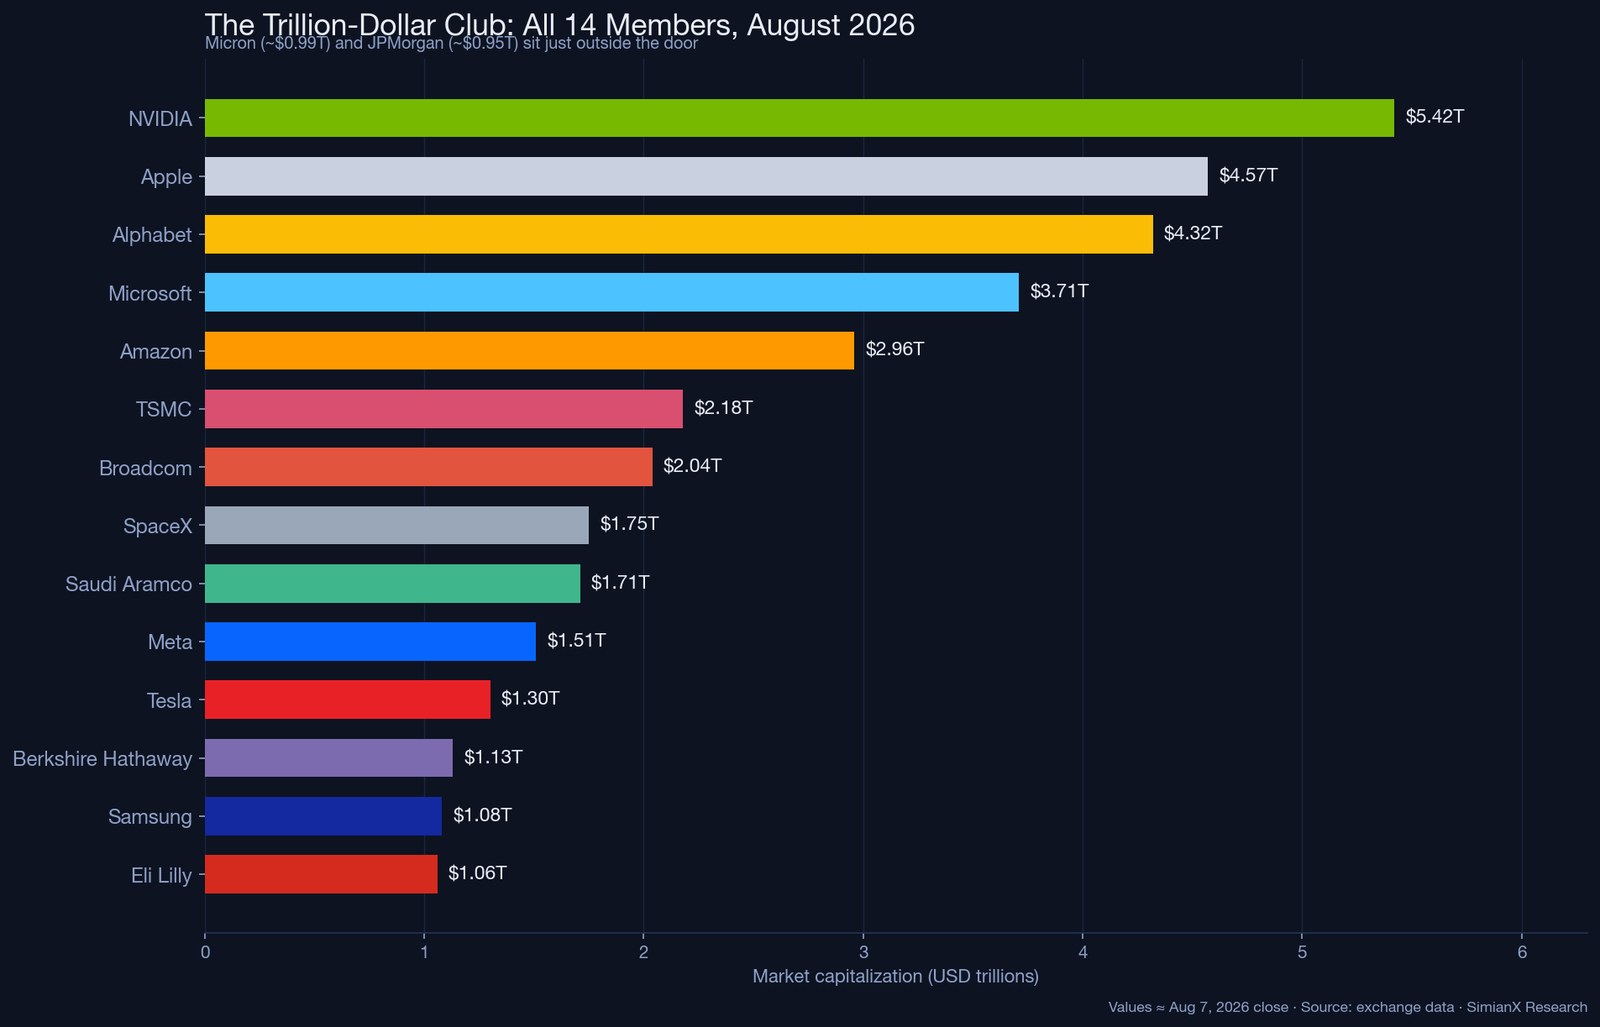
The $1 trillion tier — once a curiosity — now holds fourteen companies.
| Rank | Company | Market cap | Note |
|---|---|---|---|
| 1 | NVIDIA | ≈ $5.42T | World's most valuable company; first to $4T and $5T |
| 2 | Apple | ≈ $4.57T | First to $1T (2018), $2T (2020), $3T (2022); touched $5T in July 2026 |
| 3 | Alphabet | ≈ $4.32T | Crossed $4T on January 12, 2026 |
| 4 | Microsoft | ≈ $3.71T | Peaked above $4T in mid-2025 |
| 5 | Amazon | ≈ $2.96T | Newest $3T member — August 3, 2026 |
| 6 | TSMC | ≈ $2.18T | The club's chipmaking foundry backbone |
| 7 | Broadcom | ≈ $2.04T | Joined the $1T tier in December 2024 |
| 8 | SpaceX | ≈ $1.75T | Topped $2T at its record-setting IPO before settling back |
| 9 | Saudi Aramco | ≈ $1.71T | Briefly the world's most valuable company at its 2019 listing |
| 10 | Meta | ≈ $1.51T | First crossed $1T in June 2021 |
| 11 | Tesla | ≈ $1.30T | First crossed $1T in October 2021 |
| 12 | Berkshire Hathaway | ≈ $1.13T | First non-tech U.S. member, August 2024 |
| 13 | Samsung Electronics | ≈ $1.08T | Entered the club during the 2025–26 memory supercycle |
| 14 | Eli Lilly | ≈ $1.06T | First pharmaceutical member |
Waiting at the door: Micron (≈ $0.99T) and JPMorgan (≈ $0.95T), either of which could become member fifteen on a good month. Walmart, at roughly $0.89 trillion, has drifted in and out of the antechamber all year.
The club is no longer purely American, and no longer purely tech: TSMC, Aramco and Samsung carry three different flags, Berkshire is a conglomerate, Eli Lilly sells medicine, and SpaceX — the first private-market graduate to the tier — sells rockets and satellite bandwidth.
Why Amazon Was the Slowest — and Why It Didn't Matter
Amazon's 2,890-day march from $1 trillion to $3 trillion is a compressed history of the entire market cycle.
It first touched $1 trillion on September 4, 2018, just weeks after Apple. Then came the slow years. The pandemic pulled forward enormous e-commerce demand, but it also pulled forward enormous costs: Amazon nearly doubled its fulfillment footprint in two years and hired hundreds of thousands of workers into a logistics network that suddenly had too much capacity when the world reopened. In 2022, with inflation surging and the Federal Reserve hiking aggressively, the stock lost roughly half its value peak-to-trough — the deepest drawdown of any current $3 trillion member during its climb.
The rebuild was quieter. Cost discipline restored retail margins. Advertising grew into a major profit engine. And AWS — after decelerating through 2022–23 — reaccelerated hard as enterprise AI workloads moved from experiments to production. By the time the June 2024 crossing of $2 trillion arrived, the shape of this week's milestone was already visible: cloud growth compounding on a bigger base, with AI demand as the multiplier.
The lesson for long-term investors is not subtle. A company can spend nearly eight years between milestones, absorb a 50% drawdown in the middle, and still arrive. Time in the compounding machine mattered more than the speed of any single leg.
How Big Is $3 Trillion, Really?
Numbers this large lose meaning without anchors. A few that help:
- $3 trillion is roughly the annual GDP of France — the world's seventh-largest economy. Amazon's market value, in other words, is priced near the yearly output of a nation of 68 million people.
- It is about fifteen quarters of Amazon's own record $200.6 billion revenue — the market is capitalizing many years of future cash flow, not current sales.
- The five $3T members together are worth about $21 trillion — more than the entire S&P 500 was worth as recently as 2015.
- For a crypto-side anchor, the total value of Bitcoin — itself the largest digital asset by far — remains well under half of Amazon's market cap alone.
What Happened After Each Company Joined
Does crossing $3 trillion mark a top, a launchpad, or nothing at all? The honest answer, with only five data points, is "nothing reliable" — but the record is worth knowing:
- Apple (January 2022): joined at the exact peak of the cycle. The 2022 bear market took the stock down roughly 27% that year, and it did not close above $3 trillion again until mid-2023.
- Microsoft (January 2024): ground steadily higher, reaching $4 trillion 554 days later.
- NVIDIA (June 2024): endured two sharp corrections — including a single-day loss of hundreds of billions in early 2025 — and still added two more trillions within 17 months.
- Alphabet (September 2025): the fastest follow-through in club history, clearing $4 trillion just 119 days later.
- Amazon (August 2026): five days old. Ask us in a year.
One joined at a cycle top, three kept climbing, one is too new to judge. The milestone itself carries no predictive signal — it is a scoreboard, not a strategy. Treat any "company X just hit a round number, therefore buy/sell" argument with suspicion.
Watching the Club in Real Time
Milestone tables are history the moment they are published — the club standings above will drift with every session. If you want the live view, this is exactly what SimianX is built for.
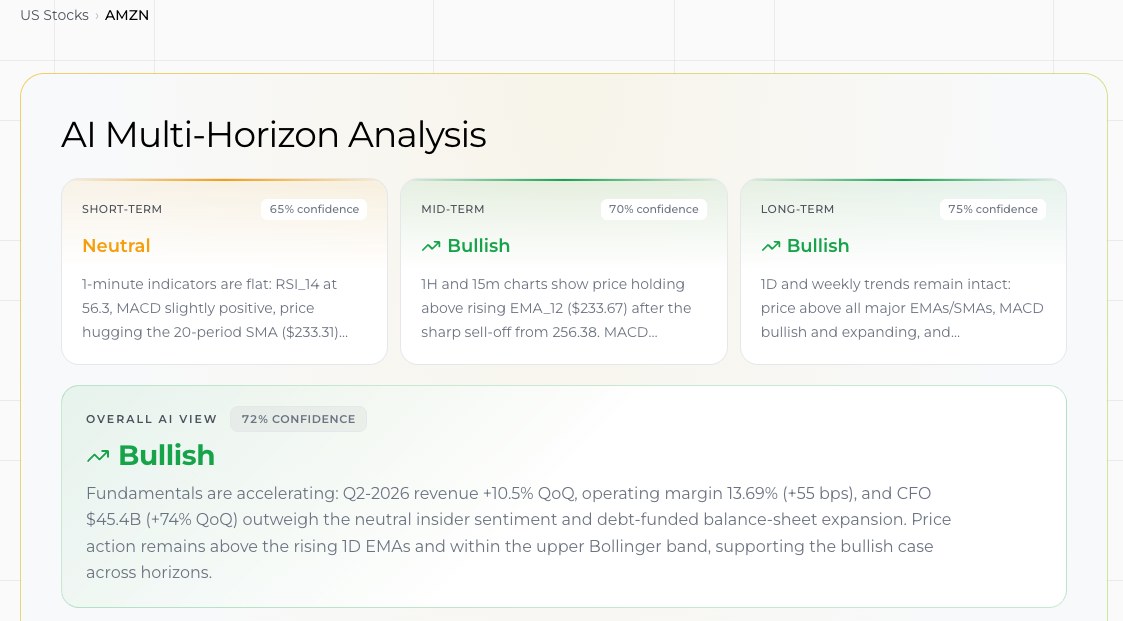
Every U.S. stock page — Amazon, NVIDIA, Apple and the rest of the club included — carries a continuously refreshed multi-horizon AI read: short-term technicals, mid-term trend structure, and long-term fundamental posture, each with its own confidence score. When Amazon's Q2 numbers hit, the fundamental layer picked up the acceleration (revenue +10.5% quarter over quarter, operating cash flow +74%) without anyone needing to parse the press release.
For the moments when the next milestone actually breaks, Market Pulse scans the whole tape for significant events — 52-week highs, unusual moves, breaking news — and surfaces them as they happen. And if you would rather interrogate the numbers than read them, a live multi-agent analysis session lets a team of AI models take apart any club member's chart and filings on demand, while autopilots run that analysis on a schedule so the next Amazon-sized move does not arrive unwatched.
FAQ
Which companies have reached a $3 trillion market cap?
Five: Apple (January 2022), Microsoft (January 2024), NVIDIA (June 2024), Alphabet (September 2025) and Amazon (August 2026).
What was the first company worth $1 trillion?
Apple, on August 2, 2018 — setting aside PetroChina's float-distorted 2007 Shanghai debut. Amazon followed just 33 days later.
What was the first company worth $5 trillion?
NVIDIA, on October 29, 2025. Apple became the second on July 28, 2026.
When did Amazon hit $1 trillion, $2 trillion and $3 trillion?
September 4, 2018; June 26, 2024; and August 3, 2026. The 2,890-day journey from first to third trillion is the longest of any club member.
Is Saudi Aramco in the trillion-dollar club?
Yes — at roughly $1.71 trillion it ranks ninth in August 2026. At its December 2019 listing it was briefly the world's most valuable company and technically the first to trade above $2 trillion.
Could Amazon reach $4 trillion?
It would require roughly a 35% gain from the August 2026 level. No one can time that; the historical record above shows post-$3T paths ranging from a 27% drawdown (Apple) to a $1T gain in four months (Alphabet). This article is a reference, not investment advice.
Methodology and Sources
Milestone dates are the first widely reported crossing of each threshold — in most cases an intraday break confirmed by contemporaneous coverage from CNBC, Bloomberg and company filings. Where the first intraday touch and the first close above a level differ materially (Apple first traded above $3T on January 3, 2022 but first closed above it on June 30, 2023), the table uses the widely cited first crossing; day-gap calculations use those same dates consistently. Current valuations are approximate as of the August 7, 2026 close and rounded to the nearest $0.01 trillion; private-market figures (SpaceX) reflect post-IPO public pricing. Amazon Q2 2026 figures are from the company's official earnings release; the Bezos share-sale details are from the SEC Form 144/10b5-1 coverage of August 4, 2026. Definitions: market capitalization = shares outstanding × share price (Investopedia).
For more reference tables like this one, browse the SimianX story library.
Related Reading
- When Did Tesla IPO? The Date, Price, and 290x Return
- How Long Every Bear Market Took to Recover: 1929-2022
- Every S&P 500 Bear Market Since 1929: Duration and Recovery
- AI Momentum Unwind 2026: Why Semiconductor Stocks Fall
- Apple WWDC 2026: Siri AI & Gemini Impact on AAPL Stock
- Meta Compute 2026: Can Excess AI Capacity Drive Revenue?