
Что история говорит об акциях и чипах во время повышений ставки ФРС
Как ведёт себя фондовый рынок, когда Федеральная резервная система повышает ставку? Это один из самых частых поисковых запросов в мире инвестиций, и в 2026 году — когда точечная диаграмма ФРС впервые за годы снова развернулась в сторону повышения — вопрос перестал быть академическим. Эта страница — та самая справочная таблица, которой нам всегда не хватало: каждый цикл повышения ставки ФРС с 1983 года с точными датами, размахом каждой кампании ужесточения, динамикой S&P 500 внутри цикла, худшей просадкой по пути и тем, что происходило в течение 12 месяцев после последнего повышения. А поскольку акции чипмейкеров сегодня задают тон всему рынку, мы также отслеживаем индекс PHLX Semiconductor (SOX) во всех циклах, которые он застал.
Это парный материал к нашей полной справочной таблице всех циклов снижения ставки ФРС с 1980 года. Добавьте в закладки ту таблицу, которая соответствует текущему направлению ФРС.
Короткий ответ
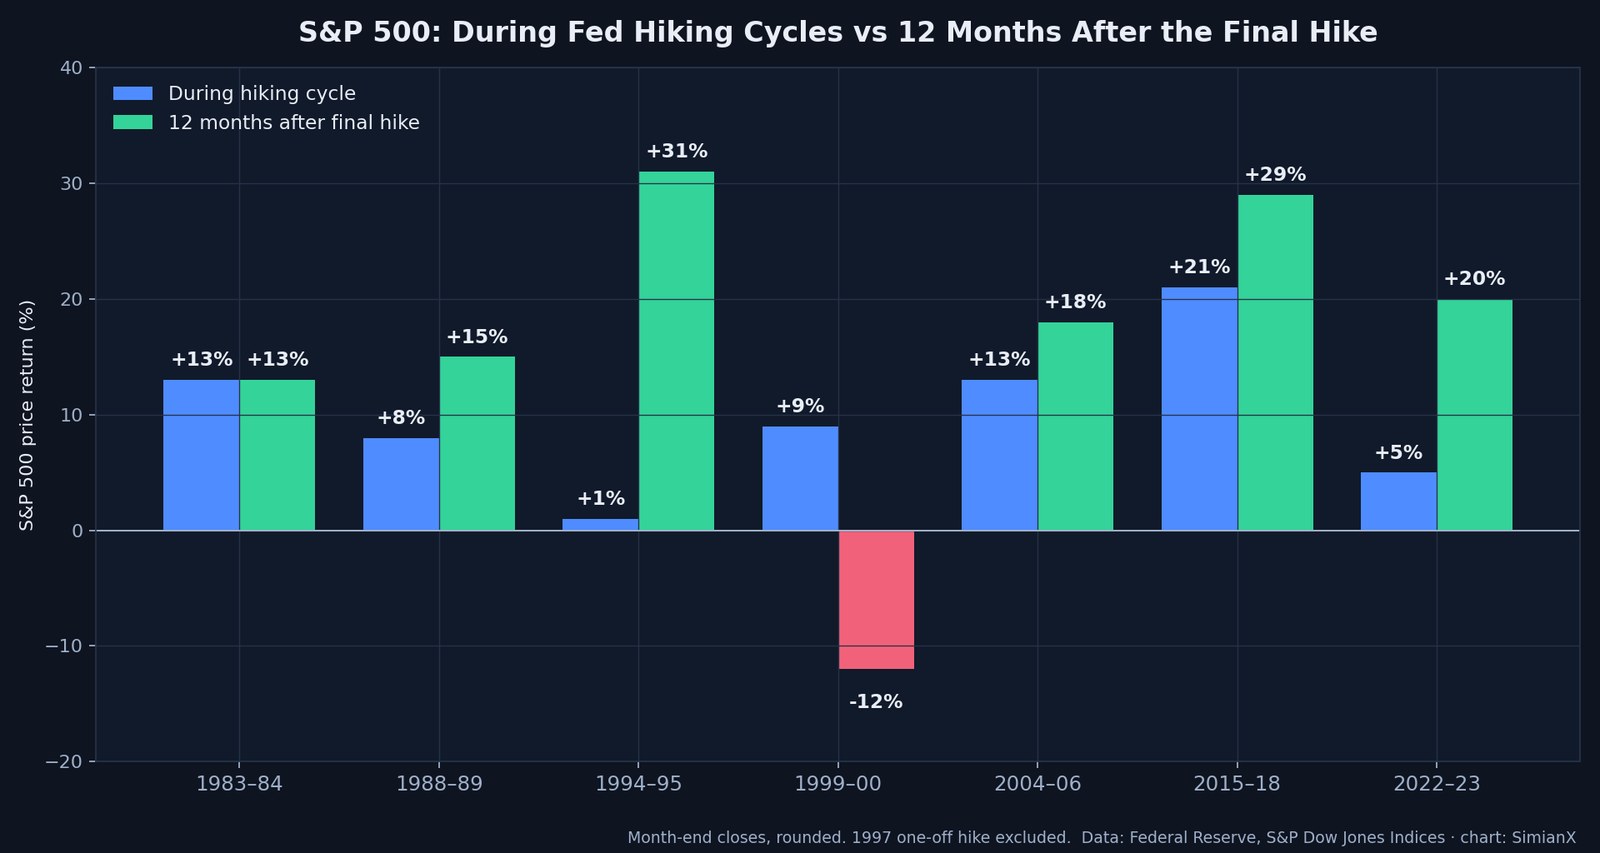
Во всех семи многозаседательных циклах повышения с 1983 года S&P 500 рос без единого исключения — в среднем примерно на +10% от конца месяца перед первым повышением до конца месяца последнего. Двенадцать месяцев после последнего повышения были ещё лучше: в среднем около +20%, положительный результат в семи случаях из восьми. Единственное исключение — 12 месяцев после мая 2000 года — было связано не столько с самими повышениями, сколько с пузырём, который они завершили.
Это средние значения. Путь выглядит хуже среднего: пять из восьми циклов включали двузначную просадку, пока ФРС ещё повышала ставку, а цикл 2022 года вместил 25-процентный медвежий рынок внутрь двухлетнего окна, которое в итоге всё равно оказалось положительным. Повышения ставки редко убивают бычий рынок сами по себе. Бычьи рынки убивает то, что повышения в конце концов обнажают, — переоценённость в 2000-м, избыточное кредитное плечо в 2007-м, риск дюрации в 2022-м.
Полная справочная таблица: каждый цикл повышения с 1983 года
| Цикл | Первое повышение | Последнее повышение | Траектория ставки | Шагов | S&P 500 за цикл | Худшая просадка | S&P 500 через 12 мес. после последнего шага |
|---|---|---|---|---|---|---|---|
| 1983–84 | март 1983 | авг. 1984 | 8,50% → 11,75% | ~10 шагов | +13% | ≈ −14% | +13% |
| 1988–89 | март 1988 | февр. 1989 | 6,50% → 9,75% | ~14 шагов | +8% | ≈ −8% | +15% |
| 1994–95 | 4 февр. 1994 | 1 февр. 1995 | 3,00% → 6,00% | 7 | +1% | ≈ −9% | +31% |
| 1997 (разовое) | 25 марта 1997 | 25 марта 1997 | 5,25% → 5,50% | 1 | — | — | +46% |
| 1999–2000 | 30 июня 1999 | 16 мая 2000 | 4,75% → 6,50% | 6 | +9% | ≈ −12% | −12% |
| 2004–06 | 30 июня 2004 | 29 июня 2006 | 1,00% → 5,25% | 17 | +13% | ≈ −8% | +18% |
| 2015–18 | 16 дек. 2015 | 19 дек. 2018 | 0,25% → 2,50% | 9 | +21% | ≈ −20% | +29% |
| 2022–23 | 16 марта 2022 | 26 июля 2023 | 0,25% → 5,50% | 11 | +5% | ≈ −25% | +20% |
Как читать таблицу: «S&P 500 за цикл» — это изменение цены от закрытия месяца перед первым повышением до закрытия месяца последнего повышения. «Через 12 мес.» отсчитывается от того же месячного закрытия. Все цифры — ценовая доходность (без дивидендов), округлённая до целого процентного пункта; просадки — приблизительное снижение от пика до дна внутри окна цикла. Границы циклов до 1994 года менее точны: до того года ФРС не объявляла изменения целевой ставки — подробности в методологических примечаниях внизу. Первоисточник каждого решения — собственный реестр операций на открытом рынке Федеральной резервной системы.
Две цифры заслуживают второго взгляда. Во-первых, 1994–95: S&P 500 целый год простоял на месте, пока ФРС удваивала ставку с 3% до 6%, — а затем принёс +31% за двенадцать месяцев после последнего повышения, дав старт великому бычьему рынку конца 90-х. Во-вторых, 2022–23: самое быстрое ужесточение с начала 1980-х породило самую глубокую внутрицикловую просадку в таблице, и всё же купивший в день первого повышения был в плюсе примерно на 5% к последнему шагу и более чем на 20% через два года.
Почему акции обычно растут, пока ФРС ужесточает политику
Закономерность кажется контринтуитивной, пока не вспомнишь, почему ФРС повышает ставку: потому что экономика перегревается. Циклы повышения накладываются на сильный номинальный рост, сильные прибыли и напряжённый рынок труда. Основную работу делают три механизма:
- Прибыли обгоняют сжатие мультипликаторов. Более высокие ставки сжимают оценочные мультипликаторы, но циклы повышения совпадают с экспансией прибылей. С 2004 по 2006 год коэффициент цена/прибыль S&P 500 фактически снизился, а индекс прибавил 13% — прибыли росли быстрее, чем поднималась ставка дисконтирования.
- Темп важнее уровня. Рынок быстро закладывает в цены конечную точку; больно бьёт неожиданность. Постепенные, заранее объявленные циклы (семнадцать подряд шагов по 25 базисных пунктов в 2004–06, девять повышений за три года в 2015–18) давали устойчивый рост. Жёсткие (внезапные 75 пунктов в 1994-м, четыре подряд по 75 в 2022-м) создали плоские и отрицательные участки таблицы.
- Точка старта имеет значение. Циклы, начинавшиеся с экстренно низких ставок (2015, 2022), вынудили сильнее всего переоценить активы длинной дюрации — поэтому две самые глубокие внутрицикловые просадки таблицы пришлись на два последних цикла.
В конечном счёте ставка по федеральным фондам — это тормоз, нажатый в разгоняющемся автомобиле. Сам тормоз редко становится причиной аварии; вопрос всегда в том, во что автомобиль вот-вот врезался бы.
Путь: сначала тряска, потом награда
Средние скрывают последовательность. Если наложить траектории S&P 500 от первого повышения пяти последних больших циклов, проступает устойчивый ритм: жёсткие первые шесть месяцев и решающий второй год.
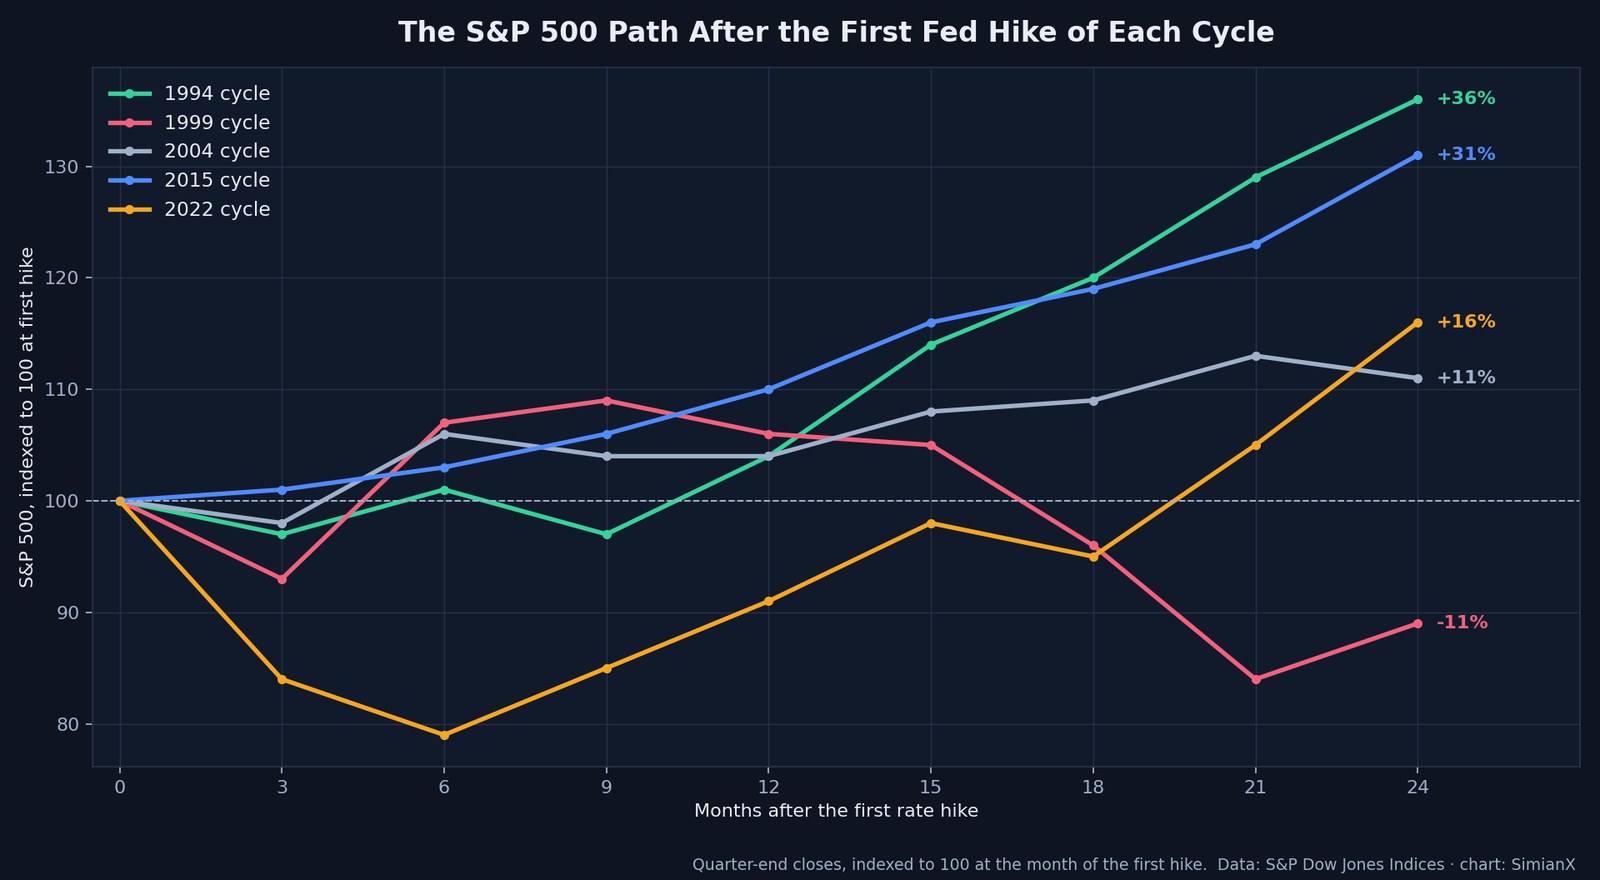
Через три месяца после первого повышения четыре из пяти циклов стояли на месте или были под водой; на шестом месяце цикл 2022 года терял 21%, а цикл 1994-го уже полностью переварил свою просадку в −9%. Но к 24-му месяцу четыре из пяти были выше — 1994-й на 36%, 2015-й на 31% — и единственным проигравшим оказался 1999-й, чья двухлетняя отметка пришлась на самый разгар краха доткомов. Если сжать эту историю в одну фразу: первые два квартала цикла повышения — это место, где живут просадки; награда, если приходит, приходит на второй год.
Этот ритм стоит держать рядом с нашей таблицей 20 худших дней в истории S&P 500 — многие из них, включая крах 1987 года и худшие дни 2022-го, случились, когда ФРС ужесточала политику или только что закончила.
Акции чипмейкеров: высокобетовый пассажир рынка
Полупроводники — самое чистое выражение циклического роста на фондовом рынке, и потому самый интересный сектор для наблюдения во время ужесточения. Индекс SOX появился лишь в декабре 1993 года, но уже пережил пять циклов повышения:
| Цикл | SOX за цикл | S&P 500 за цикл | Что происходило в чипах |
|---|---|---|---|
| 1994–95 | ≈ +30% | +1% | Бум ПК; дефицит памяти; полупроводники — сильнейшая группа рынка |
| 1999–2000 | ≈ +120% | +9% | Капексная мания доткомов и телекомов |
| 2004–06 | ≈ −5% | +13% | Переваривание после пузыря; чипы — мёртвые деньги |
| 2015–18 | ≈ +70% | +21% | Строительство облачных дата-центров; ранний спрос на обучение ИИ |
| 2022–23 | ≈ +10% | +5% | Обвал крипты и ПК в 2022-м (SOX ≈ −45% от пика до дна), затем момент ChatGPT |
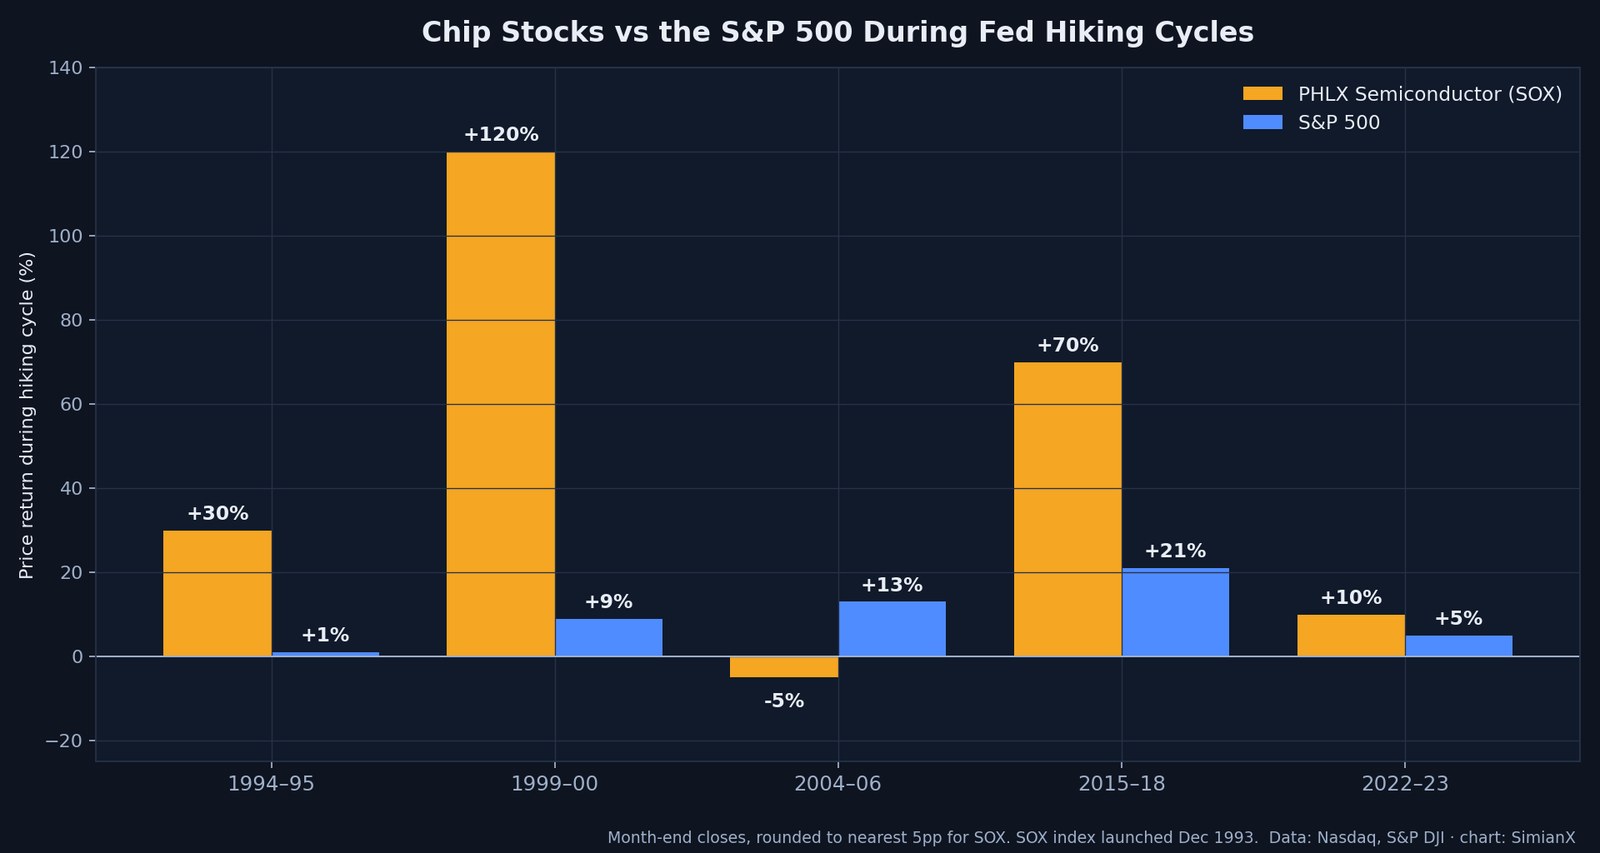
Урок: цикл капитальных затрат доминирует над циклом ставок. Когда идёт структурная стройка — ПК в 1994-м, интернет в 1999-м, облако в 2017-м, ИИ сегодня — акции чипмейкеров стряхивали сотни базисных пунктов ужесточения и обгоняли индекс на 30–110 процентных пунктов. Когда стройка переваривается (2004–06), не спасают ни дешёвые, ни дорогие деньги. Именно в этом напряжение 2026 года: расходы на ИИ-инфраструктуру остаются двигателем рынка, но они чувствительны к условиям финансирования, а NVIDIA (NVDA), Micron (MU), Broadcom (AVGO) и AMD теперь весят на уровне целого индекса. Сторону спроса этой ставки мы разобрали в глубоком разборе HBM3E от Micron и превью портфеля заказов ИИ-ASIC Broadcom, а сторону риска — в материале о расплате корейских ИИ-чипов, где страх перед ставками и концентрация в ИИ столкнулись за одну сессию.
Исключения, которые стоит запомнить: 1987, 2000 и 2022
У каждого правила этой таблицы есть три знаменитых стресс-теста.
1987. Строка таблицы относится к циклу 1988–89 годов, но ФРС ужесточала политику весь 1987 год — включая повышение учётной ставки за несколько недель до 19 октября, — когда S&P 500 рухнул на 20% за один день. Этот крах — вечное напоминание о том, что ужесточение на закредитованном и переполненном рынке способно быстро что-нибудь сломать, даже при здоровой экономике. Тем не менее индекс закончил 1987 год в небольшом плюсе, а последовавший цикл 1988–89 уложился в обычную закономерность.
2000. Единственные отрицательные «12 месяцев после» в таблице. Последнее повышение ФРС на 50 пунктов в мае 2000 года пришлось на два месяца после пика Nasdaq. Не повышения вызвали последовавший год с −12% — его вызвал пузырь, — но май 2000-го стал шаблоном медвежьего сценария: когда цикл повышения заканчивается потому, что что-то сломалось, а не потому, что инфляция побеждена, конец повышений — не конец проблем.
2022. Самая глубокая внутрицикловая просадка как минимум с 1983 года (−25%): самый быстрый темп ужесточения со времён Волкера плюс стартовая точка на нуле. И всё же окно цикла закрылось в плюсе, а 12 месяцев после последнего повышения в июле 2023 года принесли +20%. Даже худший современный цикл повышения в итоге вознаградил тех, кто остался в позиции.
Где окажется цикл Уорша 2026 года
К середине 2026 года ставка по федеральным фондам находится на уровне 3,50–3,75%, а июньская точечная диаграмма развернулась к прогнозу одного повышения — первый сигнал ужесточения от ФРС Уорша. Само заседание мы разобрали в материале первое заседание ФРС при Уорше: точечная диаграмма разворачивается к повышению, а реакцию рынка — в разборе июньского FOMC 2026 года.
Если цикл 2026 года действительно начнётся, исторические рифмы режут в обе стороны:
- Успокаивающая рифма: он стартует, как 1994-й и 2015-й, при сильной экономике и сильных прибылях — именно эти конфигурации дали +31% и +29% за следующие двенадцать месяцев. Повышение с 3,75% — к тому же куда меньший пропорциональный шок, чем взлёт с нуля в 2022-м.
- Неудобная рифма: он приземлится на рынок с рекордной концентрацией индекса в семи мегакомпаниях, связанных с ИИ, и на капексный бум, построенный на предположении о дешёвом капитале, — ближе к сценарию 1999 года, когда сектор, тянувший рынок вверх, был и самым уязвимым к финальной переоценке.
Честное резюме истории: первые повышения обычно оказываются испугом, который можно покупать; середина цикла — тряска; а настоящий риск приходит лишь тогда, когда ФРС вынуждена повышать до тех пор, пока что-нибудь не сломается. Следите за темпом, а не за первым заголовком.
Как отслеживать цикл повышения с SimianX
Справочная таблица даёт базовые вероятности, но не может следить за рынком вместо вас. Живой командный центр SimianX транслирует анализ ИИ-агентов в каждый день заседаний FOMC, а наши автопилоты выполняют мультиагентные стратегии, корректирующие экспозицию при смене макроусловий, — как на самом деле позиционированы 30 ИИ-моделей от 6 провайдеров, видно в рейтинге ИИ-моделей. Если макрокартину удобнее получать, чем караулить, ежедневный автодайджест сводит четырёх агентов в один утренний брифинг. Циклы ставок двигают и крипторынок — для обратного направления у нас есть парная таблица динамики Bitcoin после каждого снижения ставки ФРС с 2019 года, а тарифы начинаются с бесплатного.
Частые вопросы
Растут ли акции, когда ФРС повышает ставку?
Исторически — да. S&P 500 рос во всех семи многозаседательных циклах повышения с 1983 года, в среднем примерно на +10% от первого до последнего шага. Но в этих средних спрятаны двузначные просадки по пути в пяти циклах из восьми — финиш положительный, дорога неприятная.
Что происходит с рынком после последнего повышения ФРС?
Двенадцать месяцев после последнего повышения приносили в среднем около +20% по восьми циклам с 1983 года, с положительным результатом в семи случаях из восьми. Исключение — май 2000-го, когда цикл закончился прямо на лопающемся пузыре.
Стоит ли продавать акции, когда ФРС начинает повышать ставку?
История против продажи на первом повышении: через два года после первых шагов 1994, 2004, 2015 и 2022 годов S&P 500 каждый раз был выше — единственный проигравший на двухлетнем горизонте это 1999-й. При этом первые шесть месяцев почти всегда были самым жёстким отрезком, так что статистика на стороне терпения, а не паники или плеча.
Как ведут себя акции полупроводников во время повышения ставок?
Решает цикл капзатрат в чипах, а не цикл ставок. SOX обгонял S&P 500 на 30–110 процентных пунктов в циклах 1994, 1999 и 2015 годов, когда шли структурные стройки; сильно отставал в переваривании 2004–06; а в 2022–23 успел и то и другое — обвал на 45%, затем восстановление на волне ИИ.
Повысит ли ФРС ставку в 2026 году?
По итогам июньского заседания FOMC 2026 года ставка находится на уровне 3,50–3,75%, а точечная диаграмма закладывает одно повышение в 2026 году — это прогноз, а не обещание. Календарь заседаний и прогнозы публикует сама ФРС; что именно изменилось, разбирает наш материал о июньском FOMC 2026.
Методология и примечания к данным
- Определение цикла: цикл повышения — последовательность подъёмов целевой ставки по федеральным фондам без промежуточного снижения. Даты с 1994 года — точные даты решений FOMC из реестра операций ФРС на открытом рынке; границы 1983–84 и 1988–89 определены по эффективной ставке, поскольку до 1994 года целевые уровни не объявлялись. Разовое повышение марта 1997 года вынесено отдельной строкой.
- Соглашение о доходности: ценовая доходность S&P 500 (без дивидендов), от месячного закрытия к месячному закрытию — от последнего закрытия перед первым повышением до закрытия месяца последнего шага и далее на 12 месяцев вперёд. График траекторий использует квартальные закрытия, приведённые к 100.
- Просадки — приблизительные максимальные снижения от пика до дна по дневным закрытиям внутри каждого окна, округлённые.
- Данные SOX используют ту же месячную привязку с округлением до ближайших 5 процентных пунктов; индекс запущен в декабре 1993 года, по более ранним циклам данных нет.
- Источники: Совет управляющих ФРС, S&P Dow Jones Indices, Nasdaq. Составлено в июле 2026 года. Материал носит информационный характер и не является инвестиционной рекомендацией.
Читайте также
- Все циклы снижения ставки ФРС с 1980 года: акции, облигации и золото
- Первое заседание ФРС при Уорше, 2026: точечная диаграмма разворачивается к повышению
- Решение FOMC в июне 2026 года: точечная диаграмма, акции ИИ и Bitcoin
- 20 худших дней в истории S&P 500 — и что было потом
- Шатдауны правительства и фондовый рынок, 1976–2026
- «Великолепная семёрка» в 2026 году: веса и риск концентрации