
Gold Prices by Year Since the End of the $35 Peg: Year-End Price and Annual Return
Updated October 2026. Data through the LBMA Gold Price PM of October 15, 2026. The 2026 row will be finalized after the last London PM price of 2026.
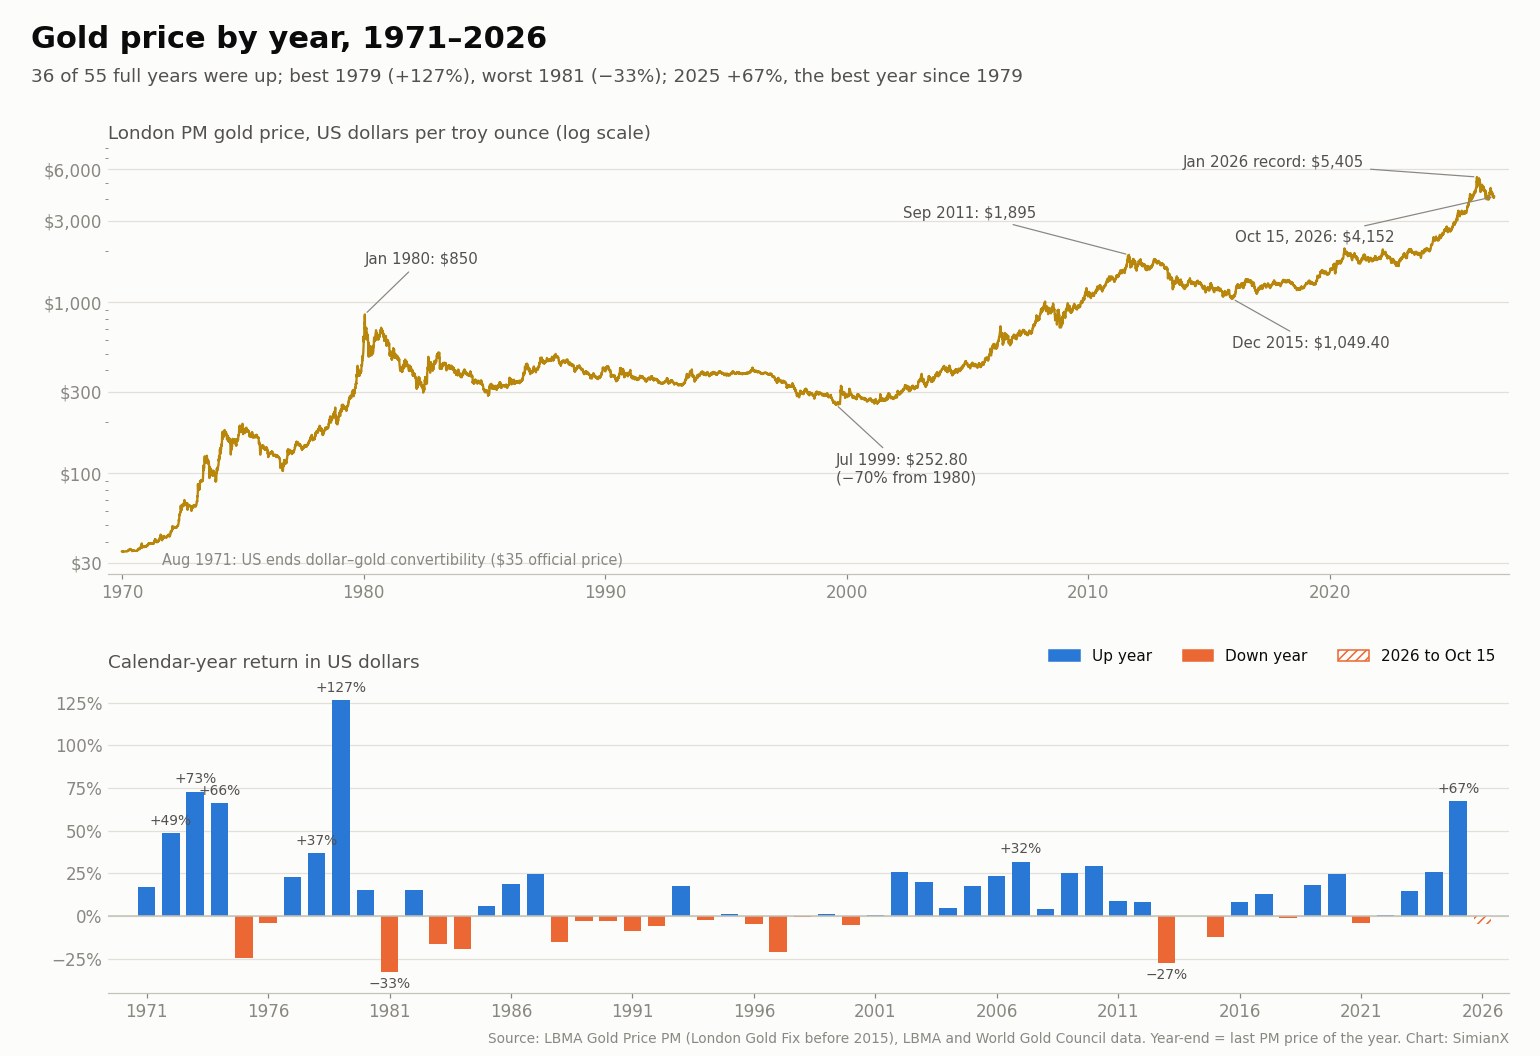
Short answer: Gold ended 2025 at $4,367.80 an ounce (LBMA Gold Price PM, December 30), up 67.4%, its best year since 1979. On October 15, 2026 it was $4,152.25, down 4.9% for the year and 23.2% below the record of $5,405.00 set on January 29, 2026. From the end of 1970 ($37.38) to the end of 2025 gold compounded at 9.0% a year and rose in 36 of 55 years. Best year: 1979, +126.5%. Worst: 1981, −32.6%.
This page lists the gold price by year for every calendar year since 1971, the year the United States stopped converting dollars into gold, plus 2026 to date. For each year it gives the year-end London price in US dollars per troy ounce, the calendar-year return, the average price of the year and the S&P 500's return in the same year. It also ranks the best and worst years, compares gold with the S&P 500 decade by decade, lists every decline of 20% or more, and shows how the same gold returns look in 15 other currencies. Every year-end price is the official London benchmark, checked against at least two independent data sets.
Gold price history at a glance
| Measure (calendar-year return in USD) | 1971–2025 | 1981–2025 | 2001–2025 | 2016–2025 |
|---|---|---|---|---|
| Years | 55 | 45 | 25 | 10 |
| Up years | 36 (65%) | 28 (62%) | 21 (84%) | 8 (80%) |
| Average (arithmetic) | +11.8% | +6.1% | +13.1% | +16.7% |
| Median | +8.1% | +4.3% | +12.7% | +13.6% |
| Compound annual growth | +9.0% | +4.6% | +11.7% | +15.2% |
| Standard deviation | 26.8 pts | 18.0 pts | 17.7 pts | 19.6 pts |
| Best year | 1979 (+127%) | 2025 (+67.4%) | 2025 (+67.4%) | 2025 (+67.4%) |
| Worst year | 1981 (−32.6%) | 1981 (−32.6%) | 2013 (−27.3%) | 2021 (−4.3%) |
The long-run figure hides two very different regimes. In the 1970s, after the dollar's link to gold was cut, the price rose from $37.38 to $512.00 in nine years. Then came two decades in which gold mostly fell: from the end of 1980 to the end of 2000 it lost money in 13 of 20 years. Since 2001 the pattern has reversed again, with 21 up years out of 25 and a compound return of 11.7% a year. The median year (+8.1%) has been weaker than the average (+11.8%), because a handful of huge gains in the 1970s and in 2025 pull the average up.
Gold price by year: the complete table, 1971–2026
| Year | Year-end price (USD/oz) | Gold return | Average price (USD/oz) | S&P 500 (price return) |
|---|---|---|---|---|
| 2026 (to Oct 15) | $4,152.25 | −4.9% | $4,522.73 | +13.1% |
| 2025 | $4,367.80 | +67.4% | $3,431.54 | +16.4% |
| 2024 | $2,609.10 | +25.5% | $2,386.20 | +23.3% |
| 2023 | $2,078.40 | +14.6% | $1,940.54 | +24.2% |
| 2022 | $1,813.75 | +0.4% | $1,800.09 | −19.4% |
| 2021 | $1,805.85 | −4.3% | $1,798.61 | +26.9% |
| 2020 | $1,887.60 | +24.6% | $1,769.59 | +16.3% |
| 2019 | $1,514.75 | +18.4% | $1,392.60 | +28.9% |
| 2018 | $1,279.00 | −0.9% | $1,268.49 | −6.2% |
| 2017 | $1,291.00 | +12.7% | $1,257.15 | +19.4% |
| 2016 | $1,145.90 | +8.1% | $1,250.80 | +9.5% |
| 2015 | $1,060.00 | −12.1% | $1,160.06 | −0.7% |
| 2014 | $1,206.00 | +0.1% | $1,266.40 | +11.4% |
| 2013 | $1,204.50 | −27.3% | $1,411.23 | +29.6% |
| 2012 | $1,657.50 | +8.3% | $1,668.98 | +13.4% |
| 2011 | $1,531.00 | +8.9% | $1,571.52 | −0.0% |
| 2010 | $1,405.50 | +29.2% | $1,224.52 | +12.8% |
| 2009 | $1,087.50 | +25.0% | $972.35 | +23.5% |
| 2008 | $869.75 | +4.3% | $871.96 | −38.5% |
| 2007 | $833.75 | +31.9% | $695.39 | +3.5% |
| 2006 | $632.00 | +23.2% | $603.77 | +13.6% |
| 2005 | $513.00 | +17.8% | $444.45 | +3.0% |
| 2004 | $435.60 | +4.6% | $409.17 | +9.0% |
| 2003 | $416.25 | +19.9% | $363.32 | +26.4% |
| 2002 | $347.20 | +25.6% | $309.68 | −23.4% |
| 2001 | $276.50 | +0.7% | $271.04 | −13.0% |
| 2000 | $274.45 | −5.4% | $279.10 | −10.1% |
| 1999 | $290.25 | +0.9% | $278.57 | +19.5% |
| 1998 | $287.80 | −0.8% | $294.09 | +26.7% |
| 1997 | $290.20 | −21.4% | $331.29 | +31.0% |
| 1996 | $369.25 | −4.6% | $387.87 | +20.3% |
| 1995 | $387.00 | +1.0% | $384.05 | +34.1% |
| 1994 | $383.25 | −2.2% | $384.15 | −1.5% |
| 1993 | $391.75 | +17.7% | $359.82 | +7.1% |
| 1992 | $332.90 | −5.7% | $343.95 | +4.5% |
| 1991 | $353.15 | −8.6% | $362.26 | +26.3% |
| 1990 | $386.20 | −3.1% | $383.56 | −6.6% |
| 1989 | $398.60 | −2.8% | $380.82 | +27.3% |
| 1988 | $410.25 | −15.3% | $436.86 | +12.4% |
| 1987 | $484.10 | +24.5% | $446.22 | +2.0% |
| 1986 | $388.75 | +19.0% | $367.85 | +14.6% |
| 1985 | $326.80 | +6.0% | $317.30 | +26.3% |
| 1984 | $308.30 | −19.4% | $360.78 | +1.4% |
| 1983 | $382.40 | −16.3% | $423.66 | +17.3% |
| 1982 | $456.90 | +14.9% | $375.30 | +14.8% |
| 1981 | $397.50 | −32.6% | $459.26 | −9.7% |
| 1980 | $589.75 | +15.2% | $614.50 | +25.8% |
| 1979 | $512.00 | +127% | $304.68 | +12.3% |
| 1978 | $226.00 | +37.0% | $193.44 | +1.1% |
| 1977 | $164.95 | +22.6% | $147.79 | −11.5% |
| 1976 | $134.50 | −4.1% | $124.77 | +19.1% |
| 1975 | $140.25 | −24.8% | $160.88 | +31.5% |
| 1974 | $186.50 | +66.1% | $158.85 | −29.7% |
| 1973 | $112.25 | +73.0% | $97.32 | −17.4% |
| 1972 | $64.90 | +48.8% | $58.23 | +15.6% |
| 1971 | $43.63 | +16.7% | $40.82 | +10.8% |
| 1970 | $37.38 | — | $35.95 | — |
Notes: the year-end price is the last LBMA Gold Price PM of the calendar year, set in London at 3:00 p.m. There is usually no afternoon auction on December 31, so the last price is often dated December 28, 29 or 30 (December 30 in 2025). Before March 20, 2015 the benchmark was the London Gold Fixing; the LBMA Gold Price replaced it. The average is the mean of all PM prices in the year. The 1970 row is the starting point for the 1971 return. Down years are in bold. The S&P 500 column is the index's price return from our S&P 500 returns by year table.
Before 1971: the $35 era
For almost four decades before this table starts, gold did not have a market price in the modern sense. The Gold Reserve Act of 1934 raised the official price from $20.67 to $35 an ounce, and under the Bretton Woods system the United States promised to convert dollars held by foreign governments into gold at that rate. To hold the London market price near $35, eight central banks pooled their gold in the London Gold Pool during the 1960s. The pool collapsed in March 1968, and a two-tier market followed: central banks kept trading at $35 among themselves, while the private London price was allowed to float. That is why the free-market price was already $37.38 at the end of 1970.
On August 15, 1971 President Nixon closed the gold window, ending the dollar's convertibility into gold. The Smithsonian Agreement of December 1971 set a new official price of $38, and a second devaluation in February 1973 took it to about $42, but by then the market price was far above both. US citizens, whose private holdings of gold had been restricted since 1933, were allowed to own it again from the end of 1974. So 1971 is the first year in which gold's price reflects supply and demand without an official peg behind it, and 1970 is the natural starting point for measuring returns.
The best and worst years for gold
| Rank | Best year | Return | Worst year | Return |
|---|---|---|---|---|
| 1 | 1979 | +127% | 1981 | −32.6% |
| 2 | 1973 | +73.0% | 2013 | −27.3% |
| 3 | 2025 | +67.4% | 1975 | −24.8% |
| 4 | 1974 | +66.1% | 1997 | −21.4% |
| 5 | 1972 | +48.8% | 1984 | −19.4% |
| 6 | 1978 | +37.0% | 1983 | −16.3% |
| 7 | 2007 | +31.9% | 1988 | −15.3% |
| 8 | 2010 | +29.2% | 2015 | −12.1% |
| 9 | 2002 | +25.6% | 1991 | −8.6% |
| 10 | 2024 | +25.5% | 1992 | −5.7% |
Five of the ten best years fell in the 1970s, when inflation and the end of the dollar's gold link drove the price up more than thirteenfold. 1979 was the single best year, +126.5%, as the price more than doubled to $512.00; on January 21, 1980 the London PM price reached $850.00. 2025 ranks third, at +67.4%: gold set 53 record PM prices during the year and peaked at $4,449.40 on December 23. Seven of the ten worst years came between 1981 and 1997, the long decline after the 1980 peak. The deepest losses were 1981 (−32.6%), as high US interest rates made non-yielding gold less attractive, and 2013 (−27.3%).
How often does the gold price fall in a year?
Gold fell in 19 of the 55 years from 1971 to 2025, about one year in three; it has gone up in 65% of years, close to the S&P 500's 67% since 1928. The down years cluster. The longest losing streak was five years, from 1988 to 1992, and the price also fell in 1996, 1997 and 1998 in a row. The longest winning streak was 12 consecutive up years, from 2001 to 2012, during which the price rose from $276.50 to $1,657.50. The current streak, 2022 to 2025, is four years long; 2026 is negative so far.
Most of gold's down years were small. Only eight of the 19 were worse than −10% (1975, 1981, 1983, 1984, 1988, 1997, 2013 and 2015), and none was worse than −33%, while the S&P 500 has had calendar years of −47% (1931) and −38.5% (2008).
Every decline of 20% or more since 1971
| Peak (LBMA PM) | Low | Decline | Back above the peak | Peak to recovery |
|---|---|---|---|---|
| Jul 6, 1973: $127.00 | Nov 14, 1973: $90.00 | −29.1% | Jan 17, 1974 | 6 months |
| Apr 3, 1974: $179.50 | Jul 4, 1974: $129.00 | −28.1% | Nov 8, 1974 | 7 months |
| Dec 30, 1974: $195.25 | Aug 25, 1976: $103.50 | −47.0% | Jul 28, 1978 | 3.6 years |
| Oct 30, 1978: $242.75 | Nov 30, 1978: $193.40 | −20.3% | Feb 5, 1979 | 4 months |
| Jan 21, 1980: $850.00 | Jul 20, 1999: $252.80 | −70.3% | Jan 3, 2008 | 28.0 years |
| Mar 17, 2008: $1,011.25 | Oct 24, 2008: $712.50 | −29.5% | Sep 16, 2009 | 18 months |
| Sep 5, 2011: $1,895.00 | Dec 17, 2015: $1,049.40 | −44.6% | Jul 24, 2020 | 8.8 years |
| Aug 6, 2020: $2,067.15 | Nov 3, 2022: $1,628.75 | −21.2% | Dec 27, 2023 | 3.3 years |
| Jan 29, 2026: $5,405.00 | Jul 16, 2026: $3,993.55 | −26.1% | not yet | — |
Calendar-year returns understate how far gold can fall inside a cycle. Measured on daily London PM prices, the price has dropped by 20% or more from a record nine times since 1971. The deepest was the fall from $850.00 on January 21, 1980 to $252.80 on July 20, 1999, a decline of 70.3%; the 1980 price was not regained until January 3, 2008, 28 years later. The 2011 peak of $1,895.00 took nearly nine years to recover. The latest decline started at the record of $5,405.00 on January 29, 2026 and reached $3,993.55 on July 16, 2026 (−26.1%); on October 15 the price was still 23.2% below the record. The background to that fall is covered in our gold H2 2026 outlook.
Gold vs. the S&P 500 by decade
| Period | Gold, compound annual | S&P 500, compound annual (price) | Gold, cumulative | S&P 500, cumulative | Gold up years | Years gold beat the S&P 500 |
|---|---|---|---|---|---|---|
| 1971–1979 | +33.7% | +1.8% | +1,270% | +17.1% | 7 of 9 | 7 of 9 |
| 1980s | −2.5% | +12.6% | −22.1% | +227% | 5 of 10 | 3 of 10 |
| 1990s | −3.1% | +15.3% | −27.2% | +316% | 3 of 10 | 2 of 10 |
| 2000s | +14.1% | −2.7% | +275% | −24.1% | 9 of 10 | 8 of 10 |
| 2010s | +3.4% | +11.2% | +39.3% | +190% | 7 of 10 | 3 of 10 |
| 2020–2025 | +19.3% | +13.3% | +188% | +112% | 5 of 6 | 4 of 6 |
| 1971–2025 (all years) | +9.0% | +8.1% | +11,585% | +7,329% | 36 of 55 | 27 of 55 |
Over the whole period from 1971 to 2025 gold edged out the S&P 500's price return, 9.0% a year against 8.1%, and $100 in gold at the end of 1970 grew to about $11,685 by the end of 2025, compared with about $7,429 in the index (before dividends). But the two almost never did well at the same time. Gold won the 1970s by a wide margin and the 2000s, the decade of two stock bear markets; stocks won the 1980s, 1990s and 2010s, when gold fell or barely rose. Gold beat the index in 27 of the 55 years, and in the 14 years when the S&P 500 fell, gold rose in eight: 1973, 1974, 1977, 2001, 2002, 2008, 2011 and 2022. In 2008, when the index lost 38.5%, gold gained 4.3%.
Dividends change the picture. The S&P 500's total return, with dividends reinvested, is published by two data vendors only from 1989. From 1989 to 2025 gold compounded at 6.6% a year, the S&P 500's price return at 9.0% and its total return at 11.3%. Gold pays no income, so over long periods stocks have usually come out ahead once dividends are counted, and gold's case rests on how it behaves in the years when stocks do badly. How it held up in each recession is in our gold safe-haven scorecard, and how it behaved in every Fed easing cycle is in our rate-cut cycle study.
Gold returns in 15 other currencies
| Currency | Period | Gold, compound annual in that currency | Gold, compound annual in US dollars | 2025 return in that currency |
|---|---|---|---|---|
| US dollar | 1971–2025 | +9.0% | +9.0% | +67.4% |
| Turkish lira | 1971–2025 | +42.9% | +9.0% | +104% |
| Russian ruble | 1993–2025 | +26.7% | +8.1% | +28.8% |
| Indonesian rupiah | 1971–2025 | +16.8% | +9.0% | +73.8% |
| Brazilian real | 1995–2025 | +14.9% | +8.2% | +48.8% |
| Indian rupee | 1971–2025 | +14.1% | +9.0% | +75.8% |
| Philippine peso | 1971–2025 | +13.5% | +9.0% | +69.7% |
| Korean won | 1971–2025 | +12.1% | +9.0% | +63.7% |
| Vietnamese dong | 1990–2025 | +11.7% | +6.9% | +72.6% |
| Chinese yuan | 1971–2025 | +11.1% | +9.0% | +60.5% |
| Euro (peseta before 1999) | 1971–2025 | +10.5% | +9.0% | +47.8% |
| Thai baht | 1971–2025 | +9.8% | +9.0% | +53.5% |
| Euro (franc before 1999) | 1971–2025 | +9.0% | +9.0% | +47.8% |
| New Taiwan dollar | 1971–2025 | +8.6% | +9.0% | +60.8% |
| Euro (Deutsche Mark before 1999) | 1971–2025 | +7.5% | +9.0% | +47.8% |
| Japanese yen | 1971–2025 | +7.4% | +9.0% | +66.3% |
The dollar return is only one way to measure gold. For an investor in a currency that lost value against the dollar, gold did much better in local terms: in Turkish lira gold compounded at 42.9% a year from 1971 to 2025, in Indonesian rupiah at 16.8% and in Indian rupees at 14.1%, against 9.0% in dollars. In currencies that gained against the dollar, the result was weaker: in Japanese yen gold returned 7.4% a year and in euros measured through the Deutsche Mark 7.5%. In 2025, gold rose 104% in Turkish lira but 47.8% in euros, because the euro rose against the dollar that year. The local-currency figures convert the London dollar price at each year-end market exchange rate; the translated versions of this page carry the full year-by-year table for each currency in the unit people in that country use, from rupiah per gram to Thai baht per baht-weight and dong per lượng. These are spot-equivalent values, not local shop prices, which include taxes, import duties and dealer premiums.
2026 so far
Through October 15, 2026, the LBMA Gold Price PM stood at $4,152.25, down 4.9% from its 2025 year-end price of $4,367.80. The year began with a sharp rally: gold set 12 new records in January, the last at $5,405.00 on January 29. It then fell to $3,993.55 on July 16, a decline of 26.1% from the record and the largest since the 2011–2015 bear market. The average PM price so far in 2026, $4,522.73, is still the highest of any year. Over the same period the S&P 500 gained 13.1%. After an annual gain of 67.4% in 2025, a flat or negative following year would not be unusual: after its other gains of more than 45% (1972, 1973, 1974 and 1979), gold rose in the next year three times and fell once, in 1975 (−24.8%).
How to read gold's historical returns
- Year-end prices depend on the benchmark and the date. The London PM price, the spot price at the New York close and the COMEX futures settlement can differ by 1% or more on the same day. Our Bitcoin returns by year page compares gold using the December 31 spot close, which gives +64.5% for 2025; the LBMA PM benchmark gives +67.4% because the last 2025 auction took place on December 30, before a drop on December 31.
- Nominal, not inflation-adjusted. All figures are in current dollars. US consumer prices rose roughly eightfold from December 1970 to December 2025 (CPI-U, FRED CPIAUCNS), so a large part of gold's 9.0% annual return was inflation; see our CPI page for the latest inflation data.
- No income, no costs. Gold pays no dividend or interest. Holders of gold ETFs such as the SPDR Gold Trust (GLD) pay an annual management fee, and buyers of bars and coins pay dealer premiums and storage.
- Start dates matter. An investor who bought at the January 1980 high of $850 waited 28 years to break even; one who bought at the end of 2000 multiplied the money almost sixteenfold by the end of 2025.
Frequently asked questions
What was the price of gold each year?
At the end of each decade year, the London PM price was: 1970 $37.38, 1980 $589.75, 1990 $386.20, 2000 $274.45, 2010 $1,405.50, 2020 $1,887.60. At the end of 2025 it was $4,367.80, and on October 15, 2026 $4,152.25. The full table above lists every year.
What was gold's best year?
1979, when the price rose 126.5% to $512.00. The second best was 1973 (+73.0%) and the third 2025 (+67.4%). The worst year was 1981 (−32.6%), followed by 2013 (−27.3%).
What is gold's average annual return?
From the end of 1970 to the end of 2025 gold compounded at 9.0% a year in US dollars; the arithmetic average of the 55 yearly returns was 11.8% and the median 8.1%. Since 2001 the compound rate has been 11.7% a year.
Has gold beaten the S&P 500?
On price alone, narrowly: 9.0% a year against 8.1% from 1971 to 2025. Including dividends, which can be measured with two independent sources from 1989, the S&P 500 returned 11.3% a year and gold 6.6%. Gold beat the index in 27 of 55 years and rose in eight of the 14 years the index fell.
What is the highest gold price ever?
The record LBMA Gold Price PM is $5,405.00 an ounce, set on January 29, 2026. The highest year-end price is $4,367.80, at the end of 2025.
How much did gold go up in 2025?
67.4%, from $2,609.10 to $4,367.80, with 53 record PM prices during the year. It was gold's best calendar year since 1979 and its fourth consecutive annual gain.
Is the price on this page the price I pay in a shop?
No. It is the wholesale London benchmark for a troy ounce (31.1035 grams) of gold traded in large bars of at least 99.5% purity. Coins, small bars and jewellery sell at a premium, and in many countries taxes and import duties are added. The translated pages explain the typical local premium for each market.
When is this page updated?
After the last London PM price of each year, when the 2026 row becomes a full year, and with a refreshed 2026-to-date figure during the year.
Methodology and sources
- Gold prices are the LBMA Gold Price PM in US dollars per troy ounce (the London Gold Fixing before March 20, 2015), administered by ICE Benchmark Administration and published by the LBMA. The daily history was taken from the LBMA's own price file (archived copy of September 28, 2026); prices after September 25, 2026 come from the World Gold Council, which republishes the same benchmark.
- Cross-checks. Every year-end price from 1970 to 2020 matches the London PM series formerly published by the Federal Reserve Bank of St. Louis (FRED, GOLDPMGBD228NLBM; discontinued in 2022, archived copy of March 2021). The World Gold Council's daily series matches every year-end from 1975 to 2025 within 0.3 point of annual return (its 1970–1974 data are monthly averages, so it is not used for those years; one difference: 1984, $309.00 vs. the LBMA's $308.30). From 2000, the year-end spot price (CNBC, XAU=) and COMEX futures (Yahoo Finance, GC=F) give annual returns within 3 points of the benchmark, the gaps coming from the different closing dates.
- Returns are calendar-year changes from one year-end PM price to the next. The 2026 figure runs to October 15, 2026. Averages are arithmetic means; compound growth is the geometric mean; the standard deviation is the population standard deviation of yearly returns. Declines are measured on daily PM prices from a record to the lowest price before the record was regained.
- S&P 500 figures are the price and total returns from our S&P 500 returns by year table (Yahoo Finance ^GSPC and ^SP500TR, cross-checked with CNBC).
- Other currencies convert the year-end PM price at the exchange rate of the same day (or the official end-December rate where no daily series exists): FRED H.10 rates, the IMF's end-of-period official rates, the ECB reference rates, and the Turkish, Russian, Brazilian, Philippine and Taiwanese central banks, with a second source checked for every year where one exists. Euro figures before 1999 use the Deutsche Mark, French franc or Spanish peseta at the irrevocable conversion rates.
- Historical context: Federal Reserve History essays on the Gold Reserve Act, the London Gold Pool, the end of convertibility and the Smithsonian Agreement.
- Data compiled October 16, 2026. This page is for information only and is not investment advice.
Related Reading
- Gold in Every US Recession Since 1973: Safe-Haven Scorecard
- Gold H2 2026 Outlook: Why $4,000 Held as War Escalated
- S&P 500 Returns by Year: Every Year 1928–2026 Table
- Bitcoin Returns by Year: Every Year 2011–2026 Table
- Every Fed Rate-Cut Cycle Since 1980: Stocks, Bonds & Gold
- Dow Jones Returns by Year: Every Year 1915–2026 Table
- Nasdaq Returns by Year: Every Year 1972–2026 Table
- US Dollar Rate History by Year: 14 Currencies Since 1971
- Market history: all SimianX reference pages
References
- LBMA — Precious metal prices (LBMA Gold Price)
- ICE Benchmark Administration — LBMA Gold Price
- World Gold Council — Gold prices
- CNBC — Gold spot price (XAU=)
- Yahoo Finance — Gold futures (GC=F)
- Federal Reserve History — Nixon ends convertibility of US dollars to gold
- Federal Reserve History — Gold Reserve Act of 1934
- Federal Reserve History — The London Gold Pool
- Federal Reserve History — The Smithsonian Agreement
- MeasuringWorth — The price of gold