SK Hynix Stock Surges 8%: Is the AI Memory Supercycle Just Getting Started?
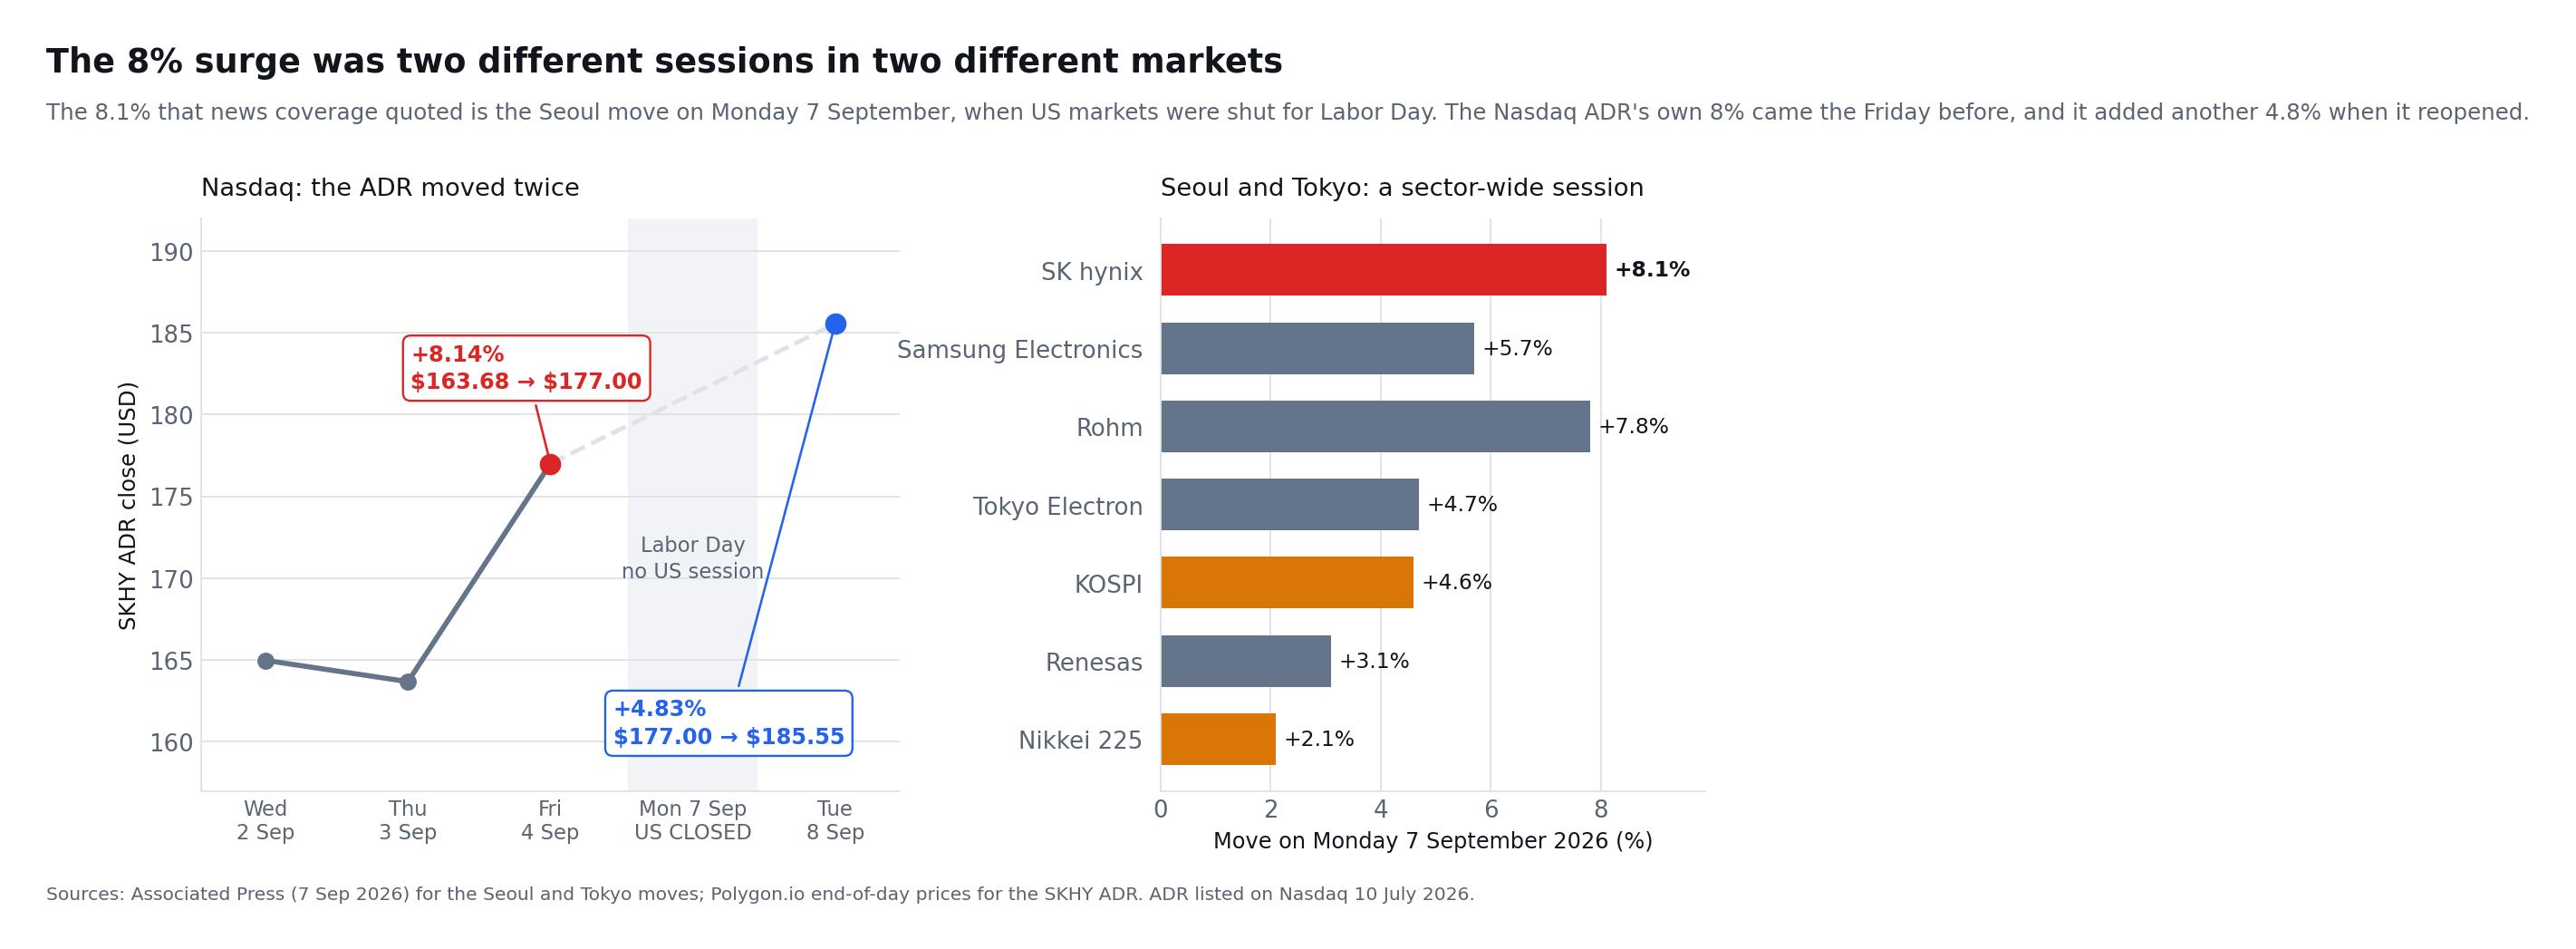
SK Hynix stock surged more than 8% on Monday 7 September 2026 — in Seoul. The distinction matters more than it sounds, because United States markets were closed that day for Labor Day. The Korean-listed shares closed at approximately KRW1.783 million, and it is this Seoul session that produced the 8.1% figure quoted in most coverage. Associated Press
The Nasdaq-listed American depositary shares ran on their own clock. SKHY closed at $177.00 on Friday 4 September, up 8.14% from $163.68 the day before, then added a further 4.83% to $185.55 when US trading resumed on Tuesday 8 September. So the widely repeated "8% surge" is really two separate sessions in two separate markets, and an investor reading the headline on Monday could not have bought the ADR at all.
The move was part of a broader semiconductor rally rather than the result of one isolated corporate announcement. Samsung Electronics climbed 5.7%, Korea's KOSPI jumped 4.6% to 6,995.39 and Japan's Nikkei 225 added 2.1% to 66,399.84. Rohm rose 7.8%, Tokyo Electron 4.7% and Renesas 3.1%. Renewed enthusiasm for increasingly memory-intensive AI models helped reinforce the idea that high-bandwidth memory, or HBM, remains one of the most important bottlenecks in the global AI supply chain.
But one strong trading session does not prove that the cycle will continue indefinitely. SK Hynix is producing extraordinary profits, shipping HBM4, returning capital to shareholders and benefiting from tight DRAM supply. At the same time, Samsung is recovering market share, Micron is expanding HBM shipments, capital expenditure is rising and SK Hynix's stock has already delivered enormous gains.
For investors using SimianX AI to study real-time fundamentals, market sentiment and technical signals, the central question is no longer whether AI needs more memory. It is whether AI memory demand can grow fast enough to support today’s earnings, new capacity and elevated investor expectations.
What Caused the 8% SK Hynix Stock Surge?
SK Hynix’s September 7 advance appears to have been driven by several mutually reinforcing developments:
- A global rebound in semiconductor and AI infrastructure stocks.
- Renewed optimism about the computing requirements of advanced AI models.
- Evidence that DRAM inventories remain unusually low.
- Rising prices for conventional server memory.
- Strong demand for HBM3E, HBM4 and high-capacity server modules.
- A recently announced KRW40 trillion share-repurchase program.
- Greater access for international investors following SK Hynix’s Nasdaq ADR listing.
The Associated Press reported the Seoul and Tokyo moves directly: SK Hynix surged 8.1% and Samsung 5.7% as semiconductor shares rallied across both markets. The synchronised rise in Samsung, Japanese equipment suppliers and the KOSPI indicates that the move reflected a broad reassessment of the AI hardware trade rather than anything specific to SK Hynix that day.
This distinction matters. A company-specific catalyst—such as a major customer qualification or an earnings upgrade—can change estimated future cash flow. A sector-wide rally may instead reflect changing risk appetite, positioning or momentum. In this case, there were supporting fundamental developments, but investors should avoid attributing the entire gain to a single product announcement.
The 8% rally was a vote of confidence in the AI memory cycle, not definitive proof that SK Hynix’s long-term earnings have increased by 8%.
Does one trading session change the investment thesis?
Not by itself. The investment thesis must still be tested against four variables:
- HBM demand: How many AI accelerators will hyperscalers deploy?
- Market share: Can SK Hynix defend its lead against Samsung and Micron?
- Pricing: Will shortages persist as new capacity arrives?
- Capital efficiency: Can the company expand without destroying future returns?
The stock’s daily movement is useful as a sentiment indicator. It is not a substitute for studying earnings quality, product qualifications, customer concentration and capital expenditure.
Why High-Bandwidth Memory Matters to Artificial Intelligence
AI accelerators can perform enormous numbers of calculations, but they need rapid access to model parameters, training data and intermediate results. Traditional memory architectures can create a bottleneck: the processor may be capable of additional work but must wait for data.
HBM addresses that constraint by vertically stacking multiple DRAM dies and placing the memory close to the GPU or accelerator. Thousands of interconnections allow data to move with much greater bandwidth than conventional memory configurations.
| Memory characteristic | Why it matters for AI |
|---|---|
| High bandwidth | Feeds data to GPUs and custom accelerators more quickly |
| Large capacity | Supports larger models and longer inference contexts |
| Power efficiency | Reduces the electricity required to move data |
| Advanced packaging | Places memory close to compute components |
| Thermal performance | Helps dense AI systems operate reliably |
| Customization | Allows memory to be optimized for specific accelerators |
Training large models is only one source of demand. AI inference can also consume substantial memory, particularly when applications serve many users, maintain long contexts or deploy agentic workflows that repeatedly retrieve information.
That broadens the market opportunity. AI memory demand is increasingly tied to:
- Model training clusters.
- Consumer and enterprise inference.
- Cloud AI services.
- Custom accelerators developed by hyperscalers.
- High-capacity CPU server memory.
- Enterprise solid-state drives.
- Edge and automotive AI systems.
Micron has stated that AI is reshaping data-center infrastructure beyond accelerator racks. Control-plane servers, context storage and general-purpose server systems can all require more DRAM and NAND. This creates a potential spillover effect in which AI supports not only HBM prices but also conventional memory demand.
SK Hynix’s Competitive Advantage in HBM
SK Hynix became the early leader in the current HBM cycle by combining strong DRAM technology, advanced packaging expertise and close collaboration with leading AI accelerator customers.
Its advantage is not based on one specification alone. Successful HBM production requires competence across multiple layers:
- Manufacturing high-quality DRAM dies.
- Stacking multiple dies without damaging them.
- Managing heat, warpage and power consumption.
- Producing acceptable yields at commercial scale.
- Coordinating the base die with logic-foundry partners.
- Passing lengthy customer qualification processes.
- Delivering reliably during rapid platform ramps.
SK Hynix’s MR-MUF packaging process has become an important part of this manufacturing capability. The company says the technique provides effective heat dissipation and controls warpage while protecting connections between stacked dies.
HBM4 and HBM4E extend the technology roadmap
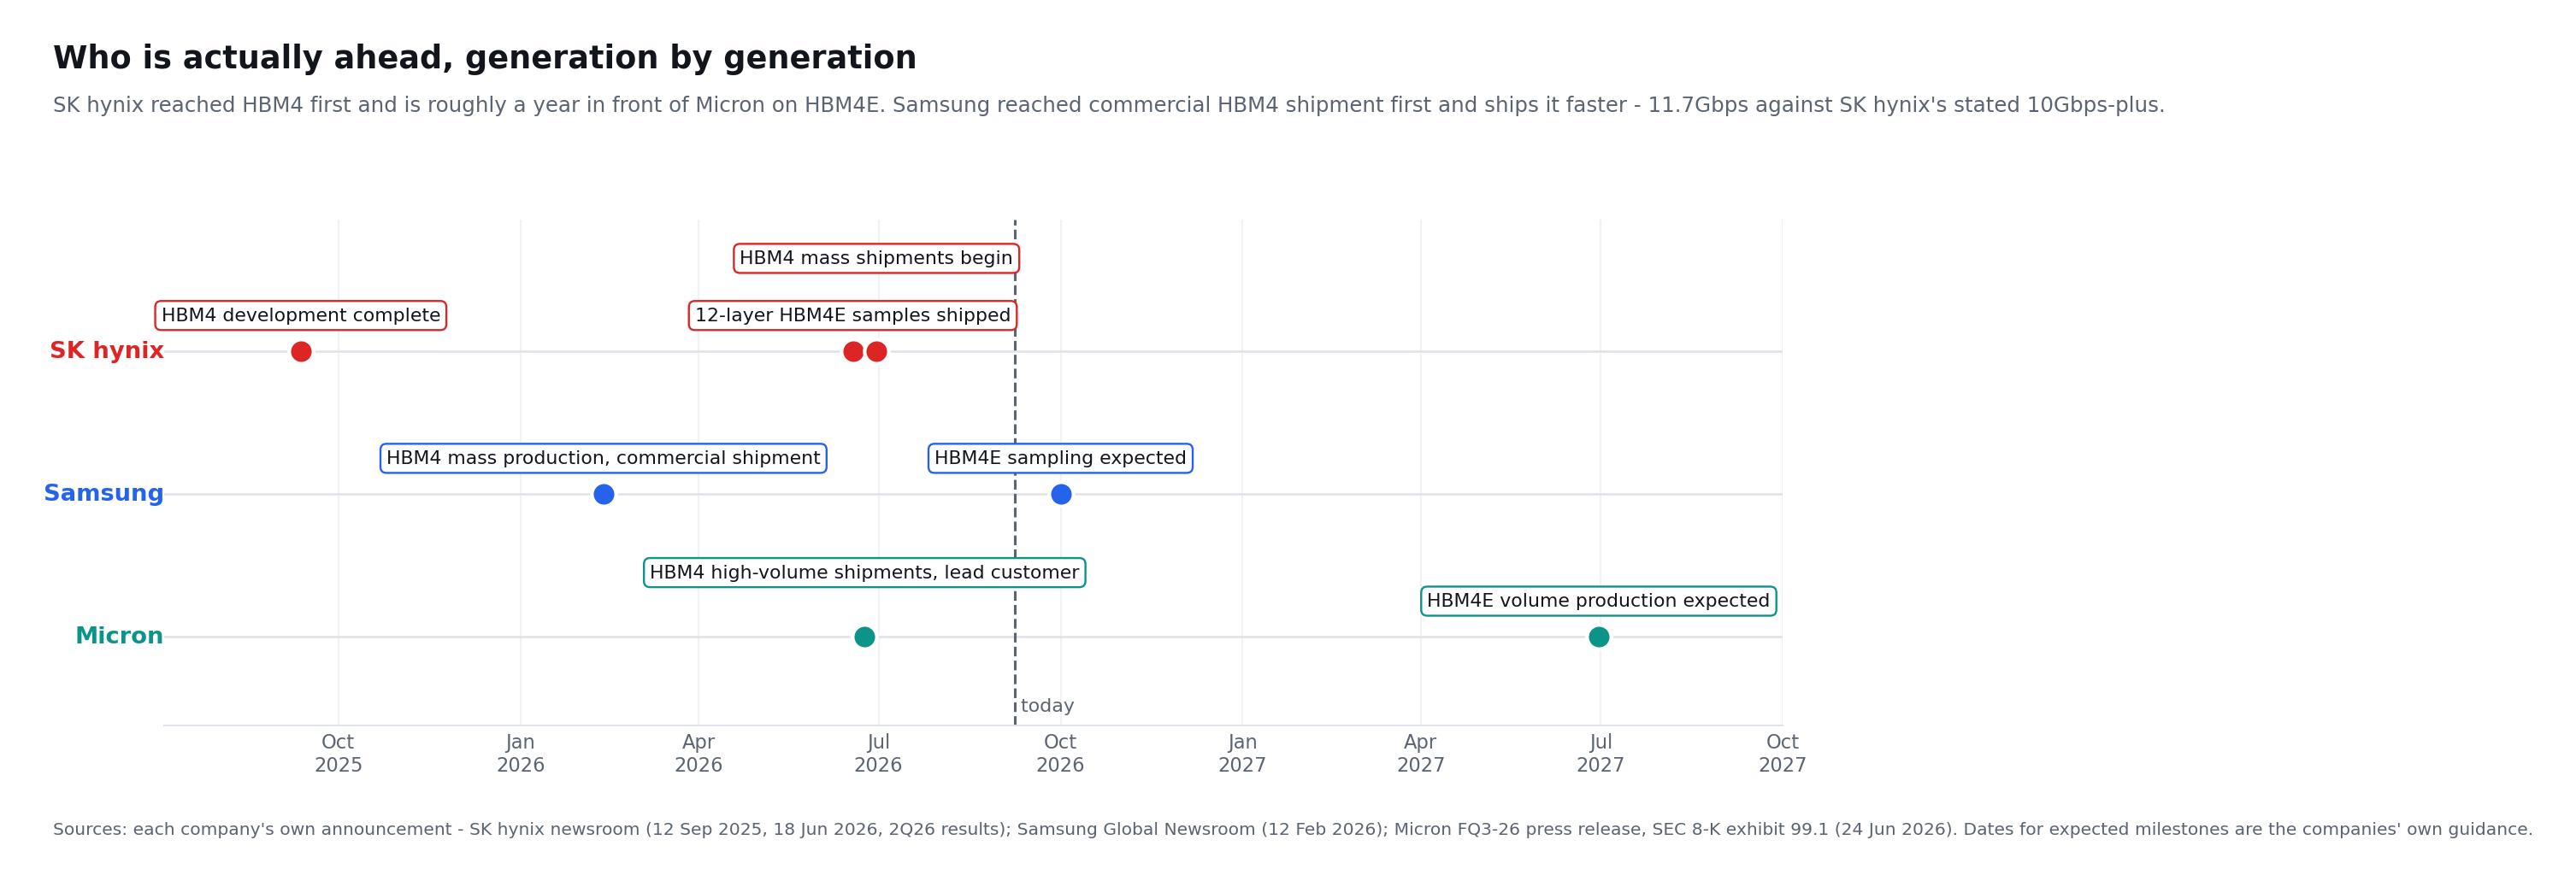
SK Hynix completed HBM4 development on 12 September 2025 and readied mass production. According to the company, HBM4 doubles the number of input/output terminals from the prior generation to 2,048 and improves power efficiency by more than 40%. It implemented operating speeds above 10 gigabits per second per pin against a JEDEC standard of 8Gbps, and expects AI service performance to improve by up to 69% where the product is applied.
The company began mass shipments of HBM4 during the second quarter of 2026 and plans to increase production in the second half. It also shipped 12-layer HBM4E samples to major customers in June 2026.
The sampled HBM4E product reportedly offers:
- A maximum speed of 16Gbps per pin.
- More than 20% higher power efficiency than the previous generation.
- Heat resistance improved by 17% compared with HBM4.
- 48GB of capacity in a 12-layer stack, using Advanced MR-MUF.
These achievements support the bull case because they show that SK Hynix is not relying exclusively on its HBM3E position. It is attempting to carry its manufacturing and customer advantages into the next two product generations.
Record Earnings Confirm a Real Business Boom
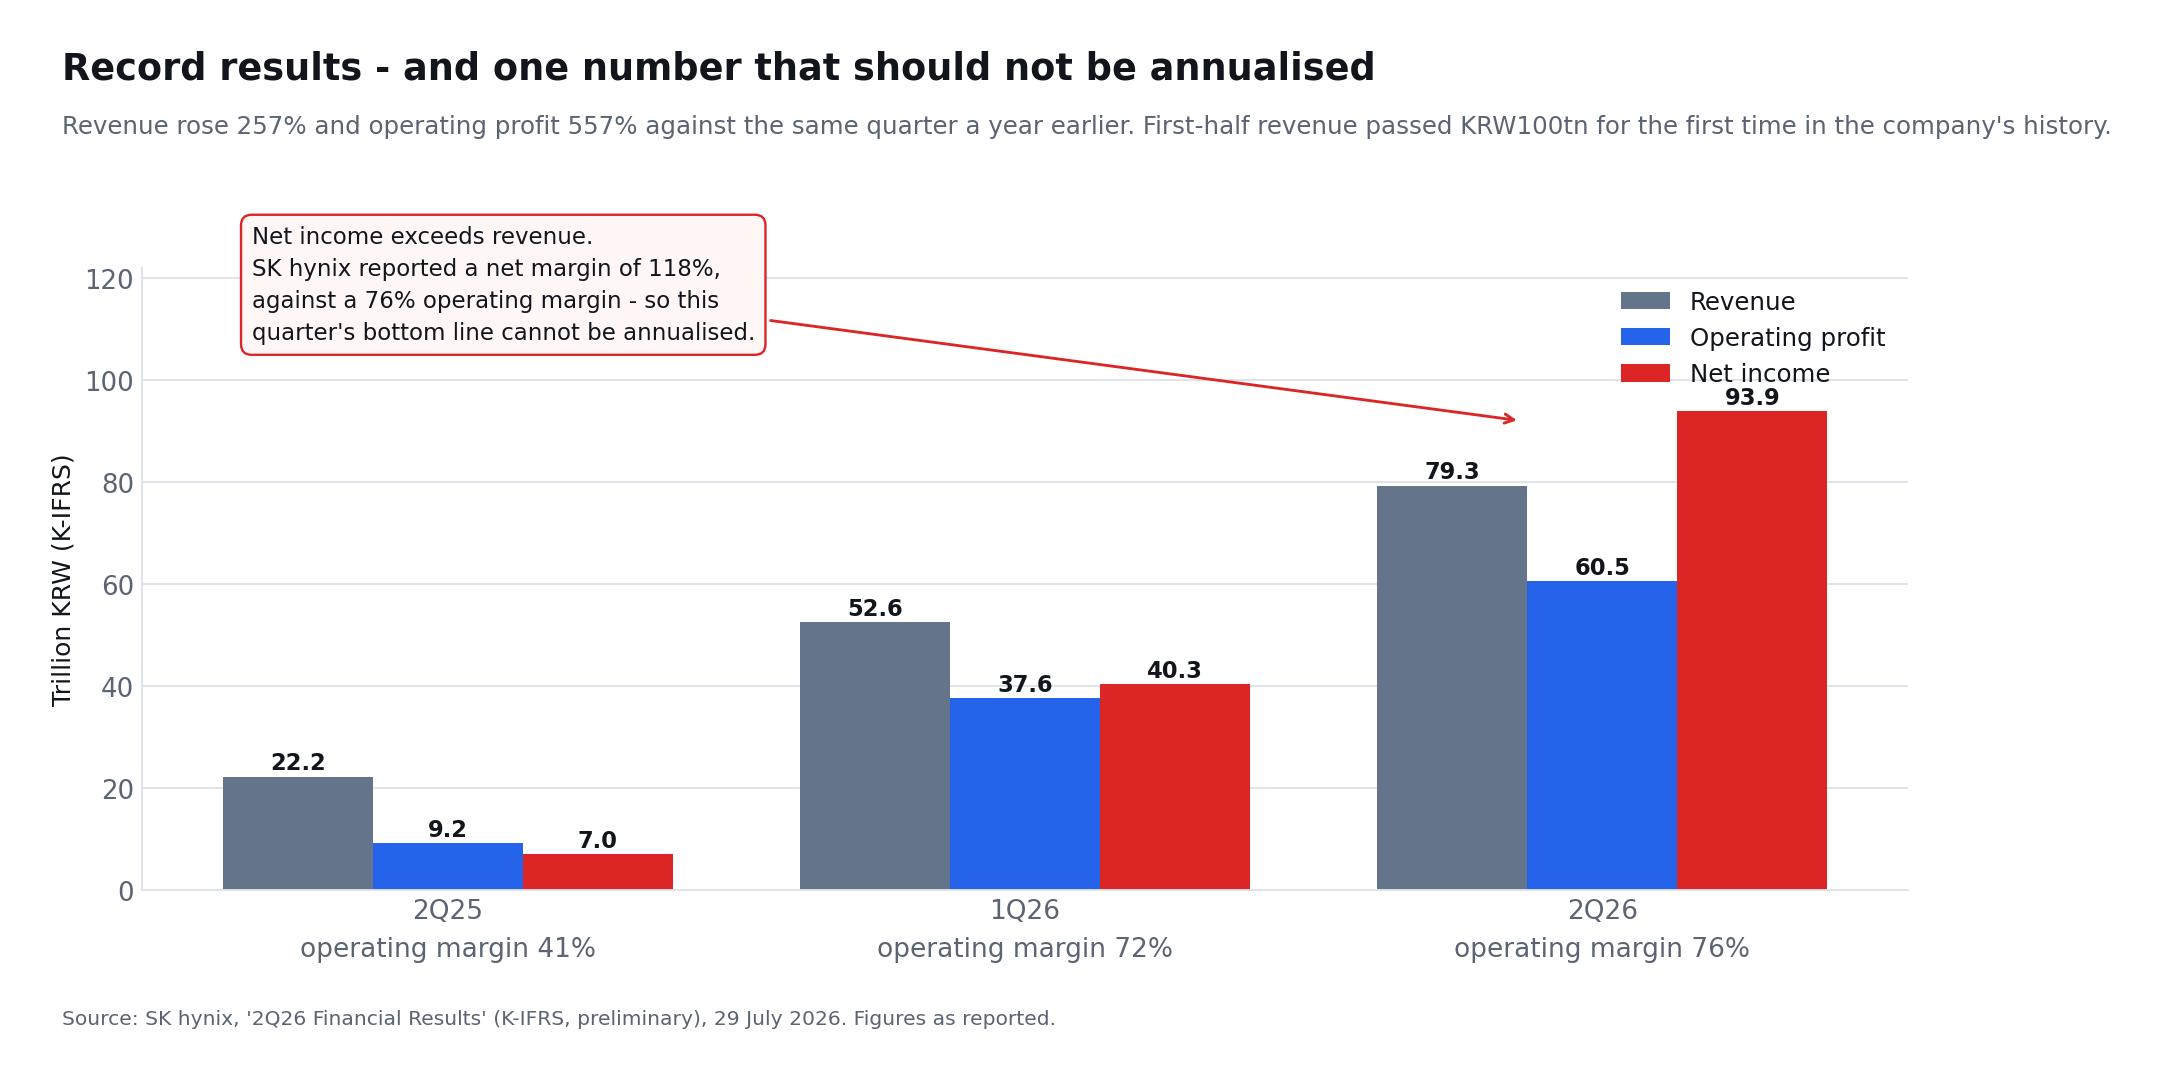
The AI memory thesis is supported by reported earnings, not merely forecasts. SK Hynix’s preliminary second-quarter 2026 results showed:
| Financial metric | Q2 2025 | Q1 2026 | Q2 2026 | Q2 2026 YoY change |
|---|---|---|---|---|
| Revenue | KRW22.232tn | KRW52.576tn | KRW79.319tn | +257% |
| Operating profit | KRW9.213tn | KRW37.610tn | KRW60.543tn | +557% |
| Operating margin | 41% | 72% | 76% | +35 percentage points |
| Net income | KRW6.996tn | KRW40.346tn | KRW93.923tn | +1,242% |
| Net margin | 31% | 77% | 118% | — |
Revenue increased 51% sequentially, operating profit rose 61% and net income rose 133%. SK Hynix attributed the performance to higher DRAM and NAND prices and greater sales of high-value products, including HBM, AI-server DRAM and enterprise SSDs. One milestone in the same release went almost unreported: cumulative first-half revenue crossed KRW100 trillion for the first time in the company's history, finishing at KRW131.9 trillion.
The company ended the quarter with approximately KRW88 trillion in cash and cash equivalents and KRW18.6 trillion of total debt, producing a net-cash position of about KRW69.4 trillion.
There is an important analytical caveat, and the company states it plainly. SK Hynix reported a net margin of 118% — reported net income exceeded both revenue and operating profit. Investors should therefore not annualise Q2 net income mechanically. Non-operating gains can make net income an unreliable measure of recurring earnings in a particular period. Revenue, operating profit, free cash flow and normalised earnings provide a more useful foundation for valuation, and the 76% operating margin is the number that describes the operating business.
The earnings boom is real, but the most spectacular accounting number is not necessarily the most repeatable one.
Evidence That the Memory Market Remains Tight
On 7 September, TrendForce reported that global DRAM-industry revenue increased 59.5% sequentially in the second quarter of 2026, reaching nearly $154.73 billion. The research firm said AI training and inference were supporting demand for HBM3E, LPDDR5X and high-capacity registered DIMMs, and that the surge in agentic AI applications was lifting RDIMM demand across capacities.
The supply side remains equally important. TrendForce noted that supplier inventory was near historically low levels and that new supply was being directed primarily toward server products. It projected conventional DRAM contract-price growth of 13%–18% sequentially in the third quarter, although that would represent moderation from the unusually rapid increases seen earlier.
This creates a powerful feedback loop:
- HBM consumes more manufacturing and packaging resources than conventional DRAM.
- Manufacturers prioritize high-margin AI memory.
- Less capacity remains available for commodity products.
- Conventional DRAM supply tightens.
- Prices rise across more of the memory portfolio.
- Higher cash flow funds the next generation of HBM investment.
The cycle can improve SK Hynix’s earnings even if HBM shipment growth temporarily moderates. However, it also carries danger: high prices encourage customers to optimize consumption and manufacturers to expand supply.
SK Hynix Is No Longer the Largest DRAM Maker
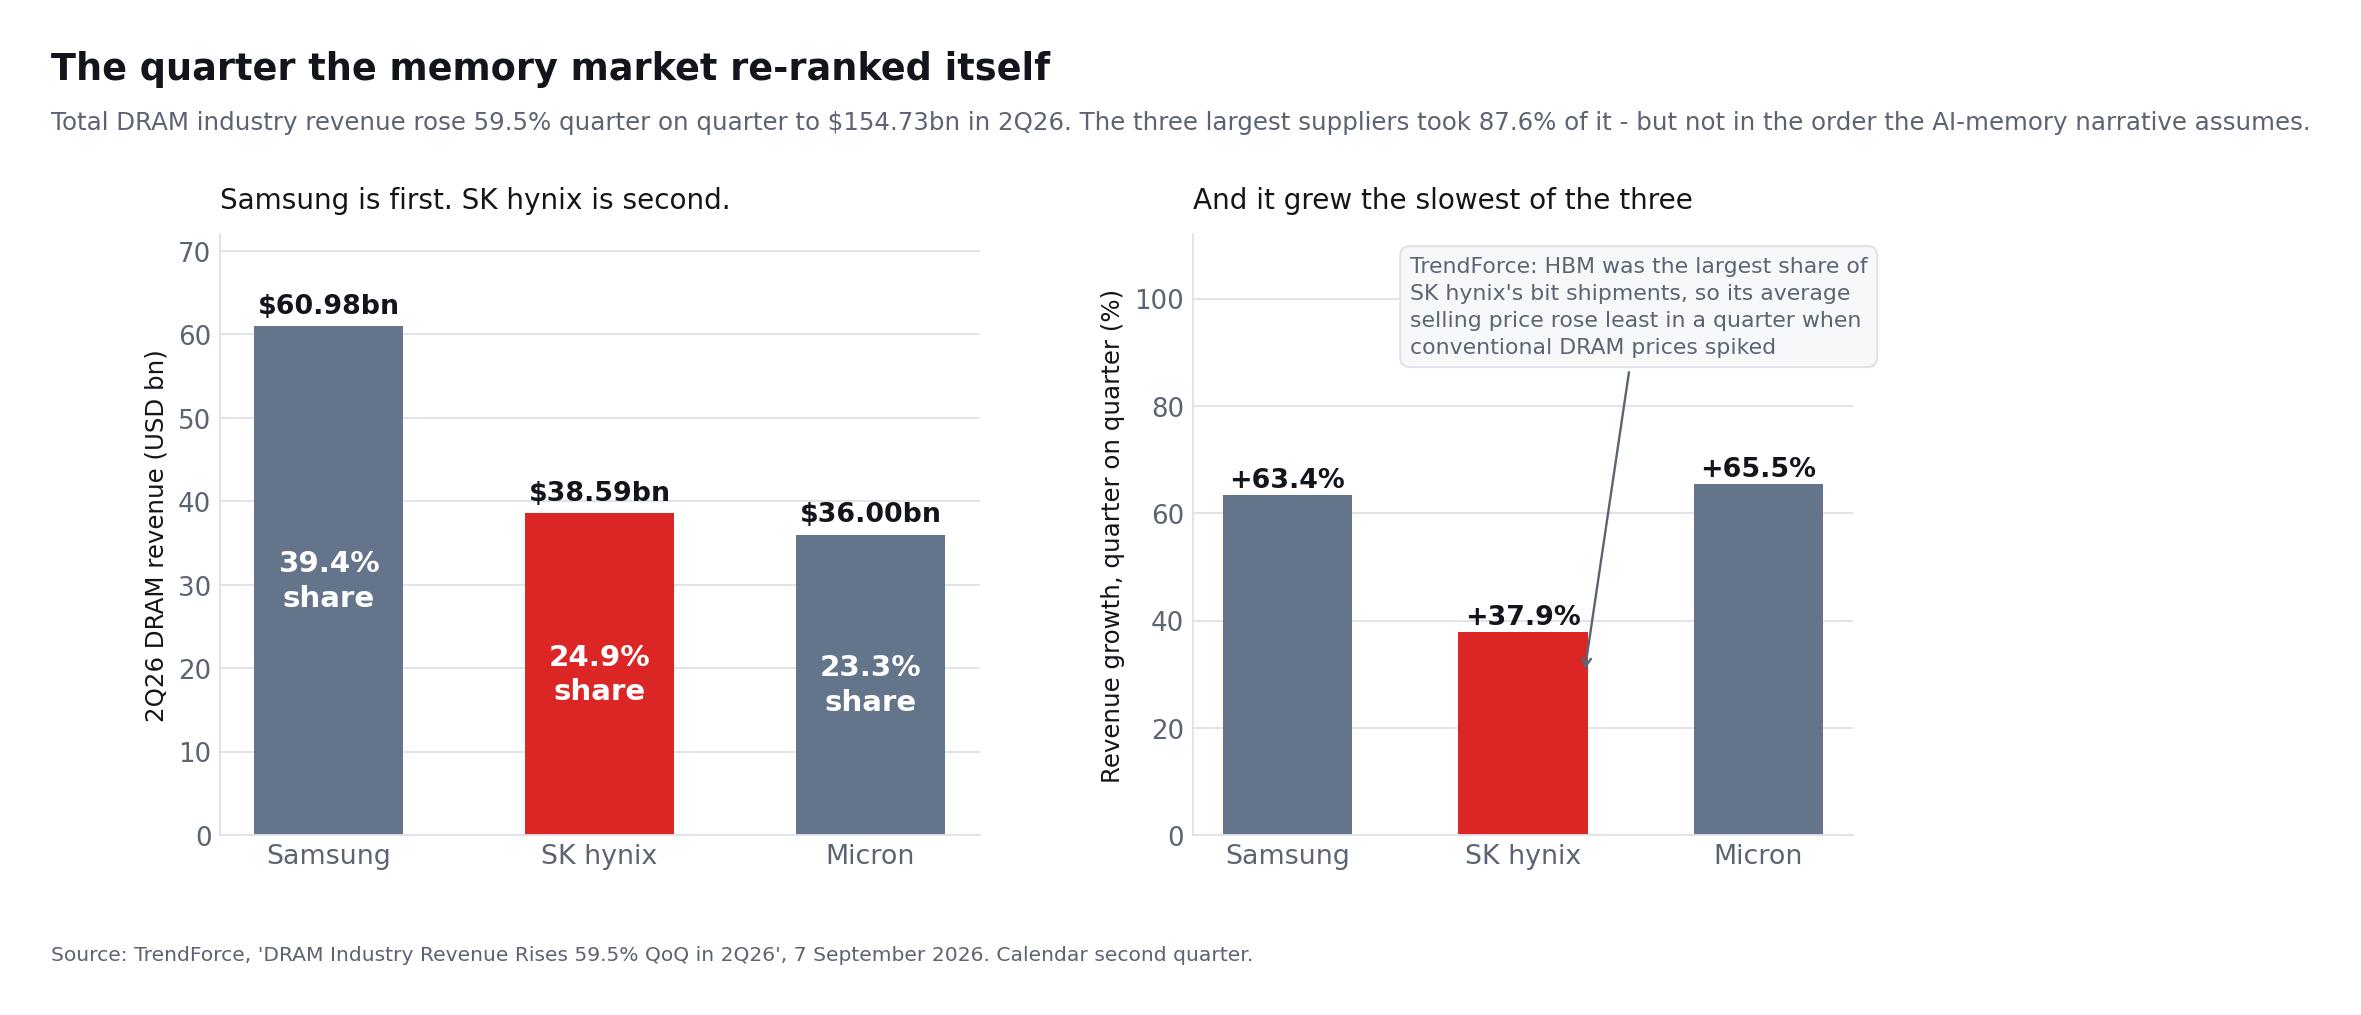
The TrendForce release quoted above for tight inventories contains a second finding that is rarely quoted alongside it, and it cuts the other way. In the same 7 September report, Samsung — not SK Hynix — ranked first in DRAM revenue in the second quarter of 2026.
| 2Q26 DRAM | Revenue | Industry share | Growth vs Q1 2026 |
|---|---|---|---|
| Samsung | $60.98bn | 39.4% | +63.4% |
| SK Hynix | $38.59bn | 24.9% | +37.9% |
| Micron | $36.00bn | 23.3% | +65.5% |
| Industry total | $154.73bn | 100% | +59.5% |
SK Hynix did not merely rank second. It grew more slowly than either competitor, in the quarter with the sharpest conventional-DRAM price increases the industry has recorded. TrendForce gives the reason, and it is the most uncomfortable sentence in the bull case: because HBM accounted for the highest proportion of SK Hynix's bit shipments among the top three, its average selling price rose least.
Read that carefully, because it inverts one of the standard arguments. Long-term agreements are usually presented as a pure positive — visibility, planning, reduced spot volatility. They are also a price ceiling. When conventional DRAM contract prices spiked, Samsung and Micron, with more of their bits exposed to that market, captured more of the move. SK Hynix's contracted HBM book did what contracts do: it held.
That trade-off is defensible. Smoother revenue at a high absolute margin is a reasonable thing to own, and TrendForce expects conventional DRAM contract prices to moderate to 13–18% sequential growth in the third quarter, which would narrow the gap. But it should be priced honestly. An investor buying SK Hynix specifically for maximum leverage to a memory price spike is buying the supplier with the least of it.
What the DRAM ranking does not say
Two caveats keep this from being a bear thesis on its own. First, DRAM revenue is not profit: SK Hynix's HBM mix carries a higher margin than the commodity bits that lifted its rivals' revenue, and the operating margin comparison further down bears that out. Second, TrendForce's DRAM table and Counterpoint's HBM table measure different things — one is the whole DRAM market, the other is the HBM slice inside it. SK Hynix leads the slice and trails the whole. Both statements are true at once, and any honest summary has to carry both.
Is the AI Memory Supercycle Just Getting Started?
There is a credible argument that this cycle is more durable than earlier memory upturns.
Traditional memory cycles were driven by PCs, smartphones and general-purpose servers. Those markets could produce sharp demand swings, while relatively standardized products encouraged aggressive capacity additions. When supply exceeded demand, prices and profits collapsed.
AI changes several parts of that model:
- Memory content per AI system is substantially higher.
- HBM is harder to manufacture than commodity DRAM.
- Packaging and qualification create additional bottlenecks.
- Customers increasingly negotiate long-term supply arrangements.
- New AI accelerator generations require more bandwidth and capacity.
- Hyperscalers are developing custom chips in addition to buying GPUs.
- Inference may create a recurring demand source beyond model training.
SK Hynix said in July that it had finalized long-term agreements with around ten customers and was continuing discussions with other major clients. Multi-year agreements can improve demand visibility and reduce some of the volatility associated with spot pricing.
The company also believes AI investment is increasingly supported by revenue from commercial AI services. If true, infrastructure spending may become less dependent on speculative expectations and more closely connected to recurring cloud and software revenue.
Why the phrase “supercycle” still requires caution
A structural growth market can still experience cyclical corrections. Three developments could occur simultaneously:
- AI memory volumes continue growing.
- Industry manufacturing capacity grows even faster.
- Memory prices and supplier profits decline.
Therefore, investors should not define a supercycle as a period when earnings rise every quarter. A more defensible definition is a multi-year period in which the average level of demand, pricing power and profitability remains above the historical norm, despite temporary corrections.
The Competitive Threat From Samsung and Micron
SK Hynix remains the HBM leader, but its position is no longer unchallenged.
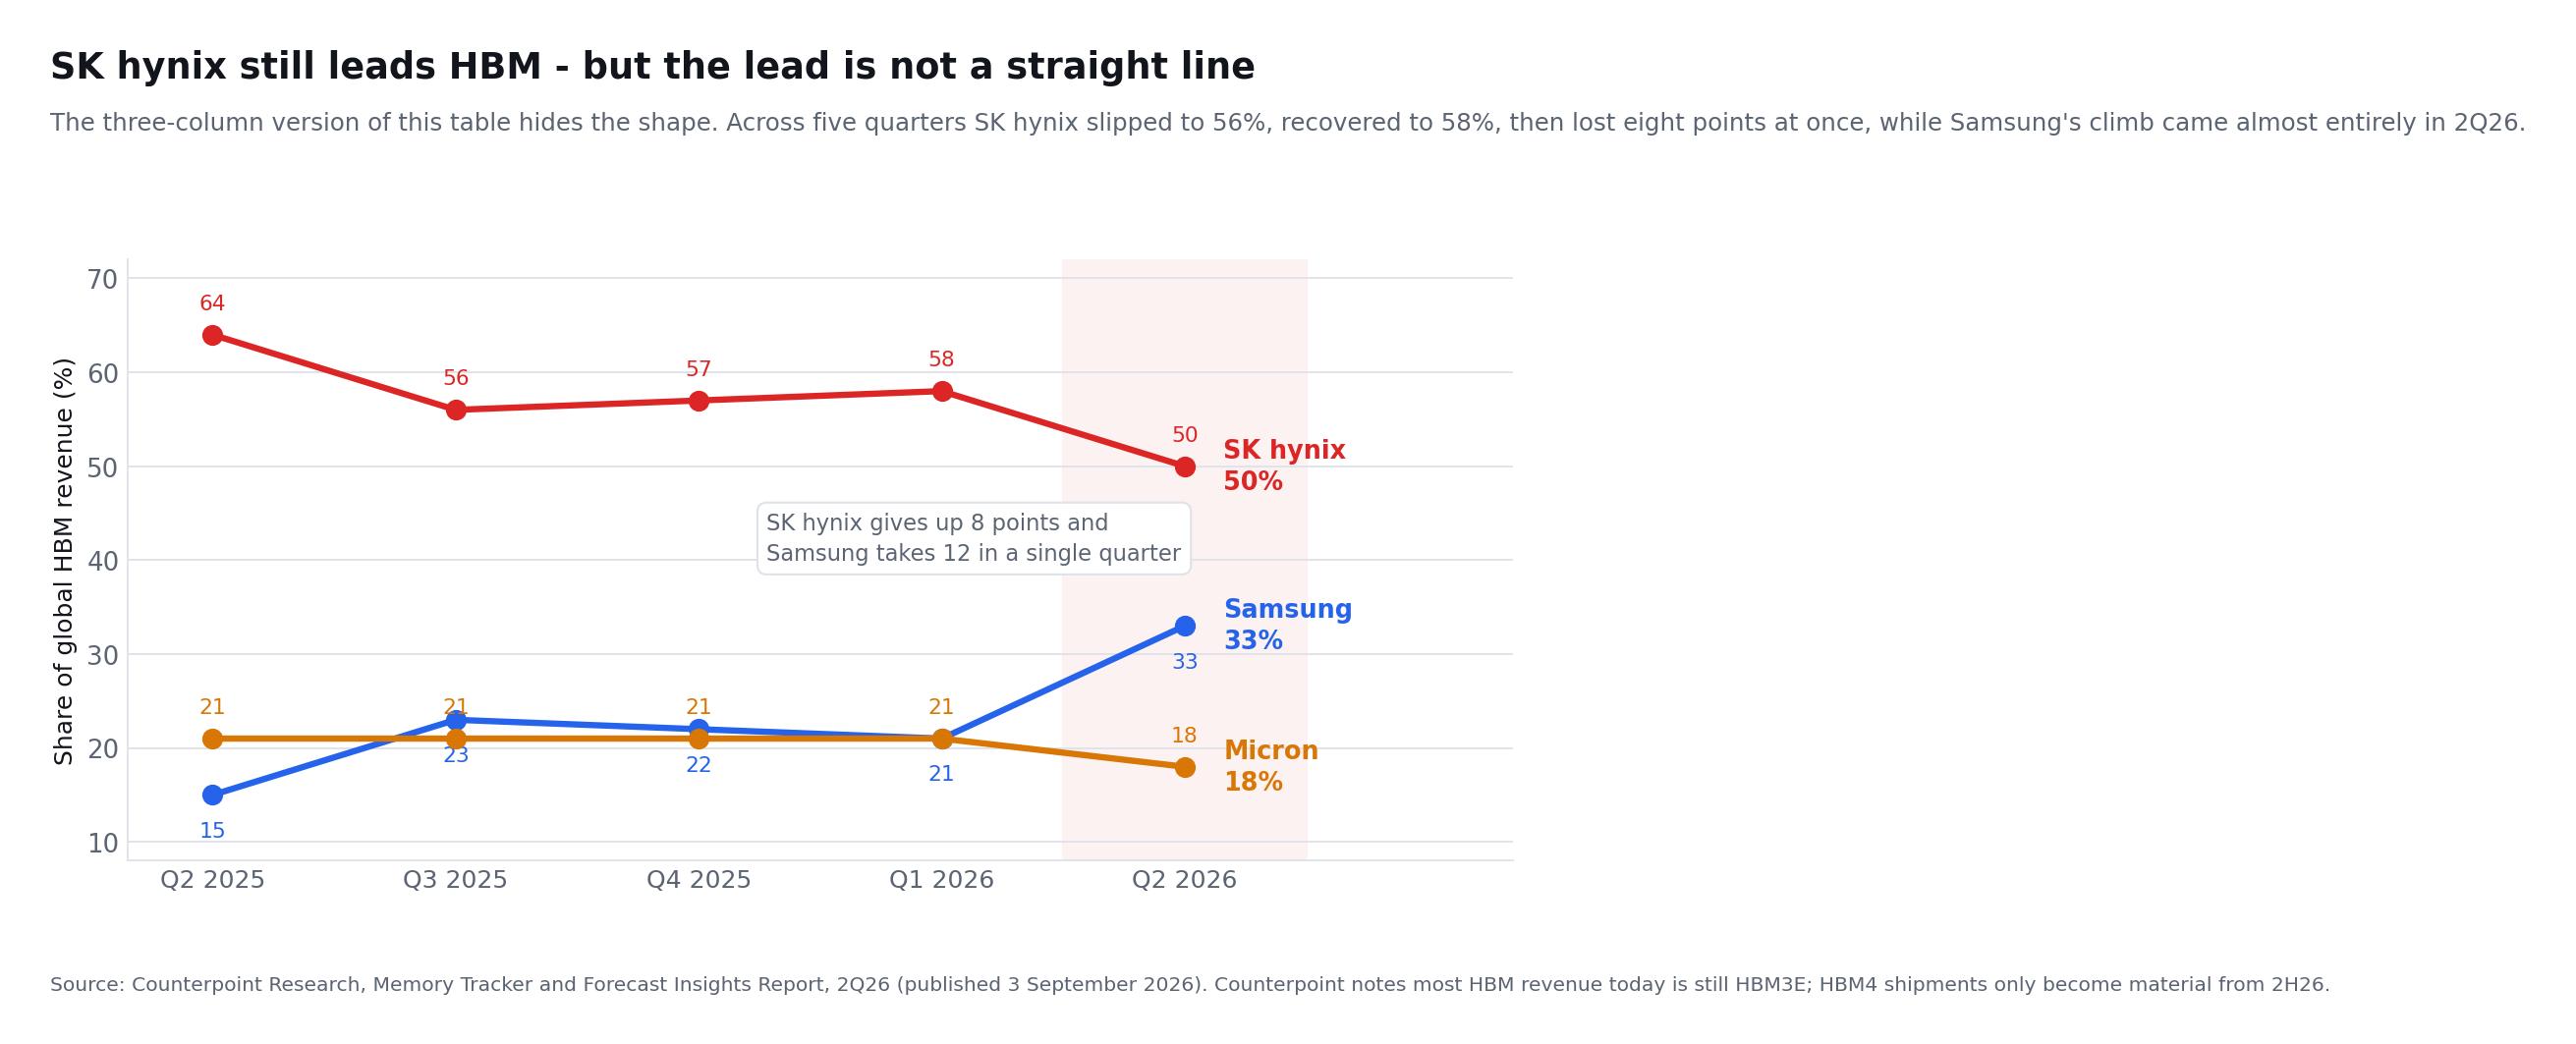
Counterpoint Research estimated that SK Hynix held 50% of HBM revenue in Q2 2026, down from 64% one year earlier. Samsung's share increased from 15% to 33%, while Micron held approximately 18%. The three-column version of that comparison, which is the one most often reproduced, hides the shape of the move — so the full five-quarter series is worth setting out.
| HBM revenue share | Q2 2025 | Q3 2025 | Q4 2025 | Q1 2026 | Q2 2026 |
|---|---|---|---|---|---|
| SK Hynix | 64% | 56% | 57% | 58% | 50% |
| Samsung | 15% | 23% | 22% | 21% | 33% |
| Micron | 21% | 21% | 21% | 21% | 18% |
Source: Counterpoint Research, Memory Tracker and Forecast Insights Report, Q2 2026. Counterpoint adds a qualifier that reframes the whole comparison: most HBM revenue today still comes from HBM3E, and HBM4 shipments only become material from the second half of 2026. The share table above therefore measures the previous generation, not the one every company is currently promoting.
Read across the five quarters and the picture is not a steady erosion. SK Hynix slipped to 56% in Q3 2025, recovered to 58% by Q1 2026, then gave up eight points in a single quarter. Samsung's climb is even more concentrated: it sat at 21% as recently as Q1 2026 and took twelve points in one quarter. A single-quarter step of that size is either the beginning of a durable share shift or an artefact of how a small number of large qualifications landed. Which one it is will not be visible until the second-half HBM4 numbers arrive.
Samsung began mass production of HBM4 and shipped commercial product on 12 February 2026, which it described as an industry first, and said it expects its HBM sales to more than triple in 2026 against 2025. The specifications deserve attention because they are not obviously behind: Samsung's HBM4 runs at a consistent 11.7Gbps and up to 13Gbps, against SK Hynix's stated "above 10Gbps", and it is built on Samsung's own 1c DRAM with a 4nm logic base die from its own foundry. SK Hynix coordinates its base die with an external logic-foundry partner. Samsung also expects to begin HBM4E sampling in the second half of 2026.
Micron reported its fiscal third quarter on 24 June 2026. HBM4, built on 1-beta DRAM, is in high-volume shipment for its lead customer's platform, with qualification samples shipped to multiple end-customers; HBM4E, on 1-gamma DRAM, is not expected to reach volume production until calendar 2027. That gives SK Hynix, which shipped 12-layer HBM4E samples in June 2026, roughly a year of lead on the next generation over Micron — the clearest remaining piece of the technology-leadership argument.
Competition introduces several risks:
- Customers may use multiple suppliers to improve supply security.
- Market-share gains by Samsung could reduce SK Hynix’s negotiating leverage.
- Higher aggregate industry output could pressure HBM pricing.
- Technology transitions may reshuffle customer allocations.
- Custom HBM could require greater engineering spending.
- Yield problems could alter profitability even when demand remains strong.
The bull case does not require SK Hynix to preserve a 60%-plus share indefinitely. It does require the company to maintain a leading position and earn attractive returns as the total HBM market expands.
Capacity Expansion: Necessary Investment or Future Oversupply?
SK Hynix is increasing capacity to meet AI-related demand, and the second-quarter release is specific about where. Its 2026 capital-spending outlook has risen into the high-KRW40-trillion range. The company is accelerating the mass-production schedule for M15X, and is investing to expand capacity rapidly after the Yongin Phase 1 cleanroom opens in early 2027. Beyond that sit the recently announced P&T7 advanced packaging facility, the M17 NAND production base and a new semiconductor cluster, all to be executed in phases according to customer demand and investment efficiency. In NAND, 321-layer products already account for the largest share of output, and the company plans to lift that to roughly 50% of domestic capacity by the end of the year.
These investments are necessary because existing facilities cannot satisfy all potential demand. But semiconductor supply responds slowly. New fabs require years of construction, equipment installation, process development and yield improvement.
That delay supports near-term pricing. It also increases long-term forecasting risk. Capacity approved at the top of a cycle may begin producing after demand growth has slowed.
Investors should evaluate capital spending using four questions:
- Is new spending backed by customer commitments?
- Does it focus on differentiated HBM or commodity capacity?
- Can operating cash flow fund investment without excessive debt?
- What return will the assets produce under normalized memory prices?
The strongest version of the SK Hynix thesis assumes that long-term agreements, technical complexity and disciplined industry supply prevent the destructive overbuilding seen in previous cycles.
The weakest version assumes that every major producer extrapolates current shortages, invests heavily and creates oversupply by 2028 or later.
Share Buybacks Strengthen the Per-Share Bull Case
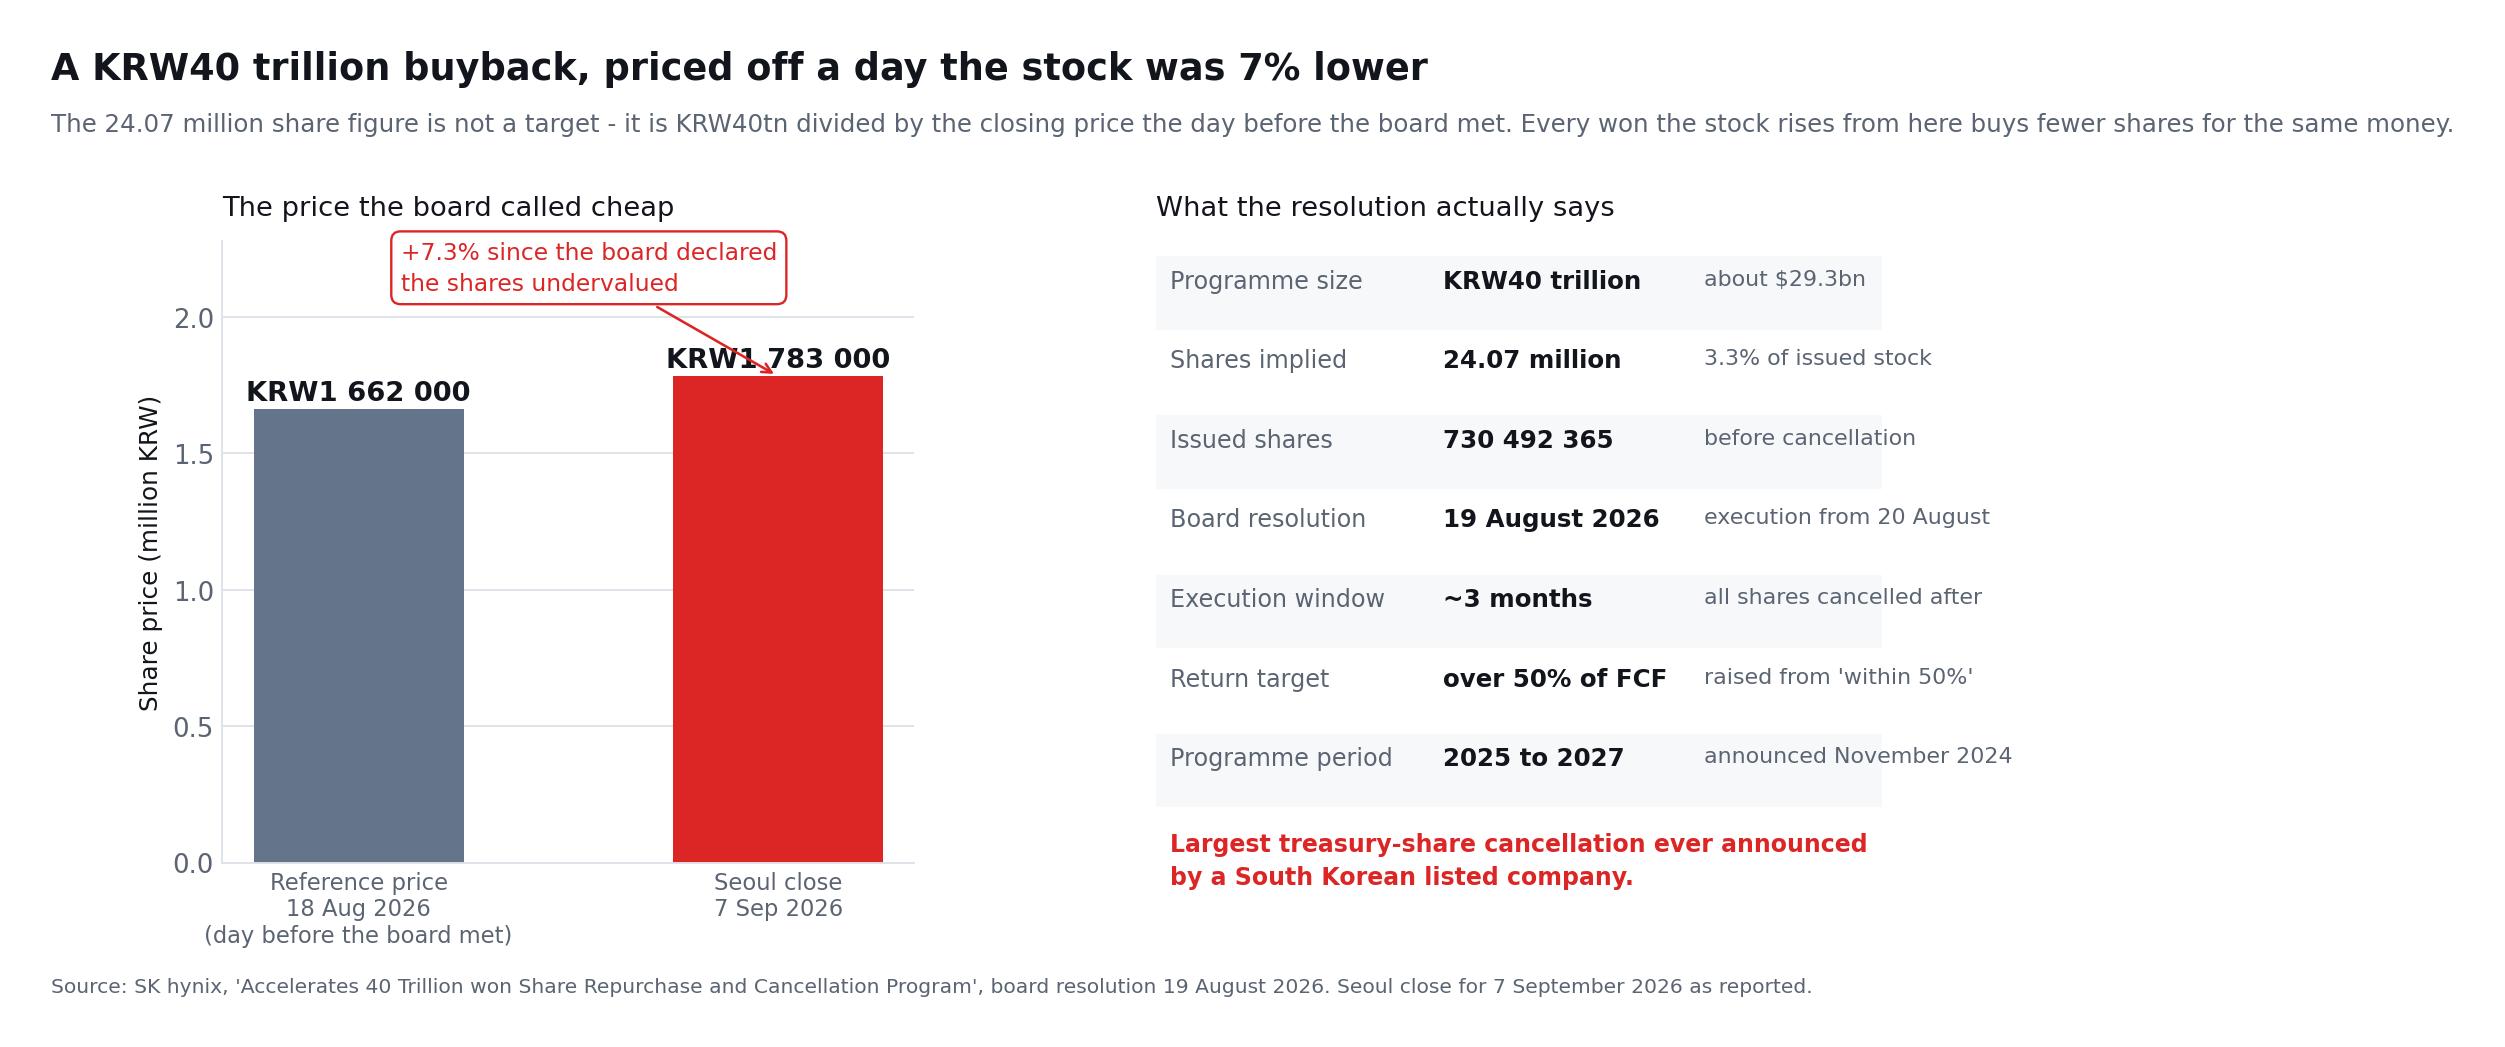
On 19 August 2026 SK Hynix's board approved a KRW40 trillion share repurchase and full cancellation. The detail worth pausing on is how the widely quoted share count was derived: 24.07 million shares, or 3.3% of the 730,492,365 shares then in issue, is simply KRW40 trillion divided by KRW1,662,000 — the closing price on 18 August, the day before the board met. It is a reference price, not a target. Execution runs for roughly three months from 20 August, and every won the stock rises above that reference buys fewer shares for the same money. At the KRW1.783 million Seoul close on 7 September the stock was already 7.3% above it.
The board's stated reasoning is unusually direct: it judged that the company's intrinsic value — its business competitiveness, cash generation and mid-to-long-term growth potential — was not fully reflected in the share price. The company also raised its shareholder-return objective from within 50% to more than 50% of cumulative free cash flow generated between 2025 and 2027, accelerating a programme originally announced in November 2024. Returns may include repurchases, cancellations, fixed dividends and possible special dividends, with scale and timing to be confirmed at the third-quarter results.
This is, on the company's own account, the largest treasury-share cancellation ever announced by a South Korean listed company. The official announcement matters for three reasons:
- Cancellation reduces the share count rather than merely holding treasury stock.
- Management is signaling confidence in cash generation.
- Per-share earnings can grow faster than total earnings if shares are retired.
However, buybacks are not automatically value creating. Their effectiveness depends on the price paid and on whether the company preserves sufficient capital for research, capacity and downturn resilience.
SK Hynix must balance three uses of cash:
| Use of cash | Potential benefit | Principal risk |
|---|---|---|
| HBM capacity and R&D | Protects technology and supply leadership | Overinvestment near a cycle peak |
| Debt reduction and liquidity | Improves downturn resilience | Excess cash can depress capital efficiency |
| Buybacks and dividends | Increases shareholder return | Repurchasing overvalued shares destroys value |
SK Hynix Stock Valuation After the Rally
SK Hynix’s valuation presents a paradox. The share price has risen dramatically, yet commonly quoted forward earnings multiples remain low relative to many AI semiconductor companies.
As of the close on 8 September 2026, StockAnalysis showed the Nasdaq-listed SKHY ADR at $185.55 against a 52-week range of $124.80 to $194.80 — within 5% of its high — on a forward price-to-earnings ratio of about 4.4, with 14 analysts rating it Strong Buy at a consensus 12-month target of $247.31. Note the ADR itself only began trading on Nasdaq on 10 July 2026, so its price history is two months long and its liquidity profile is still forming. These figures change frequently and depend heavily on earnings estimates.
A low forward P/E does not automatically mean the stock is cheap. Memory companies often trade at their lowest multiples near peak earnings because investors expect profits to decline.
For a cyclical company, a low P/E can be a warning about peak earnings rather than a guarantee of value.
Investors should use multiple valuation approaches.
1. Normalized earnings valuation
Estimate earnings under average—not peak—DRAM and NAND prices. Apply a reasonable multiple to that normalized result.
2. Price-to-book analysis
Memory manufacturing requires substantial physical assets. Price-to-book can help compare the market value with the company’s productive capital, although it does not fully capture proprietary technology or customer relationships.
3. Free-cash-flow yield
Subtract capital expenditure from operating cash flow. This exposes whether record accounting profits are converting into cash after funding capacity.
4. Scenario-based valuation
Build bear, base and bull cases instead of relying on a single forecast.
| Scenario | Key assumptions | Likely stock implication |
|---|---|---|
| Bear | AI capex slows, HBM share falls, pricing declines and new capacity creates oversupply | Earnings contract and the low forward P/E proves misleading |
| Base | AI infrastructure grows, SK Hynix retains leadership and pricing normalizes gradually | Earnings remain above historical levels but fluctuate |
| Bull | HBM demand exceeds capacity, HBM4E leadership holds and long-term contracts stabilize margins | Strong cash generation supports investment and shareholder returns |
SimianX AI can help investors track changes across earnings estimates, technical momentum, analyst revisions and AI-sector news. That is particularly useful for SK Hynix because the stock can react sharply to developments involving Nvidia, hyperscaler capital spending, memory prices and Korean market flows even when the company publishes no new announcement.
The Strongest Bull Case
The bull thesis rests on six arguments.
1. AI models are becoming more memory intensive
Longer contexts, multimodal workloads, agentic systems and real-time inference require both bandwidth and capacity. Memory content may grow faster than the number of accelerators shipped.
2. SK Hynix owns a difficult manufacturing advantage
High yields, packaging experience and successful customer qualifications are not easily replicated. HBM is more technologically demanding than ordinary DRAM.
3. HBM absorbs conventional DRAM capacity
Allocating wafers and packaging resources to HBM can tighten the rest of the market, supporting broader memory prices.
4. Long-term agreements improve visibility
Multi-year customer contracts can reduce demand uncertainty and help the company plan capital investment.
5. The balance sheet is strong
A substantial net-cash position gives SK Hynix capacity to invest, survive a downturn and return capital simultaneously.
6. Share cancellation improves per-share economics
The KRW40 trillion repurchase program directly reduces issued shares after completion, supporting earnings and free cash flow per share.
The Most Important Bear Risks
The bear case deserves equal attention.
AI capital spending could disappoint
SK Hynix ultimately depends on customers earning adequate returns from AI infrastructure. If hyperscalers reduce capital budgets, memory orders could fall rapidly.
Samsung is closing the gap
Samsung’s HBM share rose sharply in the second quarter. Greater competition could reduce SK Hynix’s market share and pricing power.
Customer concentration remains significant
Leading accelerator and cloud-platform customers represent an important source of HBM demand. Delays to one major architecture can affect supplier shipments.
Capital expenditure may peak at the wrong time
New fabs are expensive and slow to complete. Capacity that arrives after demand growth decelerates could damage industry pricing.
Conventional memory remains cyclical
HBM receives much of the attention, but SK Hynix also sells DRAM and NAND products exposed to traditional supply-and-demand cycles.
Expectations are already elevated
A company can report record results and still see its stock decline if earnings miss ambitious forecasts. The reaction to Q2 results demonstrated that strong absolute performance does not guarantee a positive market response.
Currency, geopolitical and policy risks persist
SK Hynix operates across Korea, China, the United States and other markets. Export controls, trade policy, currency changes and equipment restrictions can affect costs and production strategy. The macro backdrop on the day of the rally is worth stating plainly, because the same wire report that carried the 8.1% figure also carried this: the Associated Press noted that market participants expected the Federal Reserve to raise rates before year-end with inflation still well above 3%, with an FOMC decision due 16 September and August inflation figures on 11 September. Brent crude stood at $96.32 amid a six-month US war with Iran and a Strait of Hormuz that remains effectively closed. A stock with a beta of 2.39 and a four-times forward multiple is exposed to that discount rate as much as to HBM bit growth — a tension examined in 2026 Midterms Meet the Fed and in the global bond selloff.
What Investors Should Monitor Next
A disciplined SK Hynix research process should track measurable evidence rather than relying on the phrase “AI supercycle.”
Quarterly operating indicators
- DRAM and NAND average selling-price changes.
- HBM shipment growth.
- Operating margin excluding unusual items.
- Capital expenditure and free cash flow.
- Inventory days.
- Net cash and shareholder distributions.
Competitive indicators
- SK Hynix’s HBM revenue share.
- Samsung’s HBM4 qualifications and production yields.
- Micron’s HBM4 revenue ramp.
- HBM4E sampling and qualification milestones.
- Customer adoption across GPU and custom-accelerator platforms.
End-demand indicators
- Hyperscaler capital-expenditure guidance.
- AI accelerator shipment forecasts.
- Cloud AI revenue growth.
- Server-unit growth.
- Memory content per accelerator.
- Evidence of delayed or cancelled data-center projects.
A practical five-step monitoring framework
- Separate price action from fundamentals. Identify whether a move is company specific or sector wide.
- Track revisions, not just reported numbers. Rising or falling forward estimates often drive the stock.
- Normalize margins. Do not assume a 76% operating margin will persist indefinitely.
- Watch market share and total market growth together. A smaller share of a much larger market can still produce higher revenue.
- Define thesis-breaking evidence in advance. Examples include lost qualifications, sustained share erosion or falling HBM prices during rapid capacity growth.
The Same Boom, Read From Two Sets of Books
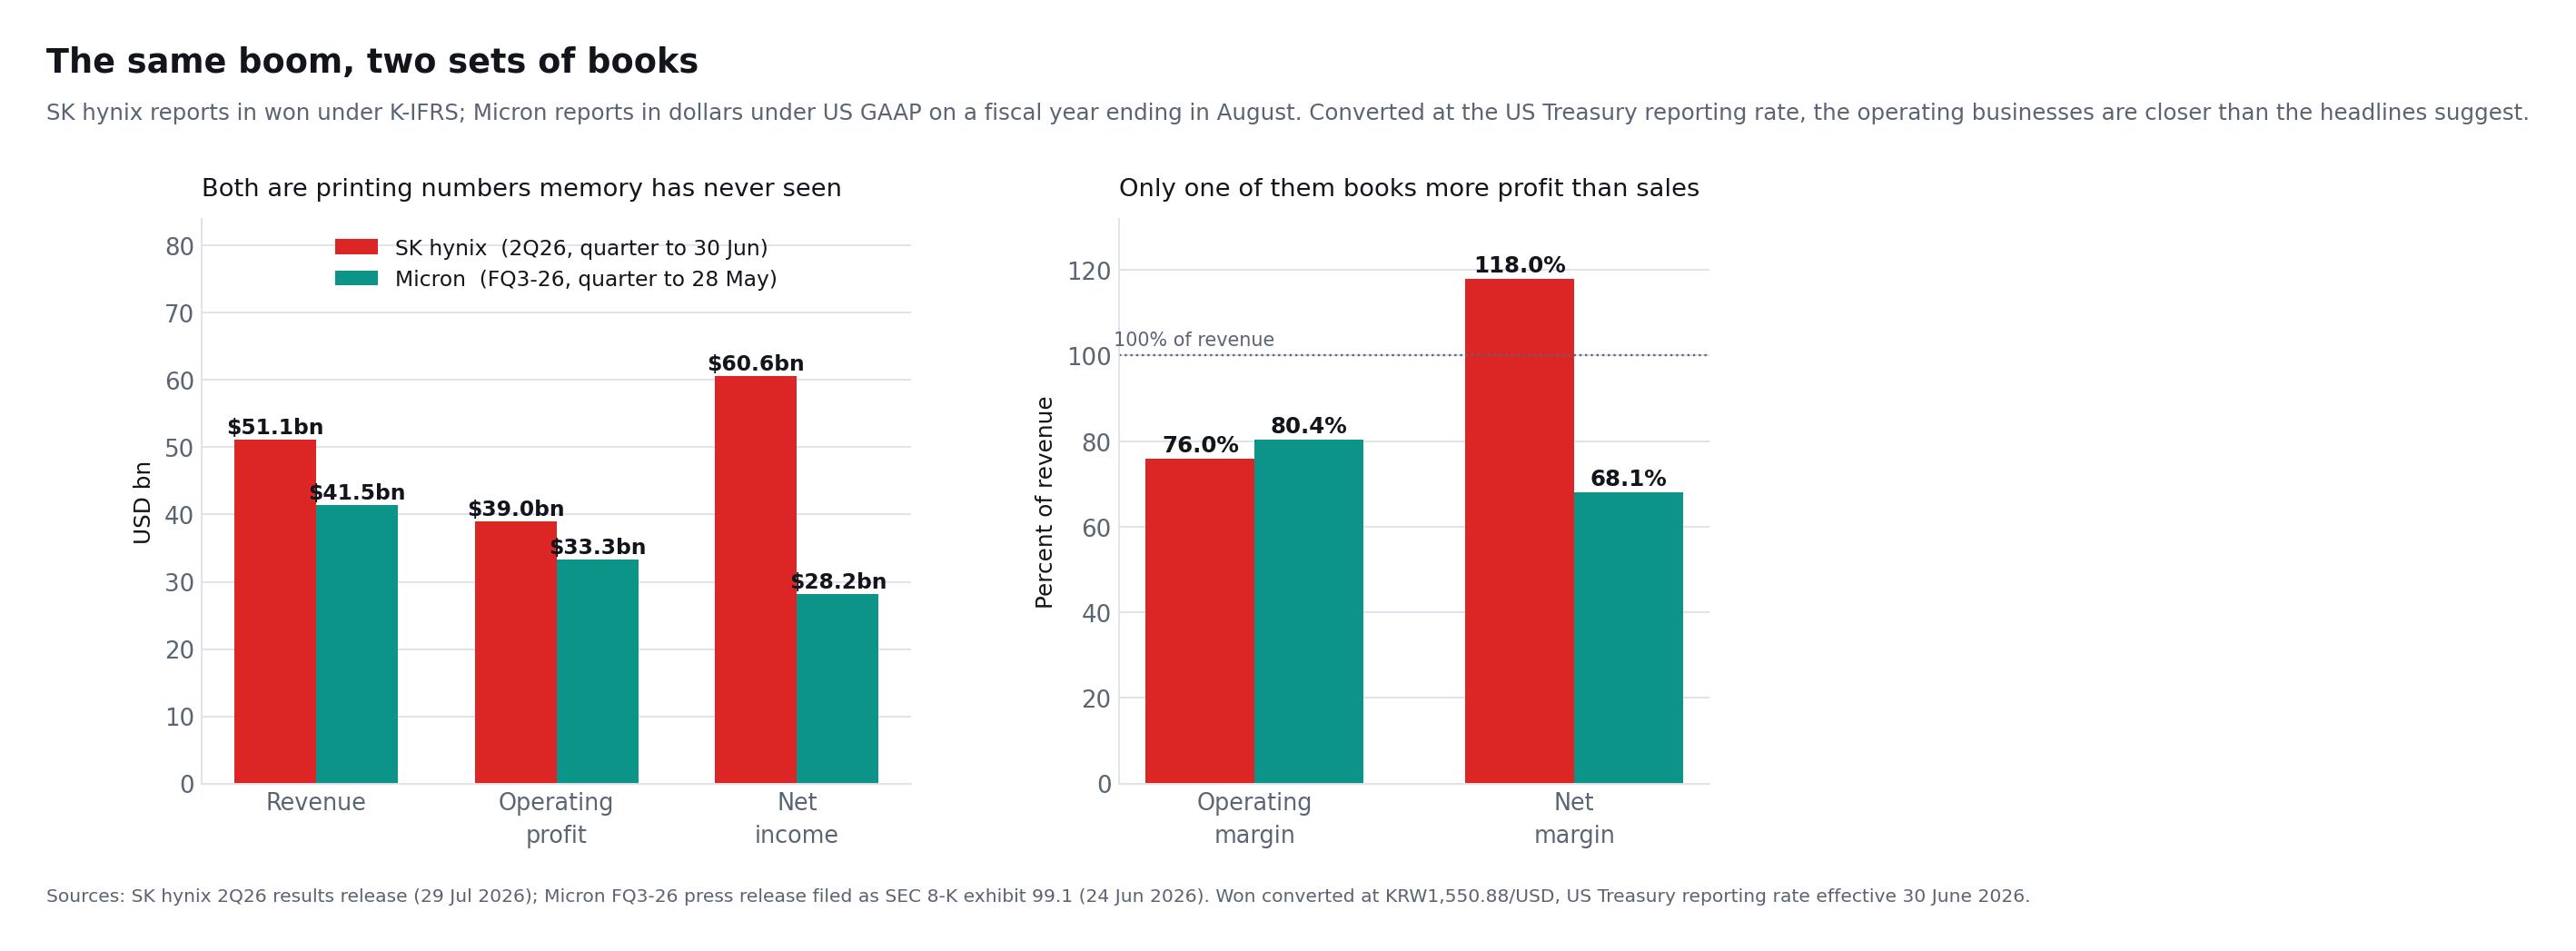
Comparing SK Hynix with Micron is harder than it looks, and most coverage simply does not try. SK Hynix reports in won under K-IFRS on a calendar year. Micron reports in dollars under US GAAP on a fiscal year that ends in August, so its "fiscal third quarter" ended on 28 May 2026 — close enough to SK Hynix's June quarter for a fair reading, provided the currency is handled with a stated rate rather than a guess.
Converting at the US Treasury reporting rate of KRW1,550.88 to the dollar, effective 30 June 2026, the two most recent reported quarters line up like this. Every figure below comes from the company's own release.
| Same-quarter comparison | SK Hynix (2Q26, to 30 Jun) | Micron (FQ3-26, to 28 May) |
|---|---|---|
| Revenue | $51.1bn | $41.5bn |
| Operating profit | $39.0bn | $33.3bn |
| Operating margin | 76% | 80.4% |
| Net income | $60.6bn | $28.2bn |
| Net margin | 118% | 68.1% |
| Operating cash flow | — | $25.4bn |
| Capital expenditure | — | $7.1bn |
| Free cash flow | — | $18.3bn |
| Net cash / cash position | $44.7bn net cash | $30.2bn cash and investments |
Three things fall out of this table that neither company's own release makes obvious.
Micron is the more profitable operator this quarter. On the measure that describes the operating business rather than the accounting outcome, Micron's 80.4% operating margin edges SK Hynix's 76%. The gap is small and the quarters do not align perfectly, but the widespread assumption that HBM leadership automatically produces superior margins is not supported by the two filings side by side.
SK Hynix's advantage is scale and balance sheet, not unit economics. It is the larger business by revenue and operating profit, and it carries roughly $44.7bn of net cash — more than Micron's entire cash and investment position. That is what funds M15X, Yongin, P&T7 and a KRW40 trillion buyback simultaneously.
Only Micron publishes the cash number that matters. Micron disclosed $25.4bn of operating cash flow, $7.1bn of capital expenditure and $18.3bn of adjusted free cash flow for the quarter, and guided to roughly $50bn of revenue at an 86% gross margin for the next one. SK Hynix's quarterly release gives revenue, profit and a net-cash position, but no cash-flow statement — so the free-cash-flow yield that every valuation framework in this article asks for cannot be computed from the preliminary release alone. Micron FQ3-26 results
That last point is a practical instruction rather than a criticism. If free cash flow is the number you want, the preliminary earnings release is the wrong document; wait for the quarterly report. Anyone who has built a SK Hynix free-cash-flow model from the July release has estimated the capital expenditure, whether or not they said so.
Is SK Hynix Stock a Buy After the 8% Surge?
The evidence supports the conclusion that SK Hynix is one of the most direct public-market exposures to AI memory demand. Its HBM leadership, HBM4 shipments, HBM4E roadmap, strong balance sheet and shareholder returns provide a compelling long-term foundation.
The evidence does not establish that buying immediately after an 8% daily gain is automatically attractive. The stock is volatile, expectations are high and reported earnings may be close to an unusually favorable point in the pricing cycle.
The stock may be suitable for investors who:
- Believe AI infrastructure spending will remain strong for several years.
- Can tolerate major semiconductor-cycle drawdowns.
- Understand Korean equity and ADR-specific risks.
- Are willing to monitor HBM competition closely.
- Use position sizing rather than making an all-or-nothing bet.
It may be less suitable for investors seeking stable margins, predictable quarterly earnings or low volatility.
A staged approach can reduce timing risk. Rather than treating the 8% surge as confirmation to chase the stock, an investor can establish a valuation range, begin with a limited allocation and add only when new evidence strengthens the long-term thesis.
FAQ About SK Hynix Stock and the AI Memory Supercycle
Why did SK Hynix stock rise more than 8%?
The September 7, 2026 rally reflected broad optimism about AI hardware and memory demand, supported by low DRAM inventories and strong HBM fundamentals. Samsung and other semiconductor companies also rose, indicating that the move was primarily sector wide.
What is HBM, and why is it important to SK Hynix?
High-bandwidth memory stacks DRAM dies vertically to deliver much faster data transfer near an AI processor. SK Hynix is a leading HBM supplier, so rising demand for AI accelerators can increase its revenue, margins and strategic importance.
Is SK Hynix still the HBM market leader?
Yes, on revenue share. Counterpoint estimated that SK Hynix held 50% of HBM revenue in Q2 2026, down from 64% a year earlier as Samsung reached approximately 33%. Two qualifiers matter. Counterpoint notes that most of that revenue is still HBM3E, so the table measures the outgoing generation. And in conventional DRAM SK Hynix is no longer first at all: TrendForce puts Samsung ahead at 39.4% of industry revenue against SK Hynix's 24.9% in the same quarter.
Is SK Hynix stock cheap based on its forward P/E?
The forward P/E appears low relative to many technology companies, but memory stocks often look cheapest when earnings are near a cyclical peak. Investors should evaluate normalized earnings, capital expenditure and free cash flow instead of relying on one multiple.
Could the AI memory supercycle end in oversupply?
Yes. HBM demand can continue rising while industry capacity grows even faster. The key risks are slower hyperscaler spending, aggressive capacity additions and improving output from Samsung and Micron.
Is SK Hynix still the biggest memory company?
Not in DRAM. TrendForce put Samsung first with 39.4% of second-quarter 2026 DRAM industry revenue, SK Hynix second at 24.9% and Micron third at 23.3%. SK Hynix still leads high-bandwidth memory specifically, at 50% of HBM revenue. The two facts are compatible: HBM is a slice of the DRAM market, and SK Hynix leads the slice while trailing the whole.
Why did SK Hynix grow more slowly than Samsung and Micron last quarter?
Because of its own product mix. TrendForce found that HBM made up the highest proportion of SK Hynix's bit shipments among the three big suppliers, and HBM largely sells under multi-year agreements. When conventional DRAM contract prices spiked in the quarter, rivals with more commodity exposure captured more of the increase. SK Hynix's revenue rose 37.9% sequentially against Samsung's 63.4% and Micron's 65.5%.
Conclusion
The 8% surge in SK Hynix stock reflects a fundamentally credible story. AI systems need increasing quantities of high-performance memory, inventories remain tight, HBM manufacturing is difficult and SK Hynix has translated its technology leadership into record operating results.
The company has also moved beyond HBM3E. It is shipping HBM4, sampling HBM4E, negotiating multi-year customer agreements, expanding production and returning substantial free cash flow to shareholders.
Nevertheless, declaring a permanent supercycle would be premature. SK Hynix's HBM market share is falling as Samsung gains ground, and in the wider DRAM market SK Hynix has already slipped to second place behind Samsung, growing more slowly in the quarter than either rival. Micron is expanding its own HBM4 business. Industry capital spending is accelerating, and the stock's low forward valuation partly reflects the market's expectation that extraordinary margins will eventually normalise.
The most balanced conclusion is that the AI memory upcycle still has strong fundamental momentum, but the stock has entered a stage where execution matters more than excitement. Investors should watch market share, HBM4E qualifications, memory pricing, capital intensity and hyperscaler spending rather than assuming every AI model announcement permanently raises intrinsic value.
Use SimianX AI to combine SK Hynix’s financial performance, analyst revisions, technical trends and market-moving AI news in a single research workflow. Treat the platform as an analytical aid, independently verify material data and consult a qualified financial professional before making investment decisions.
Related Reading
- AI Capex 2026: Big Tech Now Spends 96% of Its Cash Flow
- 2026 Midterms Meet the Fed: Is a September Rate Cut Dead?
- Global Bond Selloff 2026: 30-Year Yields at 19-Year Highs
- KOSPI Crash 2026: Korea's AI Chip Reckoning Explained
- Why Investors Are Shorting Micron Stock in the AI Boom
- Semiconductor Bear Markets: Every SOX Crash, 1995-2026
- TSMC Stock 2026: Why Nvidia Still Can't Replace Its Fab
- AI Momentum Unwind 2026: Why Semiconductor Stocks Fall
Sources
- SK Hynix 2Q26 financial results
- SK Hynix completes HBM4 development and readies mass production
- SK Hynix ships 12-layer HBM4E samples
- SK Hynix KRW40 trillion share repurchase and cancellation programme
- TrendForce: DRAM industry revenue rises 59.5% QoQ in 2Q26
- Counterpoint Research: global HBM market share, Q2 2026
- Samsung ships industry-first commercial HBM4
- Micron fiscal Q3 2026 results — press release filed as SEC Form 8-K exhibit 99.1
- Micron Form 8-K, 24 June 2026
- Associated Press: global shares mixed as chip stocks rally, 7 September 2026
- SKHY market data and analyst estimates
- US Treasury reporting rates of exchange
Disclosure: This article is for educational and informational purposes only. It does not constitute investment, legal or tax advice. Financial estimates, market prices and analyst targets can change without notice.