
 By Muke
TSMC Q3 2026 Earnings and the Stock Reaction: 20 Quarters of Data
Quick answer: TSMC reported Q3 2026 net income of NT$763.06 billion on October 15, 2026, up 68.7% from a year earlier, on record revenue of US$46.72 billion. The TSM ADR still closed 1.8% lower that day at $422.25 and fell another 2.3% to $412.61 on October 16. It was the third earnings day in a row on which TSM fell despite profit growth above 50%. Across the 20 reports since January 2022, TSM rose on 12 report days and fell on 8, with a median move of +2.65%.
Research date: October 19, 2026. U.S. prices are NYSE closing prices through October 16, 2026; Taiwan prices are TWSE closes. Company figures come from TSMC's earnings releases filed with the SEC on Form 6-K. Calculations and scenarios are labelled separately from company guidance.
TSMC's Q3 profit jumped 69%, revenue set a record, and management guided to another strong quarter. Yet the shares declined.
The apparent contradiction becomes easier to understand once investors separate three things: growth versus last year, performance versus expectations, and the price the market will pay for future earnings.
This page does two jobs. First, it explains the October 2026 reaction step by step: what TSMC reported, when each market traded, how large the beat really was, and what changed in margins, guidance and capital spending. Second, it keeps a permanent reference table of every TSMC earnings-day reaction since 2022, so the latest quarter can be judged against the record rather than against a headline.
The central finding is straightforward: the results support continued business growth, while the stock decline reflects a less generous market valuation, a sector-wide semiconductor selloff and open questions about the returns on heavy investment. It is data and analysis, not a recommendation: SimianX publishes no price target for TSMC.
What Did TSMC Report for Q3 2026?
TSMC reported the following results for the quarter ended September 30, 2026:
| Metric | Q3 2026 result |
|---|---|
| Revenue | NT$1,494.24 billion |
| Revenue in U.S. dollars | US$46.72 billion |
| Revenue growth, Taiwan dollars | +50.9% year over year |
| Revenue growth, U.S. dollars | +41.2% year over year |
| Net income | NT$763.06 billion |
| Net income growth | +68.7% year over year |
| Diluted EPS, ordinary share | NT$29.43 |
| Diluted EPS per ADR unit | US$4.60 |
| Gross margin | 66.4% |
| Operating margin | 58.7% |
| Net profit margin | 51.1% |
Revenue increased 17.6% sequentially in Taiwan dollars (16.2% in U.S. dollars), while net income increased 8.0%. These figures come from TSMC's official earnings release, also filed with the SEC as a Form 6-K.
The currency distinction matters. A 50.9% revenue increase in Taiwan dollars and a 41.2% increase in U.S. dollars describe the same business measured in different currencies. Investors should use one currency consistently when comparing growth rates.
TSMC also raised its full-year outlook: management now expects 2026 revenue to grow about 44% in U.S. dollars, up from "slightly more than 40%" in July, according to the earnings-call transcript and Focus Taiwan.
The headline profit number was impressive. But it answered a backward-looking question: how much better did TSMC perform than a year earlier? A share price also reflects what investors already expected and what they now anticipate for the next several years.
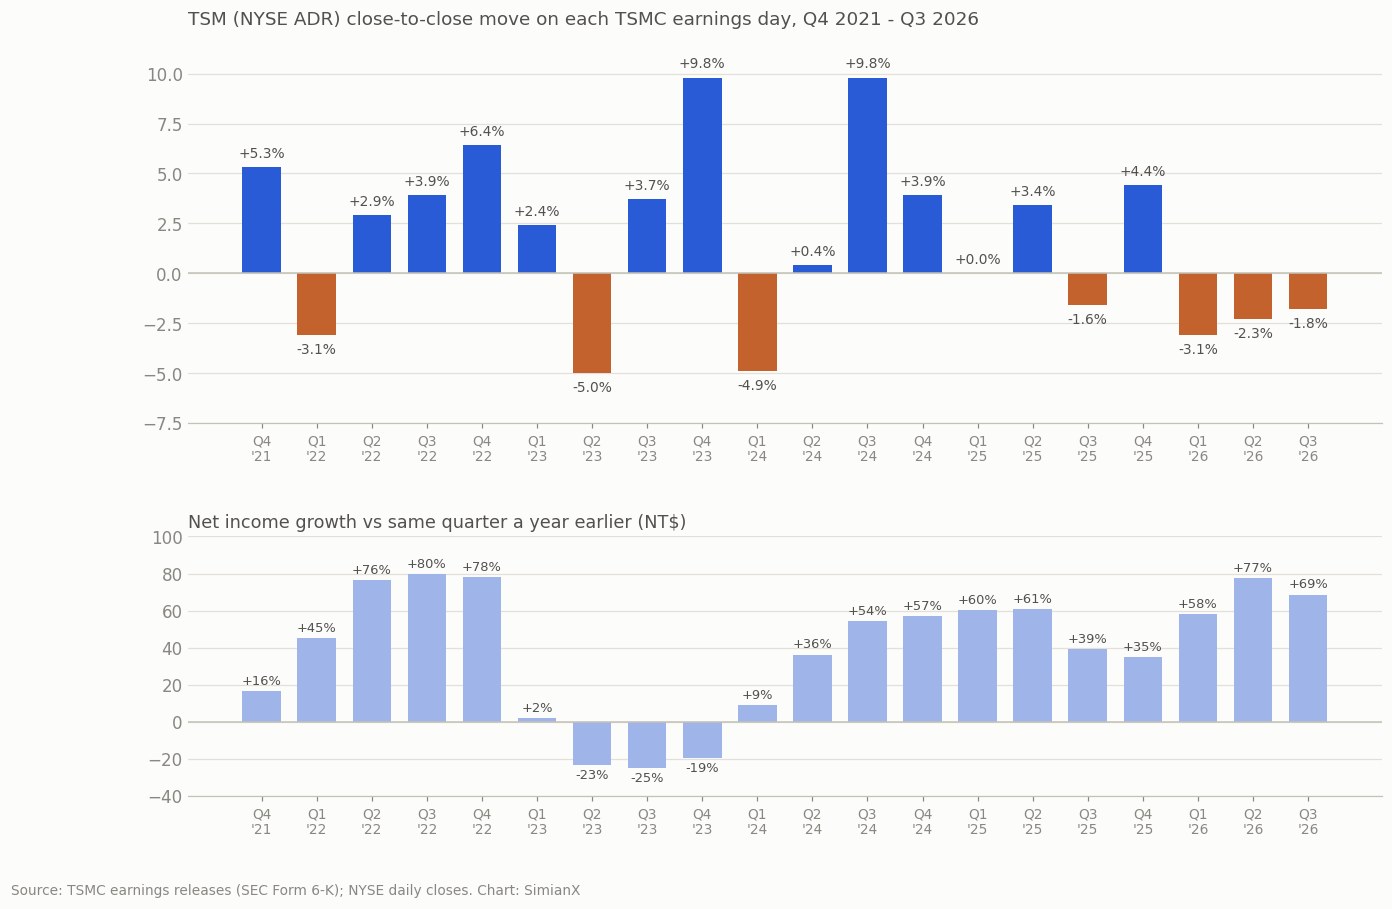
Every TSMC Earnings Reaction Since 2022
TSMC publishes its results in Taipei after the Taiwan market closes, which is the middle of the night in New York. The U.S.-listed ADR therefore reacts on the report date itself, and the Taiwan shares react in the next Taiwan session. The table measures the ADR from the previous day's close to the report-day close, the 5-day move from the previous close to the fifth session after the report, and the Taiwan ordinary shares (2330) in the first session after the report.
| Quarter | Report date | Net income (NT$ B) | Net income YoY | Gross margin | EPS per ADR | TSM on report day | TSM 5-day | Taiwan (2330) next session |
|---|---|---|---|---|---|---|---|---|
| Q3 2026 | Oct 15, 2026 | 763.06 | +68.7% | 66.4% | $4.60 | −1.8% | n/a | −0.8% |
| Q2 2026 | Jul 16, 2026 | 706.56 | +77.4% | 67.7% | $4.31 | −2.3% | −0.9% | −7.3% |
| Q1 2026 | Apr 16, 2026 | 572.48 | +58.3% | 66.2% | $3.49 | −3.1% | +2.0% | −2.6% |
| Q4 2025 | Jan 15, 2026 | 505.74 | +35.0% | 62.3% | $3.14 | +4.4% | +2.4% | +3.0% |
| Q3 2025 | Oct 16, 2025 | 452.30 | +39.1% | 59.5% | $2.92 | −1.6% | −4.6% | −2.4% |
| Q2 2025 | Jul 17, 2025 | 398.27 | +60.7% | 58.6% | $2.47 | +3.4% | +1.7% | +2.2% |
| Q1 2025 | Apr 17, 2025 | 361.56 | +60.3% | 58.8% | $2.12 | 0.0% | +8.9% | +0.4% |
| Q4 2024 | Jan 16, 2025 | 374.68 | +57.0% | 59.0% | $2.24 | +3.9% | +7.3% | +1.4% |
| Q3 2024 | Oct 17, 2024 | 325.26 | +54.2% | 57.8% | $1.94 | +9.8% | +5.6% | +4.8% |
| Q2 2024 | Jul 18, 2024 | 247.85 | +36.3% | 53.2% | $1.48 | +0.4% | −6.4% | −3.5% |
| Q1 2024 | Apr 18, 2024 | 225.49 | +8.9% | 53.1% | $1.38 | −4.9% | −1.8% | −6.7% |
| Q4 2023 | Jan 18, 2024 | 238.71 | −19.3% | 53.0% | $1.44 | +9.8% | +13.2% | +6.5% |
| Q3 2023 | Oct 19, 2023 | 211.00 | −24.9% | 54.3% | $1.29 | +3.7% | −2.4% | +1.8% |
| Q2 2023 | Jul 20, 2023 | 181.80 | −23.3% | 54.1% | $1.14 | −5.0% | −3.6% | −3.3% |
| Q1 2023 | Apr 20, 2023 | 206.99 | +2.1% | 56.3% | $1.31 | +2.4% | −4.1% | −0.4% |
| Q4 2022 | Jan 12, 2023 | 295.90 | +78.0% | 62.2% | $1.82 | +6.4% | +11.3% | +2.8% |
| Q3 2022 | Oct 13, 2022 | 280.87 | +79.7% | 60.4% | $1.79 | +3.9% | −0.8% | +4.3% |
| Q2 2022 | Jul 14, 2022 | 237.03 | +76.4% | 59.1% | $1.55 | +2.9% | +8.0% | +3.7% |
| Q1 2022 | Apr 14, 2022 | 202.73 | +45.1% | 55.6% | $1.40 | −3.1% | −5.7% | −1.9% |
| Q4 2021 | Jan 13, 2022 | 166.23 | +16.4% | 52.7% | $1.15 | +5.3% | −5.8% | +1.7% |
Q3 2026 5-day move not yet available (fifth session after the report is October 22, 2026). Net income and EPS as first reported. Q1 2025 ADR move was +0.05%.
What the table shows
- 12 up, 8 down. TSM rose on 12 of 20 report days. The median move was +2.65% and the average absolute move was 3.9%.
- Profit growth does not predict the reaction. Two of the three best days came when profit was shrinking: Q4 2023 (net income −19.3%, stock +9.8%) and Q3 2023 (−24.9%, +3.7%). Six times TSM fell on a report day while profit was growing, including all three reports of 2026.
- The 2026 pattern is new. Q1, Q2 and Q3 2026 delivered net income growth of 58.3%, 77.4% and 68.7%, yet the ADR fell 3.1%, 2.3% and 1.8%. It is the only run of three straight report-day declines in the table.
- Taiwan often moves more. The Taiwan shares fell 7.3% in the session after the Q2 2026 report, much more than the ADR, because they also absorb the conference call and the overnight U.S. session.
- Margins rose to a record before slipping. Gross margin climbed from 52.7% in Q4 2021 to 67.7% in Q2 2026, then slipped to 66.4% in Q3 2026 as the 2nm ramp began.
For the same exercise on TSMC's largest customer, see NVDA after earnings: every reaction since 2016.
First, Which TSMC Stock Fell, and When?
TSMC trades as ordinary shares in Taiwan under 2330 and as American depositary receipts in New York under TSM (one ADR equals five ordinary shares).
Those markets operate at different times. Combining their movements into one "earnings reaction" can produce an inaccurate explanation.
| Date and market | Observed movement | Interpretation |
|---|---|---|
| October 14, U.S. ADR | Fell 3.40% to $430.00 | Selling preceded the earnings announcement |
| October 15, Taiwan ordinary shares | Fell 2.01% to NT$2,440 | Regular trading ended before the earnings conference |
| October 15, U.S. ADR | Fell 1.80% to $422.25 | Investors could assess the results and the conference |
| October 16, Taiwan ordinary shares | Fell 0.82% to NT$2,420 | First full Taiwan session after the results |
| October 16, U.S. ADR | Fell another 2.28% to $412.61 | Weakness continued during a wider semiconductor selloff |
The Taiwan session was documented by Focus Taiwan.
Why Does the Taiwan Trading Schedule Matter?
The Taiwan Stock Exchange's regular session ends at 1:30 p.m. TSMC's October 15 earnings conference began at 2 p.m. Taiwan time. Therefore, the Taiwan stock's regular-session decline on October 15 cannot be attributed to investors reacting to comments first delivered during that conference. Those comments could affect later trading, including the U.S. ADR session that night. Sources: TWSE trading rules, TSMC quarterly results page.
This is more than a technical detail. It shows that selling pressure was already present before management discussed the outlook. By the October 14 close, TSM had already fallen 11.5% from its October 5 close of $485.80.
The timing supports a broader market explanation. It does not support treating every decline as a negative verdict on the earnings call.
Reason One: A 69% Profit Increase Was Only a 2.2% Earnings Beat
Investors often confuse the growth rate with the size of the surprise. Reuters reported a pre-announcement LSEG SmartEstimate of NT$746.3 billion for quarterly profit. TSMC earned approximately NT$763.1 billion. Source: Reuters earnings report.
The calculation is:
Profit surprise = actual profit ÷ expected profit − 1
That produces a beat of approximately 2.2%.
The two comparisons tell different stories:
- Versus last year: profit increased almost 69%.
- Versus the published estimate: profit exceeded expectations by approximately 2.2%.
A company can produce exceptional growth without delivering an exceptional surprise.
Consider an illustrative example. If investors expect earnings to increase from $10 to $17, an actual result of $17.40 represents 74% annual growth but only a modest beat. Whether the stock rises depends partly on what investors had already priced in.
TSMC's reported growth therefore supports the strength of the business. It does not, by itself, establish that the shares were undervalued before the announcement.
Reason Two: Much of the Revenue Strength Was Already Visible
TSMC publishes monthly revenue, giving investors more information before quarterly earnings than they receive from most other companies.
On October 8, TSMC disclosed September revenue of NT$511.86 billion, up 54.6% year over year. It also reported January–September revenue of NT$3,898.73 billion. Source: TSMC September revenue report.
By the earnings date, investors could already calculate most of the quarter's revenue in Taiwan dollars.
That shifted attention toward information that remained uncertain:
- Manufacturing profitability
- Tax and non-operating effects
- Cash generation
- Capital spending
- The next quarter's guidance
- The cost of overseas expansion
TSMC's US$46.72 billion revenue exceeded the midpoint of its previous guidance (US$44.6–45.8 billion, midpoint US$45.2 billion) by approximately 3.4%. It exceeded the top of the range by approximately 2.0%. Source: TSMC Q2 2026 release with Q3 guidance.
Those are positive comparisons. However, previously published monthly sales reduced the surprise in the quarterly revenue headline.
This is why "record revenue" and "stock declines" can coexist. The market responds most strongly to information that changes its expectations.
Reason Three: Margins Declined Sequentially
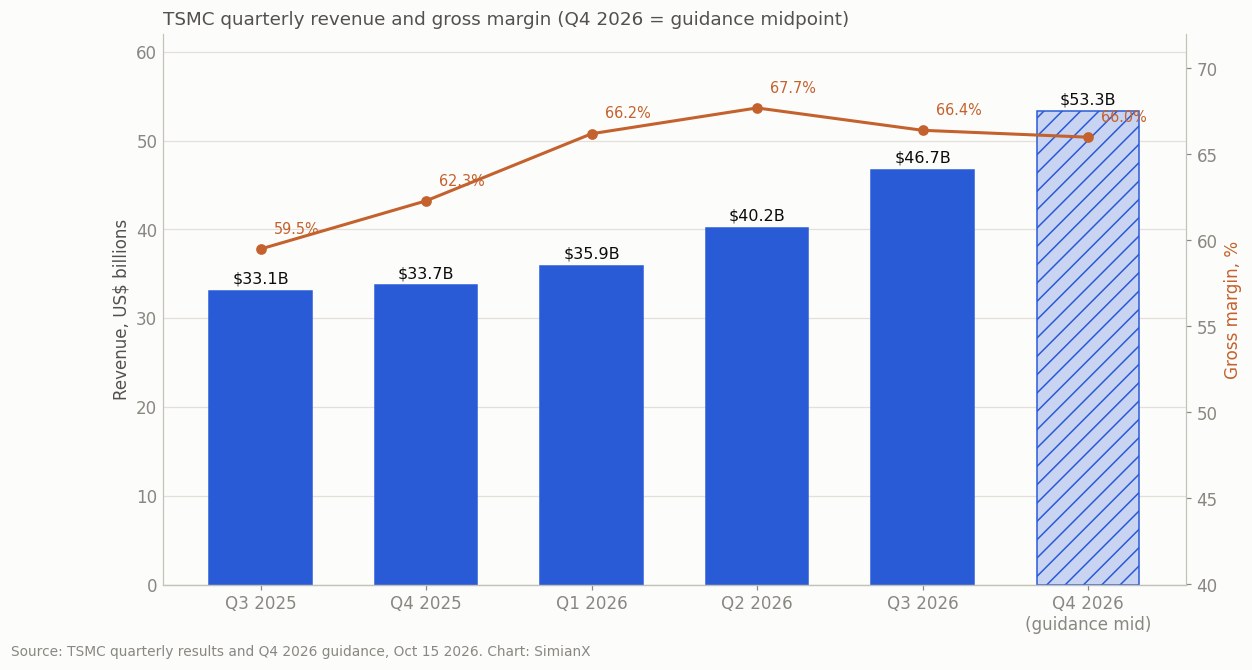
The third-quarter gross margin of 66.4% was below the second quarter's 67.7%.
TSMC attributed the 1.3-percentage-point decline primarily to margin dilution from the ramp of its 2nm process. Gross margin nevertheless remained well above the 59.5% recorded a year earlier. Source: TSMC Q3 2026 results page.
Both observations matter:
- Annual profitability improved substantially.
- Sequential profitability moderated.
It would be inaccurate to describe the quarter as a broad margin collapse. It would also be incomplete to ignore the sequential decline.
Why Can a Better Manufacturing Process Initially Reduce Margins?
A new process requires substantial spending before it reaches mature efficiency.
Early production can involve:
- Lower equipment utilization
- Longer manufacturing cycles
- Additional engineering support
- Yield improvement work
- New depreciation expense
- Higher costs per usable chip
As production matures, a manufacturer can spread fixed costs across more output and improve the number of functional chips produced from each wafer.
That gives investors two plausible interpretations.
The bullish interpretation is that today's costs support tomorrow's production leadership. The bearish interpretation is that frequent technology transitions and expensive global expansion could keep consuming more of the benefits from revenue growth.
The next few quarters will help distinguish those outcomes.
Did TSMC's Q4 Guidance Disappoint?
The guidance was strong on revenue and more restrained on margins.
| Metric | Q3 actual | Q4 guidance | Q4 midpoint |
|---|---|---|---|
| Revenue | US$46.72 billion | US$52.3–54.3 billion | US$53.3 billion |
| Gross margin | 66.4% | 65%–67% | 66.0% |
| Operating margin | 58.7% | 56.5%–58.5% | 57.5% |
These are the figures published in TSMC's earnings release, based on an exchange rate of 31.8 Taiwan dollars per U.S. dollar.
At the midpoint, revenue would increase approximately 14.1% sequentially, while gross margin would decline by 0.4 percentage point.
That combination can disappoint investors seeking both rapid revenue growth and continued margin expansion. However, a definitive claim that guidance "missed consensus" requires a reliable, time-stamped consensus series. The company's published figures alone do not establish such a miss.
Lower Margin Does Not Necessarily Mean Lower Profit
Using the reported revenue and margin figures:
- Q3 revenue multiplied by gross margin implies roughly US$31.0 billion of gross profit.
- Q4 midpoint revenue multiplied by midpoint gross margin implies roughly US$35.2 billion.
This illustrative calculation suggests approximately 13.4% sequential growth in gross-profit dollars, despite the lower margin percentage.
It is not a net-income forecast. Exchange rates, expenses, taxes and non-operating items also matter.
Still, the arithmetic explains why the operating outlook remained constructive even as investors debated profitability.
Reason Four: The Selloff Extended Across AI and Semiconductor Stocks
TSMC's decline occurred during a wider reassessment of technology shares.
On October 15, its ADR fell as much as 5.3% intraday (to $407.13) before recovering to close 1.8% lower. Reuters described a continued selloff in technology and chip stocks driven by concerns about AI spending and higher interest rates; AI data-center operator CoreWeave fell another 1.8% after a 15% drop the previous day. Source: Reuters global-markets report. Chip designers such as Nvidia trade on the same AI-spending expectations. The iShares Semiconductor ETF (SOXX) fell 0.9% on October 15 and 4.1% on October 16, so on October 16 TSM actually held up better than the chip sector as a whole.
The evidence supports a conclusion that sector conditions contributed to TSMC's weakness. It does not allow an exact percentage of the stock decline to be assigned to each cause. The same rates-and-AI-funding mechanism drove the earlier 2026 AI momentum unwind, and the full record of chip-stock drawdowns is in every SOX semiconductor bear market.
How Do Higher Rates Affect a Company With Strong Profits?
Higher interest rates can affect TSMC through two channels.
First, investors may apply a higher discount rate to future cash flows, reducing the present value of the business.
Second, financing becomes more expensive for customers building data centers and purchasing computing infrastructure. That can change the timing or scale of their investment plans.
TSMC can therefore remain profitable while its valuation multiple contracts and investors become more cautious about downstream demand.
A strong balance sheet offers protection, but it cannot prevent changes in market valuation.
Reason Five: Investors Are Examining the Returns on Heavy Capital Spending
TSMC kept its 2026 capital expenditure budget at US$60–64 billion.
That is a large commitment, but it was not a fresh increase at the October earnings announcement: management "reiterated" the range on the call, and Focus Taiwan reported the budget as unchanged. Management added that capex for 2026–2028 is expected to be significantly higher than in the previous three years.
This corrects a common interpretation of the selloff: investors were assessing a high spending commitment, not reacting to a newly announced October budget increase.
What Does the Budget Imply for Q4?
TSMC's financial statements show approximately US$40.64 billion of capital expenditure during the first nine months. Subtracting that amount from the annual budget implies approximately US$19.36–23.36 billion in Q4 if the company finishes within the range. This is arithmetic based on management's budget, not a separate quarterly forecast. Source: TSMC Q3 2026 financial statements.
A heavy spending quarter can reduce free cash flow even while reported revenue and earnings grow.
The longer-term question is whether new equipment and factories produce returns above their cost of capital. A semiconductor factory creates value when customer demand, pricing and utilization compensate for its construction and operating costs. Revenue growth alone cannot prove that every expansion project will achieve that. The same question hangs over the whole AI buildout; see AI capex 2026: Big Tech now spends 96% of its cash flow.
Overseas Factories Add a Lasting Cost Question
Management estimated that overseas factories would dilute the company's 2026 gross margin by closer to 2 percentage points, with dilution widening to 3 to 4 percentage points over the next few years.
During the question-and-answer session, management confirmed that the 3-to-4-point range refers to the next several years. Investors should avoid presenting it as a precise new forecast for 2027 alone.
Management also said that a possible expansion in Texas, and talks with a customer about its planned Terafab capacity, remained under discussion. These were exploratory discussions, not a completed project with disclosed economics. Source: TSMC earnings-call transcript.
Overseas manufacturing may improve customer access and geographic resilience. It can also increase labor, construction and operating costs.
Those effects create a trade-off: a more geographically diversified company may deserve a lower risk discount, while a more expensive production footprint may reduce margins. Investors must weigh both when choosing a valuation.
Does the Quarter Show That AI Demand Is Weakening?
The results provide little evidence of an immediate collapse in demand for TSMC's advanced production.
The company's presentation and management report showed:
- High-performance computing represented 68% of revenue.
- Smartphones represented 21%.
- Advanced processes at 7nm and below represented 79% of wafer revenue.
- The 2nm process contributed 8% of wafer revenue.
- The 3nm process contributed 33%.
These measures use different denominators: platform revenue and wafer revenue should not be treated as interchangeable. Source: TSMC Q3 2026 presentation.
HPC Is Broader Than AI
High-performance computing includes more than AI accelerators. Investors should not label all HPC revenue as "AI revenue." The growing HPC share nevertheless shows that TSMC's business has shifted toward computing applications with demanding manufacturing requirements. On the call, management said demand for AI accelerators is spreading into agentic AI workloads, including CPUs and networking chips.
The concern is more forward-looking: will AI customers keep generating enough economic value to sustain their spending plans?
Chip orders can remain strong before infrastructure spending slows. Investors therefore monitor several layers of the value chain:
| Layer | Evidence to examine |
|---|---|
| Semiconductor manufacturing | Utilization, wafer demand, yields and pricing |
| Hardware systems | Server shipments and order conversion |
| Cloud infrastructure | Capacity utilization and financing costs |
| AI services | Revenue, customer retention and cash generation |
| Enterprise adoption | Productivity gains and willingness to pay |
Weakness in one layer does not automatically invalidate the others. It can, however, change future demand expectations. The memory side of the same chain is covered in our SK Hynix analysis and Samsung Electronics stock history.
Why the 2nm Ramp Still Supports the Investment Case
TSMC's 2nm technology uses nanosheet transistors and targets improvements in performance, power consumption and density. The company positions it for both smartphones and high-performance computing. Source: TSMC advanced technology overview.
For customers constrained by electricity, cooling and chip area, manufacturing improvements can have economic value beyond the wafer price. A more efficient chip may reduce the cost of operating an entire system. That gives a leading manufacturer potential pricing power, one reason Nvidia still can't replace TSMC.
However, investors should evaluate the realized economics:
- Are customers adopting the process at scale?
- Are yields improving?
- Does pricing cover the additional manufacturing cost?
- Does the process earn an attractive return after depreciation?
- Can advanced packaging keep pace with wafer production?
Technology leadership is most valuable when it translates into dependable production and cash returns.
What Does Cash Flow Say About Earnings Quality?
The cash-flow evidence provides an important counterweight to concerns about investment spending.
For Q3, TSMC reported approximately:
| Cash-flow measure | NT$ billion |
|---|---|
| Operating cash flow | 919.77 |
| Capital expenditure | 443.21 |
| Free cash flow | 476.56 |
Free cash flow increased from NT$287.36 billion in Q2. The management report also disclosed NT$2,985.40 billion of net cash reserves (cash and marketable securities minus interest-bearing debt). Source: TSMC Q3 2026 management report.
These figures support the view that TSMC's expansion rests on substantial internally generated cash and financial resources.
Two cautions remain.
First, quarterly cash flow fluctuates with taxes, working capital and equipment payments. One strong quarter should not be multiplied by four without adjustment.
Second, the increase in total cash balances included other investing inflows associated with U.S. investment tax credits. The entire cash-balance increase should not be described as recurring operating free cash flow.
For investors, the useful test is sustained cash generation after capital expenditure across several quarters.
This is also a good task for a research workflow in SimianX AI: compare earnings, cash generation and investment requirements, then verify the underlying figures against company filings.
Is TSMC Stock Cheap After the Decline?
The pullback improved the entry price. Whether it created a bargain depends on future earnings and the multiple investors consider appropriate.
TSM closed October 16 at $412.61, approximately 15.1% below its October 5 closing price of $485.80. That is a comparison between two dated closes, not a claim about the stock's all-time high.
Annualizing the reported Q3 ADR earnings of $4.60 produces $18.40.
At $412.61, the stock trades at approximately 22.4 times that annualized quarterly earnings figure.
This is neither a trailing P/E nor a consensus forward P/E. It is a simplified reference point with significant limitations:
- One quarter may not represent a full year.
- Currency translation can change ADR earnings.
- Margins may improve or weaken.
- Taxes and non-operating items fluctuate.
- New depreciation follows capital investment.
An Illustrative Valuation Matrix
The following table uses hypothetical annual ADR earnings and assumed P/E multiples. These are analytical inputs, not company forecasts or price targets.
| Annual ADR EPS assumption | 18× P/E | 22× P/E | 26× P/E |
|---|---|---|---|
| $17 | $306 | $374 | $442 |
| $20 | $360 | $440 | $520 |
| $23 | $414 | $506 | $598 |
The table shows why strong earnings growth does not guarantee strong investment returns.
If earnings rise 20% but the valuation multiple falls from 25 times to 20 times, the implied share price declines approximately 4%.
Earnings growth and valuation changes work together. Investors need a defensible view of both.
What Are the Bull and Bear Cases After Q3?
The Bull Case
The bullish argument is that TSMC remains a critical supplier to a growing computing market, while its new production investments strengthen its ability to serve customers.
Under this interpretation:
- Advanced manufacturing remains difficult to replicate.
- New processes support customer performance and energy needs.
- Early production costs decline as yields mature.
- Additional output converts demand into revenue.
- Strong cash generation finances expansion.
- A lower share price improves prospective returns.
This thesis does not require every AI application company to succeed. It requires a sufficiently large and durable market for advanced chips.
The Bear Case
The bearish argument focuses on the relationship between demand expectations and manufacturing commitments.
Under this interpretation:
- Customers may moderate spending after a rapid buildout.
- Overseas production increases structural costs.
- New equipment raises depreciation.
- High utilization may prove difficult to sustain.
- Strong current earnings encourage investors to overestimate normalized profitability.
- Higher required returns keep valuation multiples under pressure.
TSMC could remain a technologically strong company while generating disappointing shareholder returns from an expensive entry price.
A Scenario Framework
| Scenario | Business outcome | Evidence that would support it |
|---|---|---|
| Bull | Strong demand and better manufacturing efficiency produce durable cash growth | Improving yields, healthy utilization and strong cash conversion |
| Base | Revenue expands while investment and overseas costs limit margin gains | Solid sales with uneven quarterly free cash flow |
| Bear | Customer spending slows while new capacity and depreciation arrive | Weaker utilization, inventory growth and downward earnings revisions |
These scenarios organize uncertainty. They do not provide reliable probabilities by themselves.
What Should Investors Watch Next?
A useful monitoring plan concentrates on a small group of indicators.
- Monthly revenue: Compare the developing quarter with the company's guidance using consistent currencies. TSMC publishes October revenue around November 10.
- Gross margin: Determine whether new-process costs stabilize as production matures.
- Operating margin: Check whether revenue growth covers the increase in research and other operating expenses.
- Capital expenditure: Track cash spending against the annual budget and the 2027 budget expected with Q4 results in January.
- Free cash flow: Examine several quarters rather than one favorable period.
- Customer investment: Watch actual infrastructure deployment and utilization, alongside announced spending commitments.
- Overseas economics: Look for evidence that productivity and pricing offset higher regional costs.
- Inventory and receivables: Rising balances can provide early warnings when compared with revenue growth.
- Earnings revisions: Determine whether analyst estimates rise, remain stable or fall after the announcement.
- Relative stock performance: Compare TSM with semiconductor benchmarks to distinguish company weakness from sector pressure.
The interpretation depends on how these indicators combine.
A falling stock with stable or improving earnings estimates can indicate valuation compression. A falling stock accompanied by weaker utilization and repeated earnings cuts suggests a more serious operating change.
Should Investors Buy TSMC After Earnings?
The quarter strengthens the case for studying TSMC as a long-term holding. It does not establish an automatic buying opportunity at any price.
For an existing shareholder, the important question is whether the reasons for ownership have changed. A decline caused partly by sector conditions is different from evidence that manufacturing leadership or customer demand has deteriorated.
For a new investor, the question is whether a conservative earnings and valuation model offers an adequate return.
A practical decision process is:
- Choose a realistic holding period.
- Estimate earnings under several operating conditions.
- Apply a range of valuation multiples.
- Include Taiwan, currency and industry-cycle risks.
- Decide how much uncertainty the purchase price compensates for.
- Revisit the thesis when new operating evidence arrives.
Staged purchases can reduce dependence on one entry date, but they do not protect against an incorrect business thesis.
The most useful discipline is to write down what would change the investment decision. That might include sustained margin deterioration, weaker customer investment or a valuation that already assumes an unusually favorable outcome.
FAQ: Why Did TSMC Stock Fall After Q3 Earnings?
Why did TSMC stock fall despite a 69% profit increase?
The growth rate compared profit with the prior year, while the beat versus the published profit estimate was approximately 2.2%. The stock also faced a broader semiconductor selloff, valuation pressure and questions about manufacturing costs. TSM closed 1.8% lower on October 15 and 2.3% lower on October 16.
How does TSM usually react to earnings?
Across the 20 reports from January 2022 to October 2026, the ADR rose on 12 report days and fell on 8, with a median move of +2.65% and an average absolute move of 3.9%. The best days were +9.8% (Q4 2023 and Q3 2024); the worst was −5.0% (Q2 2023). The last three reports, all in 2026, were followed by declines.
Did TSMC miss its Q3 revenue guidance?
No. Reported revenue of US$46.72 billion exceeded the top of the company's US$44.6–45.8 billion guidance. Monthly revenue disclosures had already given investors considerable visibility into the quarter before earnings.
Did TSMC raise capital expenditure again in October?
No. Management reiterated its 2026 range of US$60–64 billion. The size and future returns of that budget remained important questions even without a new increase.
Does the margin decline mean TSMC is losing its competitive position?
The sequential decline was attributed mainly to the 2nm ramp, with overseas fabs a further drag. Investors need later evidence on yields, utilization and pricing before concluding that it represents lasting competitive damage.
When does TSMC report next?
TSMC reports fourth-quarter 2026 results in mid-January 2027; the company confirms the exact date on its investor relations calendar. Monthly revenue for October, November and December comes first, around the 10th of each following month.
Is the post-earnings decline a buying opportunity?
Potentially, if conservative earnings assumptions support an attractive return at the purchase price. A lower price helps, but investors still need to account for capital intensity, customer spending cycles and geopolitical exposure.
Conclusion: Strong Earnings Met a More Demanding Market
TSMC's Q3 report showed substantial growth and strong cash generation. The share-price decline reflected a different set of questions: how much growth was already expected, what new manufacturing capacity will cost, and what valuation future earnings deserve.
The timeline is essential. Selling began before the earnings announcement, and Taiwan's October 15 regular session ended before the conference. The U.S. ADR then traded through the results during a wider semiconductor retreat.
The financial details also resist a simple negative explanation. Revenue beat guidance, the full-year outlook was raised, and the next quarter's sales guidance implied further expansion. Margins moderated, but a lower margin percentage can still accompany higher profit dollars. Capital spending remained heavy, yet the annual budget was reiterated rather than increased.
The 20-quarter table puts the reaction in proportion: a 1.8% decline is smaller than TSM's average earnings-day move, and the stock has fallen after strong quarters before. For investors, the opportunity depends on the relationship between future cash earnings and the price paid today.
You can run a live, multi-model AI analysis of TSM in the SimianX live analysis room, review its fundamentals on the TSM stock page, or browse more reference tables in the SimianX story library.
How this page is updated: after each TSMC quarterly report (mid-January, April, July and October), a new row is added at the top of the reaction table and the statistics are recalculated. Last updated October 19, 2026; next update after the Q4 2026 report in January 2027.
Related Reading
- TSMC Stock 2026: Why Nvidia Still Can’t Replace Its Fab
- NVDA After Earnings: Every Reaction Since 2016 in One Table
- Semiconductor Bear Markets: Every SOX Crash, 1995–2026
- AI Momentum Unwind 2026: Why Semiconductor Stocks Fall
- AI Spending Surges: TSMC Outlook Confirms Nvidia Demand
- SK Hynix Stock Surges 8%: Is the AI Supercycle Real?
- Samsung Electronics Stock Price 2026: History and Earnings
- South Korea Stock Market Crash 2026 vs Every KOSPI Crash
- AI Capex 2026: Big Tech Now Spends 96% of Its Cash Flow
- More reference tables in the Market history topic hub
References
- TSMC — Q3 2026 earnings release (October 15, 2026)
- SEC EDGAR — TSMC Form 6-K, Q3 2026 results (October 15, 2026)
- SEC EDGAR — TSMC Form 6-K, Q2 2026 results and Q3 guidance (July 16, 2026)
- SEC EDGAR — TSMC filing index (all quarterly earnings releases since 2022)
- TSMC — Q3 2026 results, guidance and document library
- TSMC — Q3 2026 financial statements
- TSMC — Q3 2026 management report
- TSMC — Q3 2026 presentation
- TSMC — Q3 2026 earnings-call transcript
- TSMC — September 2026 revenue report (October 8, 2026)
- TSMC — 2nm technology overview
- TWSE — trading hours rules
- Reuters via Investing.com — Q3 profit versus the LSEG SmartEstimate (October 15, 2026)
- Reuters via MarketScreener — October 15 technology and chip selloff (October 15, 2026)
- Focus Taiwan — October 15 Taiwan stock-market session
- Focus Taiwan — revenue outlook and unchanged capital budget