Back to Leaderboard
Cosmos Hub
AI Crypto Asset Analysis

Cosmos Hub

ATOM

The Cosmos network consists of many independent, parallel blockchains, called zones, each powered by classical Byzantine fault-tolerant (BFT) consensus protocols like Tendermint. Some zones act as hubs with respect to other zones, allowing many zones to interoperate through a shared hub. The architecture uses classic BFT and Proof-of-Stake algorithms, instead of Proof-of-Work. Cosmos can interoperate with multiple other applications and cryptocurrencies, something other blockchains can’t do well. By creating a new zone, you can plug any blockchain system into the Cosmos hub and pass tokens back and forth between those zones, without the need for an intermediary.

Market Rank #98Category Smart Contract Platform

Quick Start

Choose an exchange-specific pair and open Live with analysis auto-started for that market.

OKX
Perpetual SwapUSDT

ATOM/USDT

OKX

Avg Win Rate

100.0%

Best Timeframe

1m

Analysis for ATOM/USDT

The selected pair shows the latest fundamental and news analysis, together with analyzed time.

Fundamental Analysis

Last analyzed

This analysis is more than 14 days old. Its levels and news may no longer apply; start a live analysis for a current read.

The overall trend is mildly bullish, with short-term momentum outweighing longer-term consolidation.

ATOM/USDT-SWAP Analysis (OKX Exchange)

As an expert crypto fundamental analyst, I'll provide a detailed technical analysis of the ATOM/USDT perpetual swap trading pair based on the provided data. Note that while the query requests a "fundamental analysis," the dataset focuses on price action, volume, and technical indicators across multiple timeframes (1m to 1D). I'll interpret this as a comprehensive technical analysis grounded in market behavior, with references to ATOM's underlying fundamentals (e.g., Cosmos Hub's role as an interoperability platform for blockchains using Tendermint BFT consensus). Cosmos (ATOM) enables "zones" (independent blockchains) to connect via its hub, positioning it as a key player in multi-chain ecosystems. However, price trends are influenced by broader crypto market sentiment, Bitcoin dominance, and ecosystem developments like IBC (Inter-Blockchain Communication) adoption. The current price is $1.858, with a market cap rank of 98 and fully circulating supply (~483M ATOM), indicating moderate liquidity but vulnerability to volatility.

This analysis draws from the candlestick data, indicators (RSI, MACD, EMAs, Bollinger Bands, ATR, volume), and multi-timeframe structure. All timestamps appear to be in a future epoch (2026), but I'll treat them as relative for trend identification.

1. Trend Analysis - What's the Overall Trend?

The overall trend for ATOM is mildly bullish in the short term but consolidating within a broader downtrend from recent highs. Here's the reasoning across timeframes:

  • Short-term (1m and 5m): Strongly bullish momentum. On the 1m chart, prices have climbed from ~$1.849 (21 periods ago) to $1.858, forming higher highs and higher lows (e.g., from $1.849 low to $1.860 high). Volume spiked during the upmove (e.g., 5,245 units at $1.859), indicating buying interest. The 5m chart shows a sharp recovery from $1.842 (earlier dip) to $1.858, with a 21-candle range of $1.842–$1.863. This suggests a short-term impulse wave upward, driven by momentum.

  • Medium-term (15m and 1H): Neutral to bullish recovery. The 15m shows a dip to $1.841 followed by a rebound to $1.858, with prices stabilizing above the 20-period SMA ($1.85). On the 1H, ATOM bottomed at $1.835 (earlier in the period) and rallied to $1.896 before pulling back to $1.858, now trading near the 20-period SMA ($1.86). The trend is upward from the session low but lacks conviction, as it's within a 24-hour range of $1.835–$1.896.

  • Longer-term (4H and 1D): Bearish correction within an uptrend. The 4H chart reveals a peak at $1.896 (recent high) followed by a decline to $1.841, now recovering to $1.858—still above the 20-period SMA ($1.83) but below the 50-period SMA ($1.80? Wait, data shows $1.80 for SMA50, but contextually it's rising). Over 21 days (1D), ATOM has fallen from $2.347 (early February high) to $1.858, a ~20% drawdown, but with bounces (e.g., from $1.703 low to $1.896). The monthly candle (February 2026) closed at $1.858 (up from $1.793 open), showing resilience amid broader market pressure. Fundamentally, this aligns with Cosmos' ecosystem growth (e.g., increasing zone integrations), but external factors like BTC correlation (ATOM often follows altcoin rotations) have capped upside.

Overall, the trend is upward on shorter timeframes (bullish impulse) but range-bound on longer ones, suggesting a potential continuation of the recovery if volume sustains. ATR values increase with timeframe (0.0014 on 1m to 0.0836 on 1D), indicating higher volatility long-term, typical for ATOM during interoperability hype cycles.

2. Key Support and Resistance Levels - Where Are Critical Price Points?

Critical levels are derived from recent highs/lows, EMAs, SMAs, and Bollinger Bands. These act as psychological and technical barriers:

  • Support Levels:

    • Immediate: $1.849–$1.851 (recent 1m/5m lows and 20-period SMA on 5m/15m at ~$1.85). This held during the latest dip, with volume absorption (e.g., 61,030 units on 5m at $1.844).
    • Strong: $1.842–$1.844 (15m low from 21 candles ago; aligns with 1H lower Bollinger Band at $1.84). A break here could test $1.835 (4H session low).
    • Deeper: $1.80–$1.82 (50-period SMA on 1H/4H; 1D lower Bollinger Band at $1.64 is too distant, but $1.80 was a multi-day base). Fundamentally, this zone coincides with ATOM's historical support during bear phases, near its all-time low relative to ecosystem TVL.
  • Resistance Levels:

    • Immediate: $1.859–$1.860 (recent 1m/5m highs; upper Bollinger Band on 1m/5m at $1.86).
    • Strong: $1.863–$1.867 (1H/4H recent highs; 20-period EMA on 1H at $1.86). Breaking this could target $1.873 (4H high).
    • Upper: $1.896 (multi-timeframe high from 1H/4H/1D; upper Bollinger Band on 1D at $2.08). This is a key pivot—failure here signals exhaustion.

These levels are reinforced by volume: Upside breaks above $1.86 saw spikes (e.g., 37,298 on 15m), while downside tests at $1.84 had high selling volume (80,553 on 15m). ATR suggests daily moves of ~$0.084, so watch for $0.01–$0.03 breaches.

3. Market Structure and Sentiment - How Is the Market Positioned?

Market structure shows a bullish internal structure with bearish external pressure, and sentiment leaning overbought short-term but neutral longer-term.

  • Structure: Higher highs/lows on 1m/5m (bullish breaks above EMAs), but 15m/1H forms a descending triangle (highs at $1.86–$1.90, lows at $1.84), resolved upward recently. On 4H/1D, it's a flag pattern post-$1.896 peak, with the pole from $1.70 lows—suggesting consolidation before potential breakout. Volume profile: Current 1H volume (46,230) is below 20-period SMA (230,122), indicating low conviction; however, 4H volume (385,332) is solid vs. SMA (554,492), showing accumulation. Quote volume (e.g., $71M on 4H) points to USDT inflows, bullish for perps with 50x leverage.

  • Sentiment (via Indicators):

    • RSI (14): Overbought short-term (76.92 on 1m, 88.89 on 5m—warning of pullback), neutral on 15m (57.14), and balanced longer-term (54.55 on 1H, 62.68 on 4H, 55.43 on 1D). No extreme fear/greed; ATOM's RSI often spikes during Cosmos upgrades.
    • MACD: Bullish divergence short-term (positive histogram on 1m/5m/4H, e.g., 0.0015 on 5m), but bearish on 15m/1H (negative histogram -0.0018). 1D shows recovery (histogram 0.0117 from -0.0707), signaling momentum shift.
    • Moving Averages: Price above short EMAs (e.g., EMA12 $1.86 on 1H) but testing longer ones (EMA50 $1.84 on 1H). Golden cross potential if 1H EMA12 crosses above EMA26.
    • Bollinger Bands: Price hugging upper band on short timeframes ($1.86 upper vs. $1.85 middle), squeeze on 1D (bands $1.64–$2.08), implying volatility expansion soon.
    • Volume and Other: Declining volume on upticks (e.g., low 753 on latest 5m) suggests fading momentum; ATR rising indicates choppiness. Sentiment is cautiously optimistic—ATOM benefits from Cosmos' fundamentals (e.g., no max supply allows inflation for staking rewards, ~20% APY), but rank 98 shows altcoin underperformance vs. top chains like ETH/SOL.

Overall, structure favors bulls if $1.85 holds, but low volume hints at manipulation risk in perps. Broader sentiment: Neutral, with potential positive catalysts like IBC volume growth.

4. Overall Directional Bias - Bullish, Bearish, or Neutral?

Mildly Bullish. Short-term momentum (higher lows, positive MACD histogram) outweighs longer-term consolidation, with price above key EMAs and recovering from $1.84 lows. However, overbought RSI and volume fade temper enthusiasm—bias flips bearish below $1.84. Fundamentally, Cosmos' interoperability edge (e.g., connecting 100+ zones) supports upside in a multi-chain bull market, but current price (~60% below 2024 ATH) reflects ecosystem competition. Traders: Long above $1.86 with stops at $1.84; target $1.90. Leverage cautiously (max 50x amplifies ATR swings).

Confidence Score: 65/100 (Moderately bullish; strong short-term signals but mixed longer-term indicators reduce certainty. 100 = strongly buy, 0 = strongly sell).

This analysis is for informational purposes; always DYOR and consider risk management. Data as of timestamp 1773444786014.


News Analysis

Last analyzed

This analysis is more than 14 days old. Its levels and news may no longer apply; start a live analysis for a current read.

The analysis indicates a bearish outlook for ATOM due to rising oil prices and a strengthening dollar, counteracted by potentially bullish signals from stablecoin inflows and regulatory progress.

1. News Impact Analysis

Oil Surges Past $100: Freight & Food Prices Spike

  • What happened? Oil prices have surged past $100 per barrel due to escalating conflicts in Iran, affecting global markets and supply chains.
  • Why does it matter for ATOM? Rising oil prices can lead to increased inflation, which often results in tighter monetary policies from central banks. This could negatively impact risk assets, including cryptocurrencies like ATOM, as investors typically pull back from speculative investments during inflationary periods.
  • Expected price impact: This news is bearish for ATOM due to anticipated selling pressure as investors may prioritize safer assets amid economic uncertainty.
  • Timeframe: Immediate impact expected within the next 24-72 hours as markets react to inflation fears.

DXY Surges Above 100.00 Triggers Critical Weekly Loss

  • What happened? The DXY (U.S. Dollar Index) has surged, indicating a strengthening dollar, which often correlates with bearish sentiment in crypto markets.
  • Why does it matter for ATOM? A stronger dollar can lead to reduced demand for cryptocurrencies as they become more expensive for international buyers. This could lead to selling pressure on ATOM as investors seek to convert their holdings into USD or other fiat currencies.
  • Expected price impact: Bearish for ATOM, likely to increase selling pressure.
  • Timeframe: Immediate, affecting price sentiment within the next 24-72 hours.

Does $2.53B in new stablecoins signal more upside for the crypto market?

  • What happened? The introduction of $2.53 billion in stablecoins could signal a recovery in the crypto market.
  • Why does it matter for ATOM? An influx of stablecoins can lead to increased liquidity and buying pressure in the crypto market, potentially benefiting ATOM as traders may invest in altcoins with the new liquidity.
  • Expected price impact: Bullish for ATOM, suggesting potential buying pressure.
  • Timeframe: Medium-term impact as market participants digest this new liquidity.

Stablecoin News: HKMA Approves HSBC and Standard Chartered for First Licenses

  • What happened? Hong Kong's Monetary Authority is set to approve licenses for major banks to operate with stablecoins.
  • Why does it matter for ATOM? This regulatory progress can enhance institutional confidence in cryptocurrencies, potentially drawing more investment into the sector and benefiting ATOM.
  • Expected price impact: Neutral to slightly bullish, as it signals regulatory acceptance and potential adoption.
  • Timeframe: Longer-term sentiment shift, but positive in the coming weeks.

US Judge Dismisses Subpoenas Against Fed Chair Powell In DOJ Probe

  • What happened? A U.S. judge dismissed subpoenas against Fed Chair Powell, bolstering the independence of the Federal Reserve.
  • Why does it matter for ATOM? A stable and independent Federal Reserve can lead to more predictable monetary policies, which could be supportive for risk assets, including ATOM.
  • Expected price impact: Neutral, but could lean bullish if it contributes to stable market conditions.
  • Timeframe: Longer-term sentiment impact.

Bitcoin Miners Confront New Landscape with Shrinking Profits and Emerging Opportunities

  • What happened? Bitcoin miners are facing declining revenues, which may affect Bitcoin's price and broader market sentiment.
  • Why does it matter for ATOM? A struggling Bitcoin market could lead to negative sentiment in the entire crypto sector, including ATOM, as investors may sell off altcoins amid fears of Bitcoin's price dropping.
  • Expected price impact: Bearish for ATOM due to overall negative market sentiment.
  • Timeframe: Immediate, affecting market dynamics within 24-72 hours.

2. Market Sentiment

  • Overall sentiment: The absence of Polymarket prediction data limits our insights into immediate trader expectations. However, the combination of bearish news regarding oil prices and the DXY, alongside some bullish signals from stablecoin growth, suggests a mixed sentiment.
  • Confidence indicators: The bearish sentiment from the news is likely to outweigh the bullish signals from new stablecoin liquidity, indicating a lack of confidence among traders in the short term.

3. Synthesize Actionable Insights

  • Overall Direction: Bearish bias for ATOM in the immediate future due to prevailing negative news and market sentiment.
  • Key Catalysts: Watch for new stablecoin investments, potential regulatory news regarding stablecoins, and movements in the DXY that could shift market sentiment.
  • Risk Factors: Continued inflation and geopolitical tensions could exacerbate bearish sentiment. Conversely, any positive news related to institutional adoption of crypto could shift momentum.
  • Trading Recommendation: Traders should be cautious in the short term, potentially looking for short positions or hedging strategies. Monitoring news related to stablecoins and regulatory developments will be key, as well as observing Bitcoin's performance closely, since it heavily influences altcoin prices like ATOM.

In summary, the net impact on ATOM is leaning bearish in the short term, with potential for some bullish recovery if stablecoin liquidity leads to increased buying pressure. Traders should stay alert for market developments while managing their risk exposure.

Related News

NullTXneutral
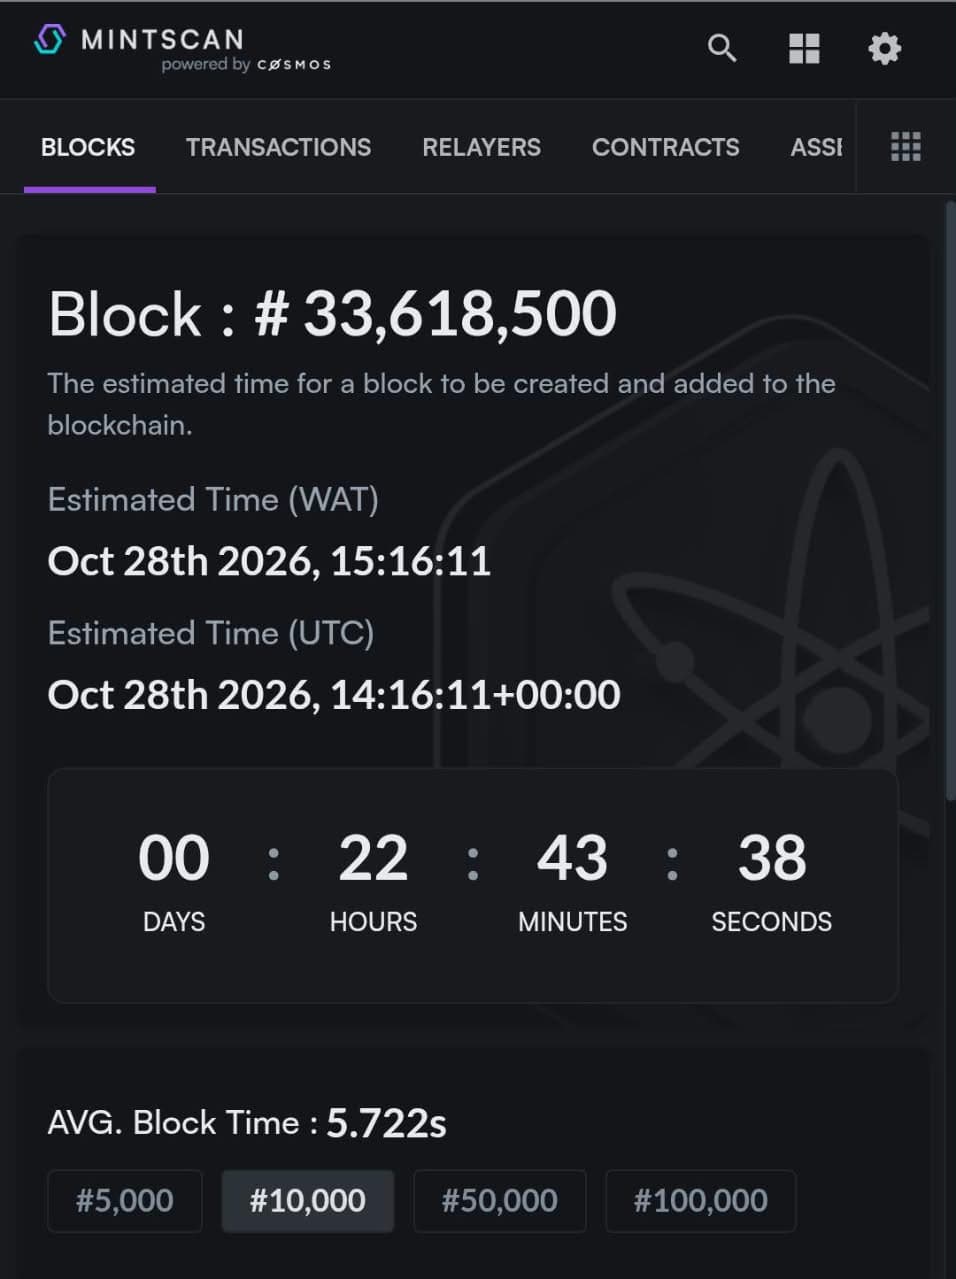
Cosmos Hub Approves Gaia v29 With 99.41% Support Ahead of October 28th Upgrade

Cosmos Hub Approves Gaia v29 With 99.41% Support Ahead of October 28th Upgrade

Proposal #1059 passed with 49.59% turnout as the chain counts down now to block 33,618,500 on October 28th, where validators are told to run the security-patched v29.0.1 binary, not the version named in the proposal.The Cosmos Hub's latest upgrade drew almost no opposition. About 168.5 million ATOM voted on Proposal #1059, and only 2,335 ATOM voted No. Under that one-sided result is an unusual change: the Hub's stakers voted to remove the governance route that earlier gene...

Open source
CryptoBriefingbullish
AI agents can now buy domains on Atom using x402 payments via Coinbase

AI agents can now buy domains on Atom using x402 payments via Coinbase

AI-driven domain purchases via stablecoins could revolutionize digital commerce, enabling seamless, automated transactions globally. The post AI agents can now buy domains on Atom using x402 payments via Coinbase appeared first on Crypto Briefing.

Open source
Crypto-Economyneutral
Binance Adds 227 Futures Pairs in 2026 as TradFi Dominates New Listings

Binance Adds 227 Futures Pairs in 2026 as TradFi Dominates New Listings

TL;DR Binance has listed 227 new futures pairs in 2026, putting it eight short of the 235 additions recorded across all of 2025. About 70% of this year’s new futures listings track stocks, ETFs, commodities or foreign exchange, showing a pronounced shift toward traditional-market exposure across the platform. Recent additions include perpetuals linked to EIDO, EQT, STM and ABBV, while Binance continues removing selected spot pairs through separate periodic market reviews....

Open source
Blockchain.Newsbearish
ATOM Price Prediction: Below Every Key Moving Average as Stochastic Flashes Oversold

ATOM Price Prediction: Below Every Key Moving Average as Stochastic Flashes Oversold

Open source

Tradable Markets

Browse every supported spot and perpetual market by exchange, then launch analysis immediately.

Period
Timeframe
Side

Model Rankings for ATOM

Review how ATOM performs across models under the current filter.

Leading Models

The best-performing three models under the current filter state.

Why use this Cosmos Hub page

See how AI models perform on Cosmos Hub, compare live markets by exchange, and choose the exact pair you want to open.

Use this page when you want to move from asset-level ranking into a specific live market.

Related Assets

Continue into other closely watched asset pages.

Related research

More in Crypto cycles

FAQ

Where do the ATOM pairs come from?

They are the live ATOM markets currently available across supported exchanges. Use them to compare spot and perpetual choices, then open the market you actually want to analyze.

What happens after I press start analysis?

You will open Live with the selected market already filled in, and analysis will begin automatically. That lets you move straight from this page into the market you want to review.

Is the best ATOM model always the best pair to trade?

Not always. A strong model on ATOM does not mean every exchange and contract type behaves the same way, so this page shows both the overall model ranking and the specific markets you can open.