
Bitcoin's First Year After the Top: The 2025 Cycle Against History
On October 6, 2025, Bitcoin closed at $124,680, the highest daily close in its history (the intraday record printed between $126,080 and $126,110, depending on the venue). Exactly 365 days later, on October 6, 2026, it closed at $85,615. That is 31.3% below the peak.
A 31% loss after a year sounds painful, and for anyone who bought the top it is. But measured against Bitcoin's own history, it is the mildest first year after a cycle peak ever recorded. At the same point in the three previous cycles, Bitcoin was down 67%, 83% and 73%. No earlier cycle reached its first anniversary anywhere near the current level.
This is a reference guide to Bitcoin one year after its peak. It sets the 2025–26 cycle against every previous cycle top, day by day, using one consistent dataset. It covers how deep each first year went, when each low arrived, how big the relief rallies were, and the pattern that matters most right now: in every past cycle, the final bottom came roughly a year after the top.
The comparison is not academic. On October 7, 2026, the day after the anniversary, Bitcoin slipped below $84,000. Brent crude broke above $101 after renewed attacks on tankers in the Strait of Hormuz, and CoinDesk reported roughly $547 million of liquidations. Whether this cycle has already bottomed is the question every Bitcoin holder is asking, and the history below is the best evidence available.
Key numbers at a glance
| Metric | 2025–26 cycle | Range of the three prior cycles |
|---|---|---|
| Peak daily close | $124,680 (Oct 6, 2025) | $1,138.50 / $19,210 / $67,526 |
| Close on day 365 | $85,615 (−31.3%) | −67.4% to −82.8% |
| Deepest close inside year one | $58,633 (−53.0%) | −71.9% to −82.9% |
| Day the year-one low arrived | Day 267 (Jun 30, 2026) | Day 305 to day 363 |
| Days closing more than 50% below peak | 15 | 184 to 294 |
| Distance above the year-one low on day 365 | +46.0% | +0.5% to +16.0% |
| Biggest relief rally inside year one | +47.7% | +35.1% to +85.1% |
Each number is worked out from the same daily series. The method comes first, then the full table.
How we measured it (methodology)
A reference table is only as good as its rules, so here are ours:
- Data source. BTC/USD daily candles from Bitfinex (UTC days), the longest continuous free exchange series, running back to March 2013. We cross-checked the latest prints against OKX and CoinGecko, and they agree within normal exchange spreads.
- Peak = highest daily close, not the intraday wick. Intraday highs differ by venue and can be distorted by a single thin order book; closes are reproducible. Where the intraday high matters for a headline, we note it separately.
- Day 0 is the peak close. Day 365 is the same calendar date one year later.
- "Year-one low" is the lowest daily close from day 1 to day 365. "Cycle bottom" is the lowest close within two years of the peak.
- Four cycles. The 2013, 2017, 2021 and 2025 tops. The 2011 cycle is excluded because no comparable daily exchange series exists for it; the April 2013 blow-off is excluded because it was a mid-cycle spike rather than a cycle top. Both are covered in our reference on every Bitcoin crash over 50%.
- Price only. No fees, no funding and no staking, which Bitcoin does not have anyway. Percentages are rounded to one decimal place.
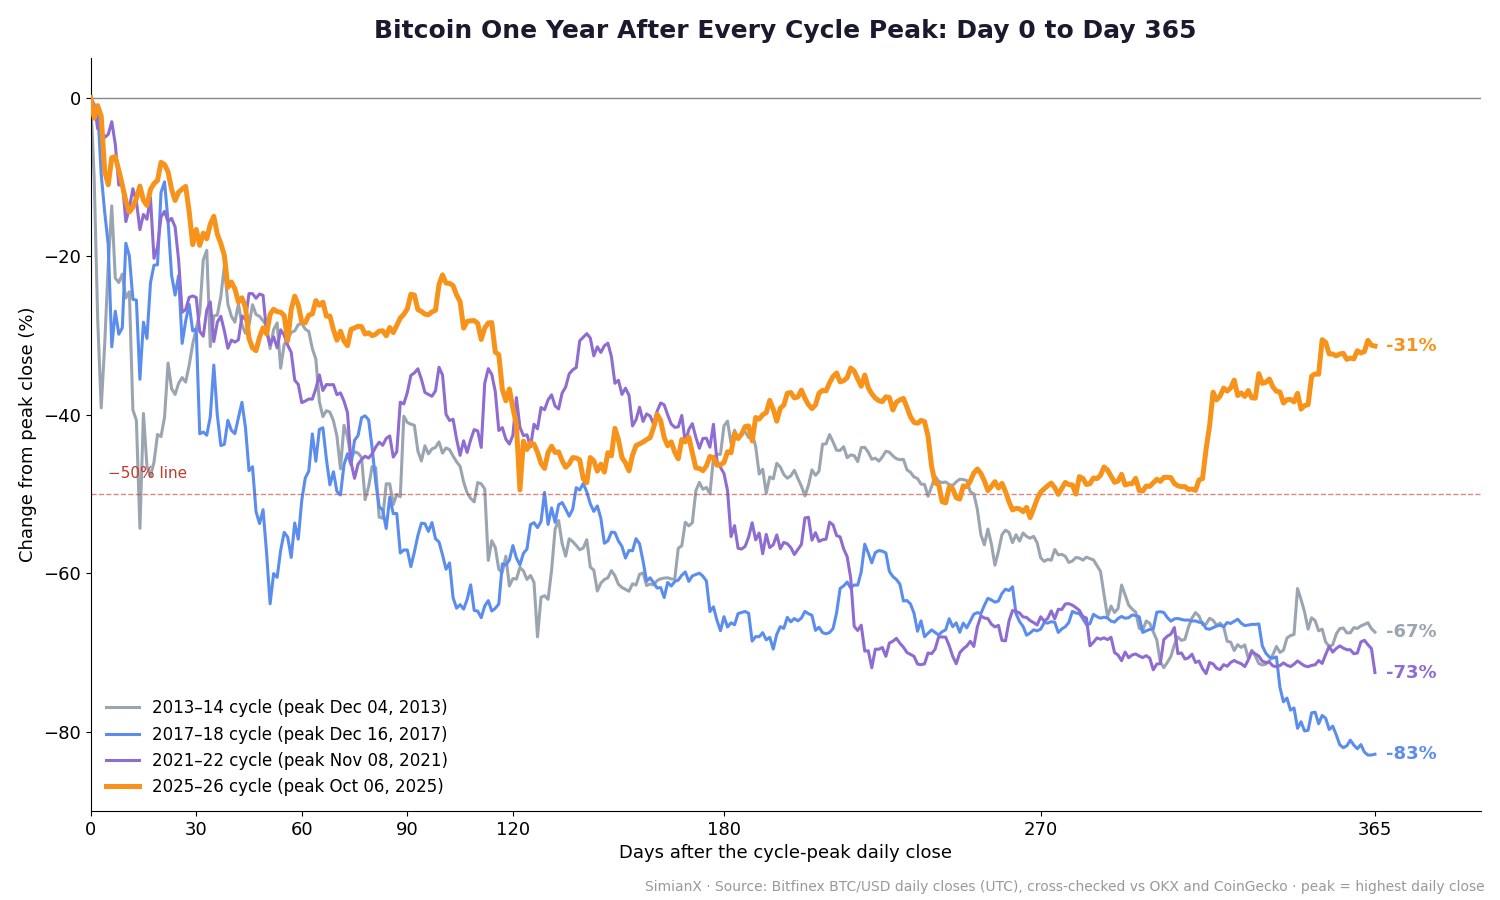
The reference table: Bitcoin one year after every cycle peak
This is the core of the guide: each cycle's path, checkpoint by checkpoint, as a percentage below its own peak close.
| Cycle | Peak close (date) | Day 30 | Day 90 | Day 180 | Day 270 | Day 365 | Year-one low close (day) |
|---|---|---|---|---|---|---|---|
| 2013–14 | $1,138.50 (Dec 4, 2013) | −29.1% | −41.0% | −41.4% | −58.0% | −67.4% | $319.90, −71.9% (day 305) |
| 2017–18 | $19,210 (Dec 16, 2017) | −29.2% | −57.1% | −65.5% | −67.0% | −82.8% | $3,281.70, −82.9% (day 363) |
| 2021–22 | $67,526 (Nov 8, 2021) | −25.2% | −37.2% | −47.4% | −65.5% | −72.5% | $18,473, −72.6% (day 317) |
| 2025–26 | $124,680 (Oct 6, 2025) | −16.6% | −26.6% | −46.0% | −49.8% | −31.3% | $58,633, −53.0% (day 267) |
Three things stand out.
The first month was the gentlest on record. Every earlier cycle lost 25–29% in its first 30 days. The 2025 cycle lost 16.6%, even though it included the largest liquidation event in crypto history (more on that below).
By day 180 the current cycle had caught up. At the six-month mark it was down 46.0%, worse than the 2013 cycle (−41.4%) and close to the 2021 cycle (−47.4%). For most of 2026, this looked like a normal bear market running on schedule.
The last 100 days broke the pattern. Every prior cycle accelerated lower between day 270 and day 365. The 2017 and 2021 cycles were sitting within 1% of their lows on the anniversary. The 2025 cycle went the other way, rising from −49.8% on day 270 to −31.3% on day 365. That rally is the main reason this year looks different from any before it.
The day-365 scorecard
The same four cycles, measured on their first anniversary:
| Cycle | Close on day 365 | % from peak | % above year-one low | Biggest rally inside year one | Days >50% below peak | Cycle bottom (day) |
|---|---|---|---|---|---|---|
| 2013–14 | $370.99 | −67.4% | +16.0% | +85.1% (Apr–Jun 2014) | 184 | $182, −84.0% (day 406) |
| 2017–18 | $3,301.50 | −82.8% | +0.6% | +65.5% (Feb–Mar 2018) | 294 | $3,281.70, −82.9% (day 363) |
| 2021–22 | $18,559 | −72.5% | +0.5% | +35.1% (Jan–Mar 2022) | 184 | $15,765, −76.7% (day 378) |
| 2025–26 | $85,615 | −31.3% | +46.0% | +47.7% (Jun–Sep 2026) | 15 | Not confirmed |
The "biggest rally" column is a useful warning. Big bounces are normal in Bitcoin bear markets, and they are not proof of a bottom. The 2014 cycle produced an 85% rally in the middle of its bear market and still went on to lose another 70% from that rally's high. So the 2026 rally from $58,633 to $86,607 does not settle anything by itself.
What is new is where that rally happened. In every previous cycle, the big relief rally came in the first half of year one and faded long before the anniversary. This time it came in the final quarter and carried the price into day 365. That has not happened before.
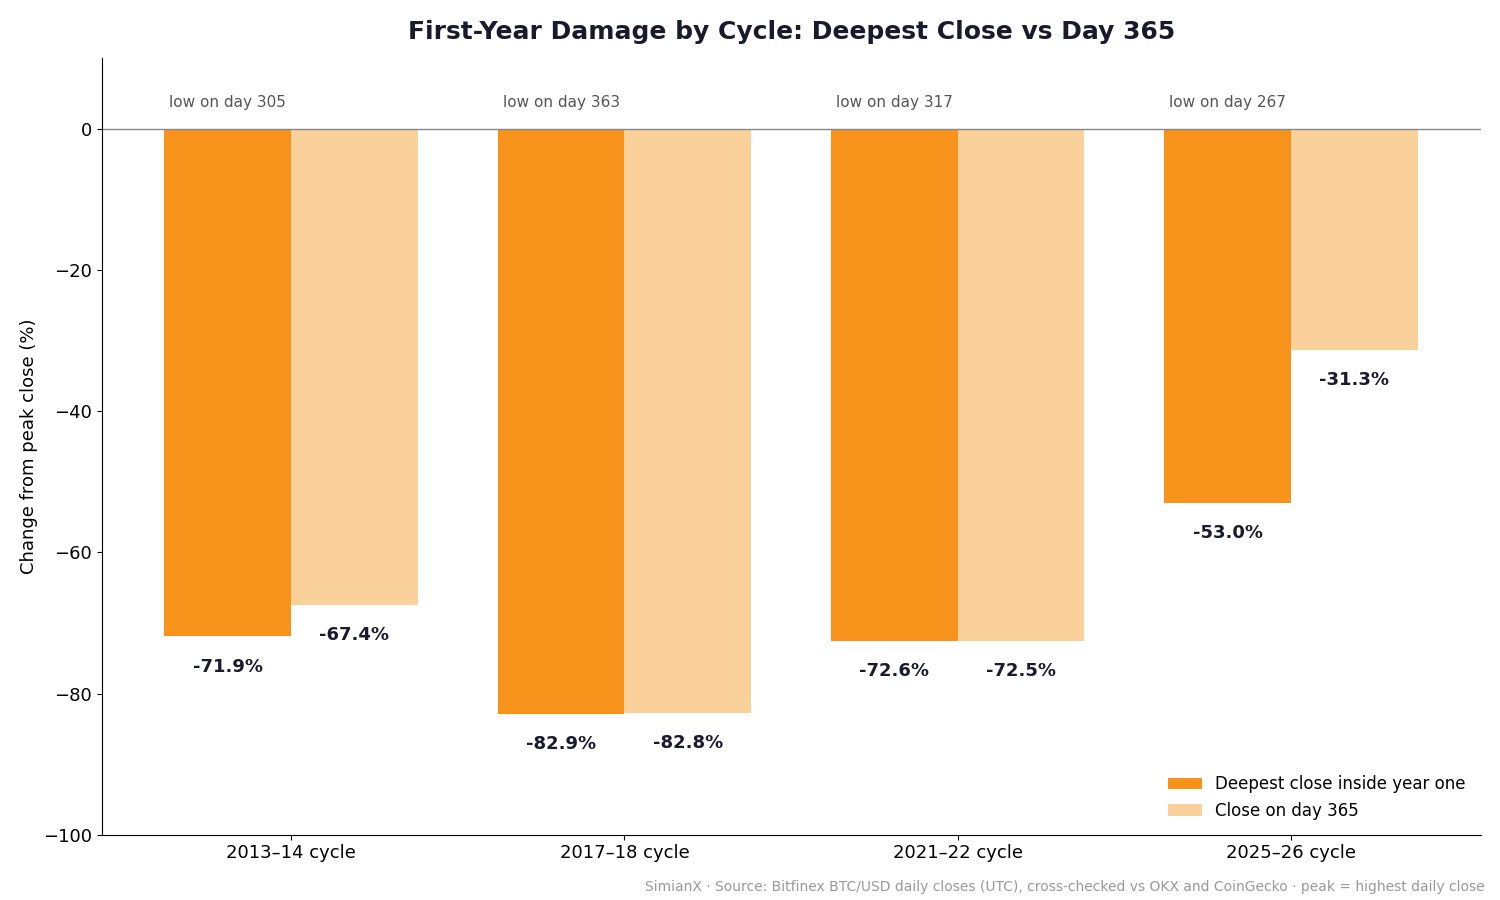
Cycle by cycle: how each first year unfolded
2013–14: the Mt. Gox year
Bitcoin's first mainstream bubble peaked at a $1,138.50 close on December 4, 2013. The collapse of Mt. Gox, then the dominant exchange, which halted withdrawals in February 2014 and filed for bankruptcy that month, turned a correction into a long, grinding decline. By day 120 the price was down 60%. A spring rally of 85% gave false hope, and by the anniversary Bitcoin sat at $370.99. The final low came on day 406, a $182 close in January 2015, down 84% from the top. (Bitfinex shows an intraday print of $200 in February 2014; that thin-book wick is one reason this guide uses closes.)
2017–18: the ICO hangover
The initial coin offering mania peaked at a $19,210 close on December 16, 2017. This was the most orderly decline of the four: down 57% by day 90, down 65% by day 180, then months of flat trading around $6,300–$6,500. The last leg came in November 2018, when a split in the Bitcoin Cash network shook confidence in the wider market. Bitcoin's year-one low and its final cycle bottom were the same close: $3,281.70 on December 14, 2018, day 363. The bottom arrived almost exactly on the anniversary.
2021–22: the contagion year
The 2021 top ($67,526 close, November 8, 2021) came as the Fed turned toward rate hikes. Then crypto's own credit system failed: the Terra/LUNA collapse) in May 2022, the Celsius and Three Arrows Capital failures in June, and finally FTX in November. The FTX run began in the first week of November 2022, right on the one-year mark. Bitcoin closed day 365 at $18,559, fell 14% the next day, and bottomed at $15,765 on day 378.
2025–26: the leverage-and-rates year
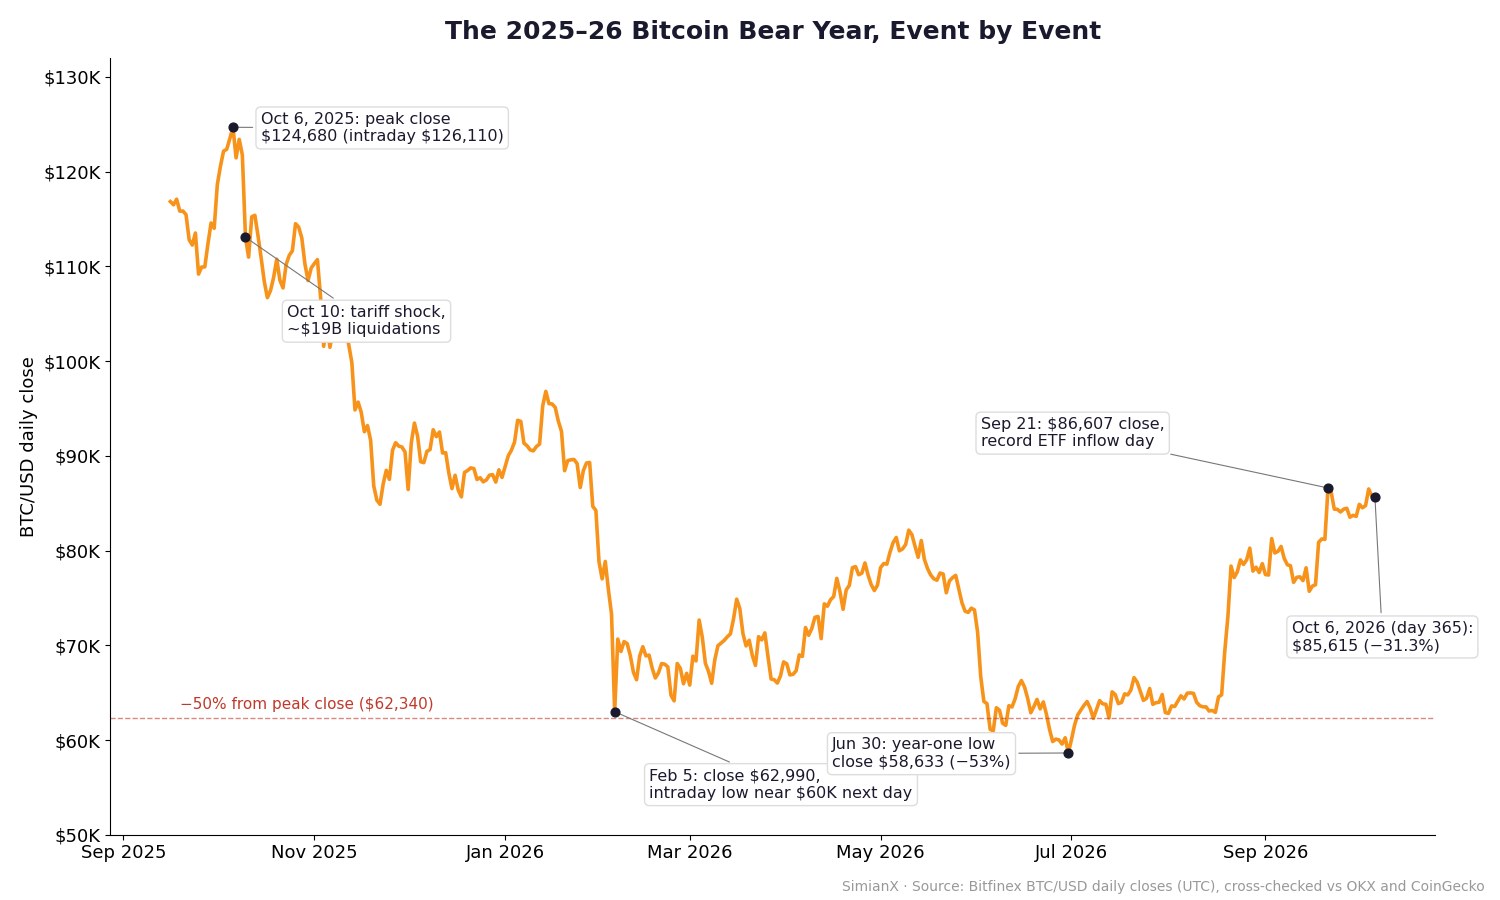
The current cycle began with a shock. On October 10, 2025, four days after the peak, President Trump announced a 100% tariff on Chinese imports and the crypto market suffered more than $19 billion of liquidations in 24 hours, the largest deleveraging event on record. Bitcoin fell from about $122,000 to an intraday low near $103,000, yet it closed the day at $113,080. The damage was mostly in leverage, not in the spot price.
The real decline came later and more slowly:
- November 2025: a steady slide to an $85,314 close on November 21.
- January 2026: a relief rally to a $96,805 close, which failed by the end of the month.
- February 5–6, 2026: a crash to a $62,990 close and an intraday low just above $60,000, followed by a 12.2% one-day rebound. We covered it at the time in Bitcoin Crash Feb 2026: $60K Bottom or More Pain Ahead?.
- May–June 2026: Strategy, the largest corporate holder, disclosed its first Bitcoin sale since 2022: 32 BTC at an average of $77,135, sold to fund preferred-stock dividends. In late June it announced a program allowing further Bitcoin sales. A strong US jobs report on June 5 pushed back hopes of rate cuts, spot ETF redemptions picked up, and Bloomberg reported Bitcoin breaking $60,000 again as the market's biggest buyers wavered.
- June 30, 2026 (day 267): the year-one low, a $58,633 close, 53.0% below the peak.
- July–September 2026: a rally of 47.7%, led by spot buying rather than leverage. US spot Bitcoin ETFs took in about $3.5 billion in August and $2.6 billion in September, according to 21Shares. September 21 brought the largest single-day inflow of 2026, and Bitcoin closed at $86,607 that day, an eight-month high. We tracked the early stages in Bitcoin Back Above $66K and Bitcoin's 7% Surge Toward $70K.
The rally is more striking given the macro backdrop. The Federal Reserve raised rates in September for the first time since 2023 (our coverage), long-dated Treasury yields hit multi-decade highs (global bond selloff), and oil crossed $100 a barrel. Bitcoin finished the third quarter up about 43%, its first winning quarter after three straight losing ones.
The named pattern: the one-year floor
Put the three completed cycles side by side and the timing is remarkably consistent:
| Cycle | Peak close | Cycle-bottom close | Days from peak to bottom | Drawdown at bottom |
|---|---|---|---|---|
| 2013–15 | Dec 4, 2013 | Jan 14, 2015 | 406 | −84.0% |
| 2017–18 | Dec 16, 2017 | Dec 14, 2018 | 363 | −82.9% |
| 2021–22 | Nov 8, 2021 | Nov 21, 2022 | 378 | −76.7% |
| 2025–26 | Oct 6, 2025 | Jun 30, 2026? | 267? | −53.0%? |
We call this the one-year floor: in each completed Bitcoin cycle, the bear market's final low came between 363 and 406 days after the peak close, on average about 382 days. Applied to the 2025 peak, that window runs from October 4 to November 16, 2026.
That window opens now. There are two ways to read the current cycle.
Reading 1: the bottom came early. The June 30 low arrived 96 days ahead of the earliest previous bottom, and it was much shallower. Cycle bottoms have been getting shallower: −84%, then −83%, then −77%. A −53% bottom would continue that trend. Bitcoin is now a roughly $1.7 trillion asset held through ETFs and corporate treasuries, so it is reasonable to expect smaller swings than when it was a $10 billion retail market. On this reading, the strength of the July–September rally shows the bear market has already ended.
Reading 2: the timing still applies. The one-year floor has held three times out of three, and the forces behind it have historically been forced sellers. In 2014 it was Mt. Gox, in 2018 the Bitcoin Cash split, in 2022 FTX. On this reading, the current window is when the last forced sellers appear, and the October 7 sell-off, driven by oil, higher yields and leveraged longs, is a warning. In 2014 and 2022, prices were also rising shortly before the final drop.
The data cannot decide between these readings yet. It can tell you what each one would need: a close back below the $58,633 June low before mid-November would support Reading 2, and holding above the September range through the window would support Reading 1.
What the past depths would mean today
This is arithmetic, not a forecast. Applying each past cycle's full depth to the $124,680 peak gives:
| If the 2025 cycle matched… | Bottom close implied | Versus the June 2026 low |
|---|---|---|
| 2013–15 depth (−84.0%) | ~$19,950 | 66% lower |
| 2017–18 depth (−82.9%) | ~$21,320 | 64% lower |
| 2021–22 depth (−76.7%) | ~$29,050 | 50% lower |
| June 2026 low holds (−53.0%) | $58,633 | — |
These numbers look extreme, and that is the point. Each Bitcoin cycle has been less severe than the one before, so applying old drawdowns mechanically gives answers that are probably far too low. It is more useful to treat the June low as the level that decides between the two readings above.
One more marker: the June 2026 low closed 13.2% below the 2021 peak close of $67,526. In 2022, the bottom closed 17.9% below the 2017 peak. Falling briefly below the previous cycle's high and then recovering is something these two cycles share.
How long until a new all-time high?
Measured on daily closes, the earlier cycles took 1,127, 1,080 and 847 days to close above their old peak. Applied to October 6, 2025, those paces point to a new record between January 2028 and November 2028. Getting from the day-365 close back to $124,680 needs a 45.6% gain. To beat the $126,110 intraday high, it needs 47.3%.
Those dates are on the slow end of history. Bitcoin's recovery times have been getting shorter, and the 2025 cycle has fallen far less, so a faster recovery is possible. Our halving-cycle reference explains why the April 2028 halving sits right inside that window, and our quarterly-returns table shows how unevenly Bitcoin's gains have historically arrived.
Levels to watch through the one-year-floor window
| Level | What it is | Why it matters |
|---|---|---|
| ~$126,100 | Intraday all-time high | The headline record |
| $124,680 | Peak daily close | The cycle's reference point |
| ~$87,400 | September 21 intraday high | Upper edge of the current range |
| ~$80,000 | 50-day moving average | Short-term trend support |
| ~$77,800 | 50-week moving average | Long-term trend line, briefly lost in mid-September |
| ~$71,700 | 200-day moving average | Where the summer breakout began |
| $58,633 | June 30 year-one low close | The level that separates the two readings |
Moving averages are calculated from Bitfinex daily closes as of October 6, 2026.
How to track the cycle in real time with SimianX
A day-by-day pattern needs a day-by-day dashboard. The Bitcoin asset page brings live price and AI-model views together in one place. The Live Command Room streams multi-timeframe analysis for BTC and Ethereum as candles close. Market Pulse flags sudden moves like the October 7 oil-driven sell-off as they happen, and explains them in plain language (how Market Pulse works).
If you would rather have rules than watch screens, AI autopilots can run a disciplined BTC strategy around the clock, with stop-losses fixed in advance. That matters most in exactly the kind of window where previous cycles made their final low (how autopilots trade crypto). For related context, see how Bitcoin behaved after every Fed rate cut, what Bitcoin dominance cycles say about altcoin timing, and the ETH/BTC ratio history.
Frequently asked questions
How much is Bitcoin down one year after its peak?
Bitcoin closed at $85,615 on October 6, 2026, exactly one year after its $124,680 record close. That is 31.3% lower. In the three previous cycles Bitcoin was down 67.4%, 82.8% and 72.5% on the same anniversary.
What was Bitcoin's all-time high?
The highest daily close was $124,680 on October 6, 2025 (Bitfinex). The intraday record printed on the same day, at about $126,080 to $126,110 depending on the exchange.
What was the lowest price of the 2025–26 bear market so far?
The lowest daily close was $58,633 on June 30, 2026, 267 days after the peak and 53.0% below it. The intraday low was about $57,800 the next day.
Is the Bitcoin bear market over?
It has not been confirmed. In the three completed cycles, the final bottom came 363 to 406 days after the peak, a window that runs from October 4 to November 16, 2026, for this cycle. A shallower, earlier bottom fits the long-term trend of smaller drawdowns, but only a hold above the June low through that window would make the case.
How long does Bitcoin take to make a new high after a cycle peak?
On a daily-close basis, 1,127 days after the 2013 peak, 1,080 days after the 2017 peak and 847 days after the 2021 peak. Applied to the 2025 peak, those paces point to January to November 2028.
Why did Bitcoin fall on October 7, 2026?
Brent crude rose above $101 after attacks on tankers in the Strait of Hormuz, lifting Treasury yields and the US dollar. Leveraged long positions were liquidated: CoinDesk counted about $547 million of liquidations in 24 hours as Bitcoin slipped below $84,000.
How was this data calculated?
All figures use Bitfinex BTC/USD daily closes (UTC), cross-checked against OKX and CoinGecko. Peaks are the highest daily close, day 0 is the peak, and percentages are price-only. The full method is in the methodology section above.
The bottom line
One year after its peak, Bitcoin has had its gentlest first bear year on record: −31.3% on the anniversary, compared with −67% to −83% in every previous cycle. Its low came earlier and was shallower than any before, and it is the only cycle to reach day 365 well above its year-one low. History also says the final low has arrived 363 to 406 days after the top, and that window is open now. The June 30 close of $58,633 is the level that will decide whether 2025–26 is the first cycle to break that pattern.
Related Reading
- Every Bitcoin Crash Over 50%: Recovery Times Since 2011
- Bitcoin Halving Cycles: Complete Returns Reference 2012–2028
- Bitcoin Quarterly Returns: Full History Table 2013–2026
- How Long Every Bear Market Took to Recover, 1929–2022
- Coinbase Stock 2026: The Crypto Comeback Wall Street May Miss
References
- Bitfinex public API, BTC/USD daily candles, March 2013 to October 2026 (API documentation).
- CoinDesk, "Bitcoin slips below $84,000 as oil rally hits crypto" (October 7, 2026).
- CoinGecko, "The October 10 Crypto Crash Explained" (coingecko.com).
- Bitcoin Magazine, "Strategy (MSTR) Sells 32 Bitcoin, First BTC Sale Since 2022" (bitcoinmagazine.com).
- Bloomberg, "Bitcoin Breaks $60,000 Again as Crypto's Biggest Buyers Wobble" (June 24, 2026).
- 21Shares, "Bitcoin defies a historically weak September" (October 2026 outlook).
- Yahoo Finance, "Bitcoin Peaked at $126,080 on October 6 Last Year" (finance.yahoo.com).
- Wikipedia, Mt. Gox, Terra (blockchain)) and Bankruptcy of FTX.