
 By Marcus Reeve
Market Pulse: See the Entire Market Move in Real Time
Markets never sleep, and they never move one asset at a time. On any given minute, Bitcoin is grinding lower while a small-cap biotech is spiking, an index heavyweight is quietly breaking a 52-week low, and a volume surge is building under a coin nobody is watching yet. No human can stare at thousands of tickers at once. That is exactly the problem **Market Pulse** was built to solve.
Market Pulse is SimianX's real-time, all-market command room: a single screen where the entire crypto and US stock market is laid out as a living heatmap, with a continuous feed of the exact moments that matter — flash moves, volume surges, fresh 52-week highs and lows, and market-moving news — streaming in as they happen. It is free to open at simianx.ai/pulse, and it turns "what's happening in the market right now?" from a research project into a single glance.
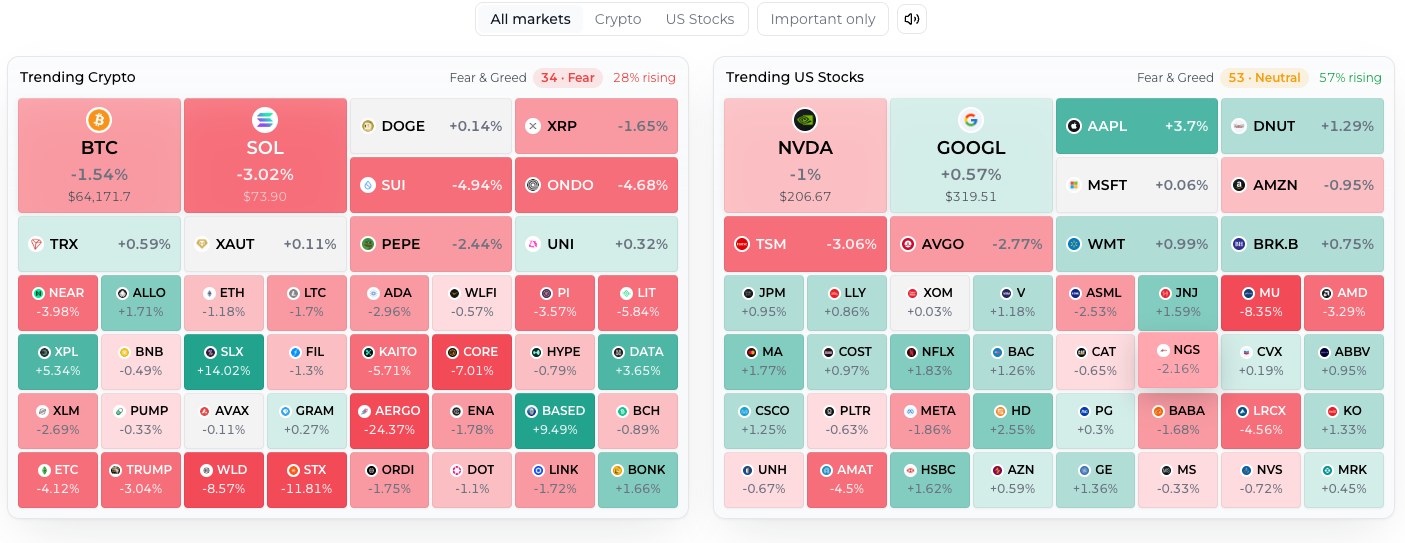
The heatmap: the whole market at a glance
The centerpiece is a color-coded mosaic split into two panels — Trending Crypto and Trending US Stocks — updated live, tick by tick. Every tile is one asset. Green means up on the day, red means down, and the shade tells you how far: a deep, saturated red tile is a hard mover, a pale tile is barely breathing. The largest tiles are the market's heavyweights (Bitcoin, Ethereum, NVIDIA, Apple), and smaller names with fresh activity get pulled onto the board the moment they start moving, so you never miss an emerging story.
Two numbers sit above each panel and do a lot of quiet work. The first is a live Fear & Greed reading — not a stale once-a-day index, but a real-time sentiment score computed from market breadth, the average move, and the surge-versus-crash skew of the last hour. The second is the share of assets rising. Together they answer the question every trader opens a screen to ask: is today risk-on or risk-off? — before you have read a single headline.
You can narrow the view with one tap: All markets, Crypto, or US Stocks, plus an Important only toggle that strips the board down to the moves that actually matter. Hover any tile and a card shows the live price, the day change, and the last five-minute change; click it and you go straight into a live, multi-agent AI analysis of that exact asset — more on that below.
Why a heatmap beats a watchlist
A watchlist forces you to decide in advance what to watch, and then it hides the one name you didn't add. A heatmap has the opposite bias: it shows you everything and lets your eye do the filtering. Color is the fastest signal the human visual system can process, so a wall of tiles that shades from calm gray to hot red is something you read in a second, not something you scan row by row. Size encodes weight, so the assets that can actually move the market draw the eye first. The result is ambient awareness — leave it open on a second monitor and you notice a sector heating up before you have consciously gone looking for it. That shift, from hunting to noticing, is the entire design goal.
The live event feed: never miss the move
Under the heatmap runs the second half of Market Pulse: a live event feed. This is not a ticker of opinions — it is a stream of detected, quantified market events, each one a thing that just happened, timestamped to the second.
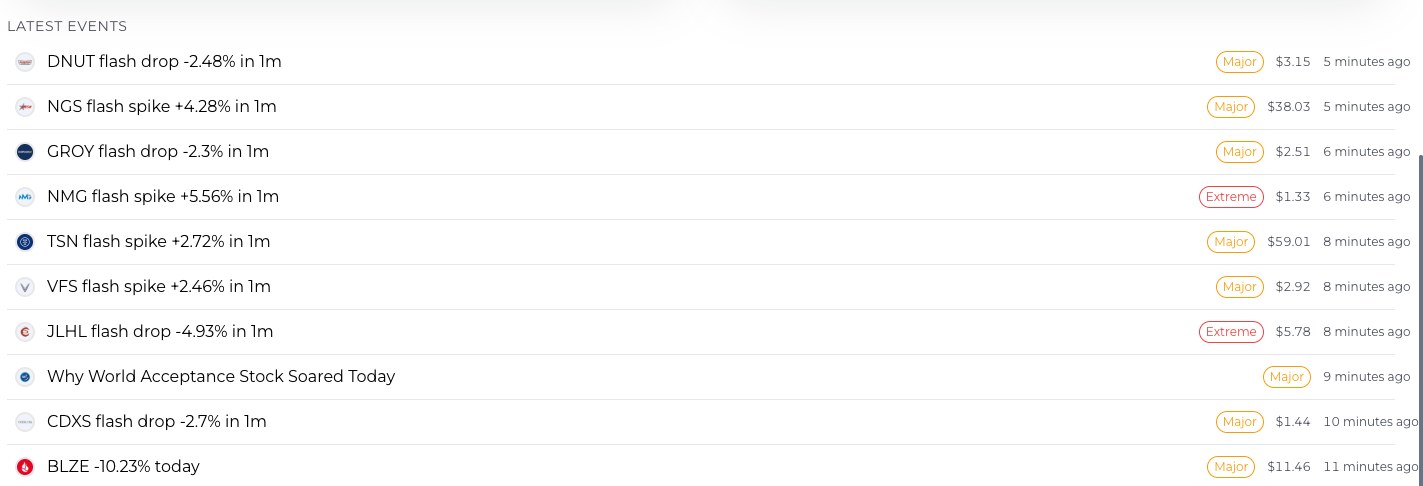
Open it during a busy session and you will see a rolling list like the one above: a stock flashing a -2.48% drop in one minute, a coin spiking +5.56% and flagged Extreme, a name quietly logging -10.23% on the day, a fresh 52-week low, a volume surge running many times its normal tape, and the occasional AI-summarized news headline that actually moves a name. Each row carries a severity badge — Major or Extreme — its live price, and how long ago it fired, so your eye goes to the biggest events first.
The events Market Pulse surfaces include:
- Flash moves — sudden 1-minute, 5-minute, and 15-minute spikes and crashes, each sized against that asset's own recent volatility so a normal wiggle never cries wolf and a genuine break always does.
- 52-week highs and lows — the moment a stock prints a new yearly extreme, the single most-watched technical event in equities and a classic trigger for momentum and breakout traders.
- Volume surges — when the tape runs many multiples of its recent average, the earliest tell that something is happening, often before the price has finished moving.
- Day moves and gaps — the biggest gainers and losers on the session, and the overnight gaps that set the tone at the open.
- Indicator events — RSI overbought and oversold readings and MACD crosses on the majors, for traders who live on the technicals.
- Market-moving news — high-value headlines, AI-scored for impact and summarized, attached to the exact ticker they affect rather than floating in a generic feed.
Because every event is measured, not editorialized, the feed is dense signal and almost no noise. It is the difference between "I think something is going on with small caps today" and "seven names just flashed Extreme in the last ten minutes." The Important only filter takes it one step further, hiding everything below Major so that on a chaotic day you still see only the handful of moves worth a human's attention.
Real-time Fear & Greed, not yesterday's
Most sentiment gauges publish one number a day. By the time you read it, the mood that produced it is hours old. Market Pulse recomputes its Fear & Greed score continuously, blending three live inputs: how many assets are advancing versus declining, the average size of today's moves, and the balance of surges against crashes over the trailing hour. When a wave of Extreme flash-crashes hits the feed, the score tilts toward fear in real time; when green tiles and upside breakouts dominate, it tilts toward greed. It is a mood ring for the market that actually keeps up with the market — and because crypto and stocks each carry their own reading, you can see the two asset classes diverge, which is often the most interesting signal of all.
From signal to analysis in one click
Spotting a move is only step one. The reason Market Pulse lives inside SimianX and not in a standalone charting app is that every asset on the board is one click away from a full, live AI investigation.
Click any tile — or any event in the feed — and SimianX opens a **live analysis session** for that asset: a team of specialized AI agents (an indicator agent, a fundamental agent, an intelligence agent, and a decision agent) that read the chart, the on-chain or fundamental picture, and the latest news, then argue their way to an actual directional call in real time. The heatmap tells you what is moving; the live room tells you whether it's worth acting on and why. That handoff — from a market-wide radar to a deep, per-asset second opinion — is the whole point of building the two together.
If you would rather compare how different models see the same setup, the **AI model leaderboard** tracks how dozens of AI models across six providers actually perform on live trading calls, so you are never trusting a single black box. Every coin on Market Pulse links to its own asset page — for example Solana or XRP — and every stock ticker opens its own research page, from Amazon to Tesla and thousands more.
One board for two markets
Most tools force a choice: a crypto app or a stock app. Traders don't live that way anymore. A macro headline moves Bitcoin and the Nasdaq in the same breath; capital rotates between risk assets across asset classes all day. Market Pulse was built to watch both at once, side by side, on the same clock — so you can see risk appetite rotating through crypto while it drains out of equities, or a single event rippling across both.
Crypto coverage spans the liquid universe of major coins, priced live; US stock coverage spans thousands of listed names above a meaningful market-cap floor, so the board stays relevant and never fills with dead tickers. Both sides carry their own real-time Fear & Greed and their own event stream, and the combined view lets you compare the two markets at a glance instead of alt-tabbing between apps that were never designed to talk to each other. In a market where a single macro headline can move Bitcoin, the Nasdaq, and gold in the same instant, watching both asset classes on one clock is not a luxury — it is the only honest way to see the full picture.
Who Market Pulse is for
- Active traders get a market-wide radar that flags flash moves and volume surges the moment they fire — the setups that are already gone by the time they reach a news site.
- Swing and position traders get a clean read on breadth and sentiment, plus fresh 52-week highs and lows to build or trim positions around.
- Crypto-native users get the whole liquid coin market on one heatmap, with one-click AI analysis on anything that moves.
- Anyone who just wants a pulse check gets a single, honest answer to "what is the market doing right now?" — no subscription and no login required just to look.
How to use Market Pulse
- Open simianx.ai/pulse. The board loads live; no account is needed to watch it.
- Read the top line. Fear & Greed plus percent-rising on each panel tells you the regime in two seconds.
- Scan for color. Deep red and deep green tiles are today's real movers; the size of a tile tells you how much weight sits behind the move.
- Watch the feed. Flip on Important only to cut to Major and Extreme events, and let the rows tell you where the action is.
- Click through. Any tile or any event drops you into a live AI analysis of that asset — so you go from spotting the move to understanding it in one step.
Leave it open during market hours and it becomes part of your peripheral vision. You stop hunting for what is moving and simply start noticing it.
Frequently asked questions
Is Market Pulse free? Yes — the board is free to open and watch at /pulse. Deep, ongoing AI analysis and automation live in SimianX's plans.
Does it cover both crypto and stocks? Yes. One screen, two live panels — the liquid crypto market and thousands of US stocks, each with its own event feed and its own sentiment reading.
How fresh is the data? Real time. Prices update tick by tick and events are timestamped to the second as they fire.
What counts as an "event"? Measured, quantified market moves — flash spikes and crashes, 52-week highs and lows, volume surges, big day moves and gaps, key indicator crosses, and AI-scored market-moving news — never anonymous commentary.
What happens when I click a tile? SimianX opens a live, multi-agent AI analysis of that exact asset, so you go from noticing a move to understanding it without leaving your flow.
The bottom line
You cannot watch the whole market. Market Pulse can. It compresses thousands of crypto and stock tickers into one live heatmap, streams the exact moments that matter into a measured event feed, and puts a full AI investigation one click behind every tile. Open it at simianx.ai/pulse, leave it running, and let the market tell you where to look.
Want to go deeper? Compare AI models on live calls at the leaderboard, put a strategy on autopilot with SimianX Autopilots, or read more from the SimianX blog.