
The Long End Broke: Why Bond Yields Are Rising Everywhere in 2026
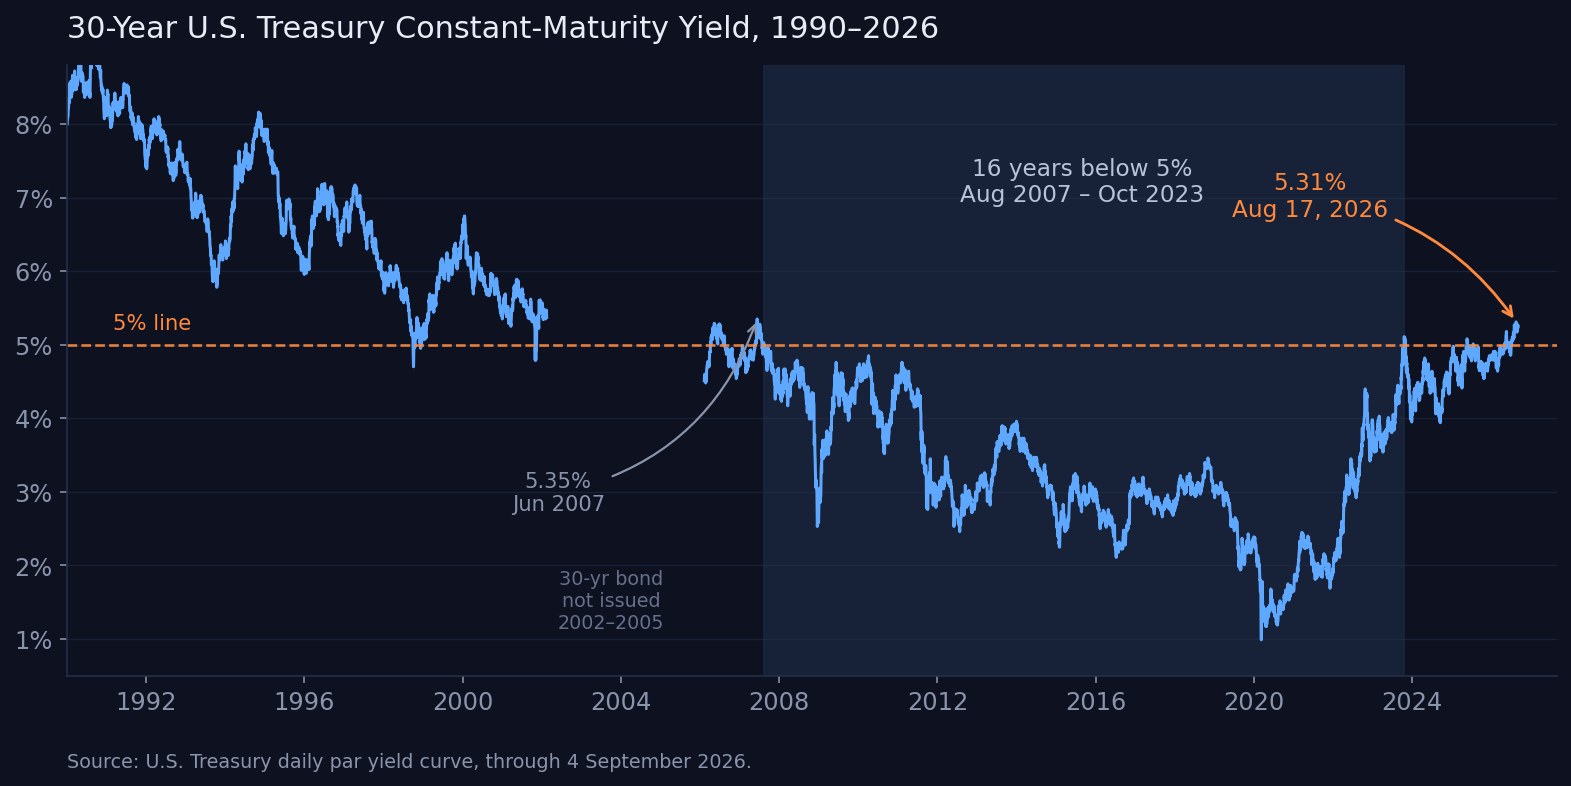
On August 17, 2026, the yield on the 30-year U.S. Treasury bond closed at 5.31%. The last time America's longest-dated debt paid that much was June 12, 2007 — before the global financial crisis, before quantitative easing, before an entire generation of investors learned that long bonds only ever go up in price.
That single number is the headline, but it is not the story. The story is that the same thing happened in London, Tokyo, Berlin and Paris in the same fortnight. Britain's 30-year gilt pushed toward 5.9%, a level last seen in the late 1990s. Japan's 30-year government bond set an all-time record high. Germany's 30-year Bund broke above 3.84%, its highest since 2011. France's 10-year yield reached levels last seen in November 2008.
This was not an American fiscal scare. It was a synchronized global repricing of the price of long-term money — what markets call the long end of the curve. This article explains what broke, why it broke, and what a 5%-plus long bond actually does to stocks, to crypto, and to the arithmetic of government debt.
The sixteen-year era that just ended
Between August 17, 2007 and October 18, 2023, the 30-year Treasury yield did not close above 5% a single time. That is 5,906 calendar days — just over sixteen years — in which the cost of locking up capital for three decades stayed below a threshold that, for most of modern financial history, was unremarkable.
Almost every asset-pricing habit formed in that window assumed a cheap long bond. Discounted-cash-flow models leaned on a low terminal rate. Growth stocks earned premium multiples because their distant earnings were discounted gently. Pension funds reached into private credit for yield they could not find in governments. Governments themselves, on both sides of the Atlantic, issued freely because the marginal cost of doing so was negligible.
That era ended quietly in October 2023, when the 30-year first poked above 5%. It ended decisively in 2026. Through September 4 of this year, the 30-year has closed at or above 5% on 60 separate trading sessions, starting on May 4 — no longer a spike, but a regime.
| U.S. Treasury curve | September 4, 2026 |
|---|---|
| 3-month bill | 3.91% |
| 2-year note | 4.37% |
| 10-year note | 4.78% |
| 20-year bond | 5.25% |
| 30-year bond | 5.24% |
| 2s30s spread | +87 bp |
| 10s30s spread | +46 bp |
Two details in that table matter more than the headline level.
First, the curve is positively sloped again — the 30-year pays 87 basis points more than the 2-year. For most of 2022 and 2023 it was inverted, the classic recession signal we catalogued in our reference table of yield-curve inversions and U.S. recessions. The re-steepening is not a return to health. It is the market demanding to be paid more for duration risk, which is a different thing entirely.
Second, the 20-year now yields fractionally more than the 30-year. That kink is a supply artifact: the 20-year sector is chronically less liquid and less loved, and when dealers are forced to absorb heavy issuance it is the first place that cheapens. It is a small technical tell that the selloff is being driven by supply, not just by inflation expectations.
This is a global event, not an American one
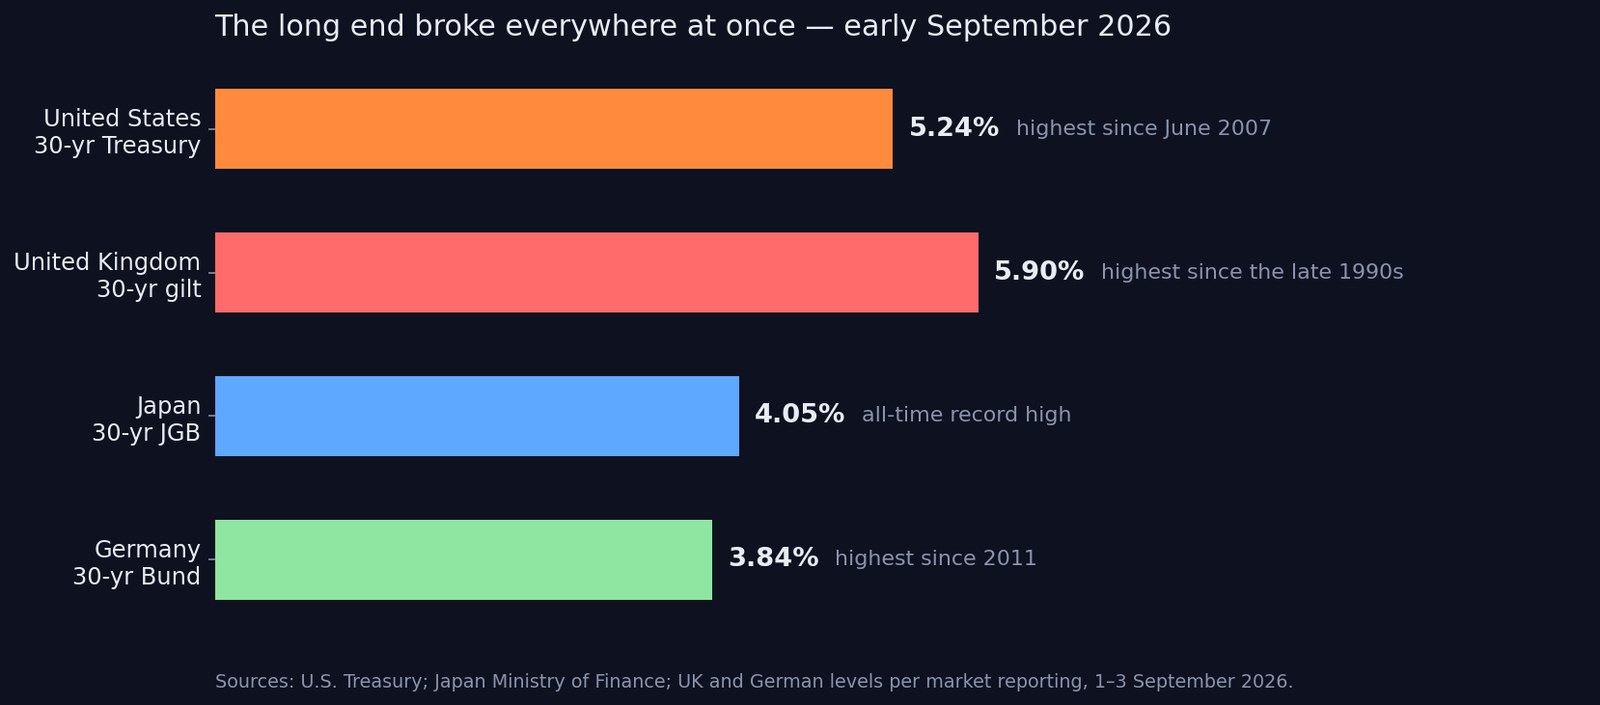
The synchronicity is the genuinely unusual feature. Sovereign bond markets normally diverge — a fiscal scare in one country sends money into another. In late August and early September 2026, there was nowhere to hide.
| Market | Level | Last seen |
|---|---|---|
| U.S. 30-year Treasury | 5.31% (Aug 17 peak) | June 2007 |
| U.K. 30-year gilt | ~5.90% | late 1990s |
| U.K. 10-year gilt | 5.23% | 2008 |
| Japan 30-year JGB | 4.096% (Aug 18) | all-time record |
| Japan 40-year JGB | 4.103% (Aug 18) | all-time record |
| Japan 10-year JGB | 2.97% | September 1996 |
| Germany 30-year Bund | 3.84% | 2011 |
| Germany 10-year Bund | 3.36% | 2011 |
| France 10-year OAT | 4.215% | November 2008 |
| Netherlands 10-year | 3.43% | May 2011 |
| Spain 10-year | 3.80% | November 2023 |
Japan deserves special attention, because it is the market that spent thirty years teaching the world that yields could stay pinned near zero forever. Per the Ministry of Finance's own daily series, the 10-year JGB last yielded what it yields today in September 1996. The 20-year last did so in August 1996. The 30-year and 40-year have simply never been here — both printed record highs on August 18.
When the world's largest creditor nation repatriates capital because domestic bonds finally pay, the marginal buyer of every other country's long debt gets thinner. That is the transmission channel, and it runs through everything.
Four forces, pushing the same direction
Bond selloffs usually have one cause. This one has four, and they are reinforcing rather than offsetting.
1. Energy is re-igniting inflation
The resumption of armed conflict between the United States and Iran pushed crude sharply higher through late August. Energy prices in the eurozone were running 14.3% higher year over year, and headline eurozone inflation accelerated to 3.3% in August from 2.9% in July. Long bonds are the purest inflation instrument there is: thirty years of fixed coupons are worth dramatically less if average inflation runs a point higher than assumed. Our safe-haven scorecard for gold in every U.S. recession since 1973 shows how reliably an energy-led inflation scare reshuffles the same set of assets.
2. Central banks pivoted from cutting to hiking
This is the part that still surprises people. The Federal Reserve, under Chair Kevin Warsh, is no longer debating the pace of cuts. At Jackson Hole, Warsh said underlying inflation trends had not "meaningfully improved," and the market moved hard. Ahead of the September 16 FOMC meeting, futures and prediction markets have priced the odds of a 25 basis-point hike anywhere from roughly 48% to 70%, depending on the venue. The European Central Bank is widely expected to hike as well.
"With inflation still accelerating, the ECB is all but certain to hike at next week's meeting," said Leo Barincou of Oxford Economics.
We laid out the historical template for exactly this situation in every Fed rate-hike cycle since 1983 and, for the mirror image, every rate-cut cycle since 1980. The short version: the front end reprices fast, the long end reprices last — and when the long end finally moves, it moves further than anyone budgeted for.
3. Governments are issuing more than the market wants
Total U.S. public debt outstanding crossed $40 trillion on August 18, 2026, and stood at $40.10 trillion on September 3. Across the G7, debt is at or above 100% of output in every country except Germany. France carries gross debt of 118.4% of GDP, heading for 120.5% next year on a 5.2% deficit — which is why French borrowing costs spent much of the summer above Italy's.
"France is the country in the euro area with the most unsustainable fiscal outlook, and its borrowing cost should reflect that," said Robert Timper of BCA.
Britain now spends roughly 4% of national output servicing its debt, about double its pre-pandemic decade average. We examined Washington's attempt to manage its own maturity wall in Trump's Treasury bond buybacks, and the politics of the September decision in 2026 midterms meet the Fed.
4. The AI capex boom is competing for the same money
This force is new, and it is the one most investors underweight. Global corporate bond issuance hit $4.9 trillion in 2026, up 14% year over year, and major technology companies alone raised roughly $220 billion to fund data centers, accelerators and power.
Every dollar of that is a dollar of duration supply competing with governments for the same fixed-income bid. The AI trade is no longer only an equity story — companies like NVDA, AVGO, MSFT and AMZN are now meaningful issuers whose capital plans set the clearing price of credit. When Broadcom reported on September 3, AI semiconductor revenue was up 221% year over year and the stock still fell 6%, partly because the market is repricing what that growth costs to finance.
The $40 trillion arithmetic
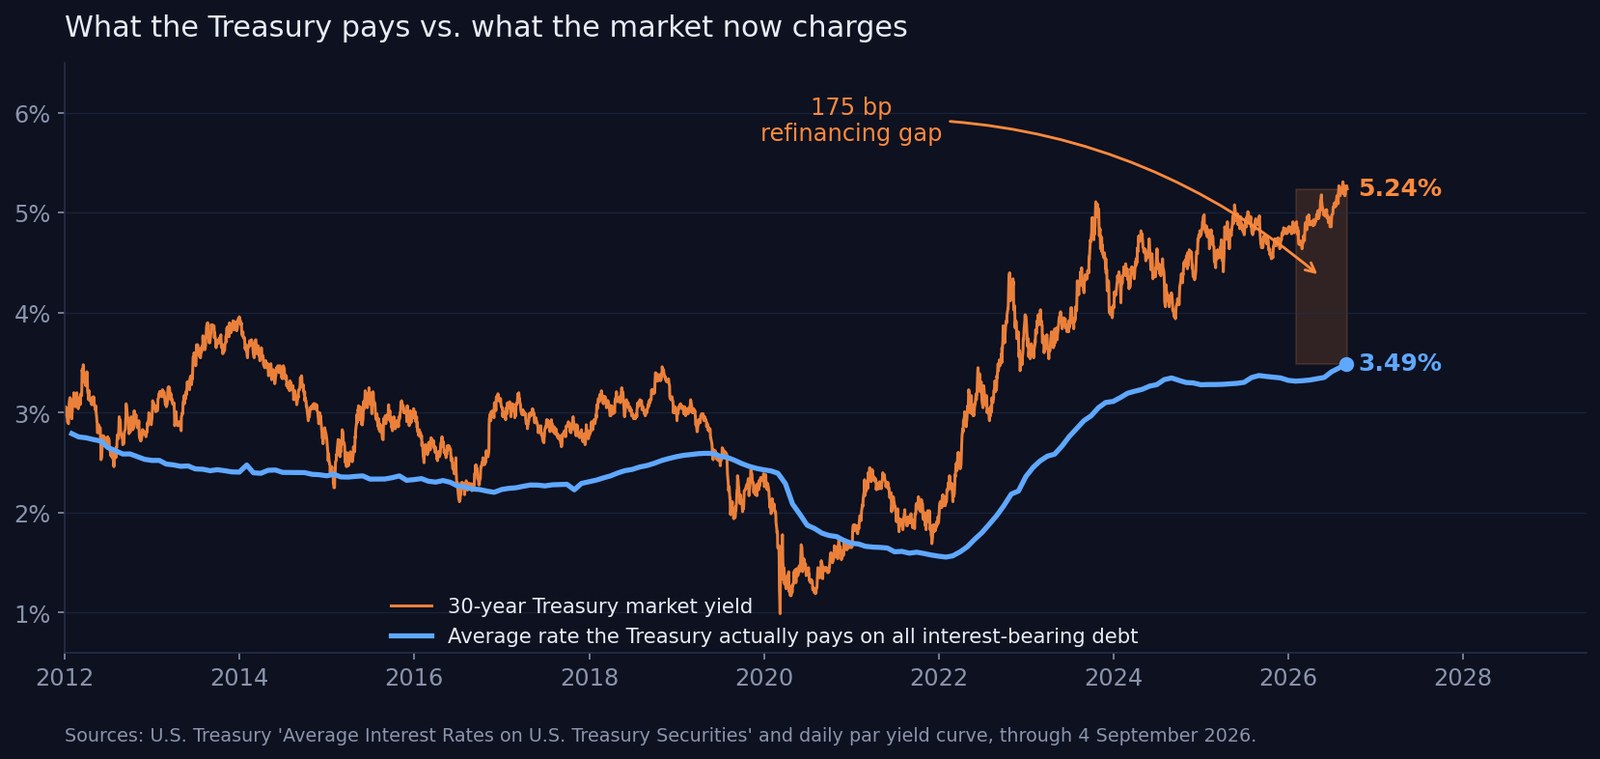
Here is the number that deserves more attention than the 30-year yield itself.
As of August 31, 2026, the weighted-average interest rate the U.S. Treasury actually pays across all interest-bearing debt was 3.490%. Treasury bonds specifically averaged 3.453%; notes 3.345%; bills 3.788%.
The market is currently charging 5.24% for thirty-year money.
That 175 basis-point gap is the whole fiscal problem in one figure. The average rate is a slow-moving average of coupons set years ago. It only converges on the market rate as old debt matures and is refinanced. In January 2022 that average bottomed at 1.556% — an all-time low. It has since climbed to 3.49%, and it is still 175 basis points short of today's market clearing rate.
In other words: the repricing of America's debt stock is roughly half finished, and the second half is already contracted.
| Milestone | Date crossed | Days from previous |
|---|---|---|
| $35 trillion | July 26, 2024 | 210 |
| $36 trillion | November 21, 2024 | 118 |
| $37 trillion | August 11, 2025 | 263 |
| $38 trillion | October 21, 2025 | 71 |
| $39 trillion | March 17, 2026 | 147 |
| $40 trillion | August 18, 2026 | 154 |
Five trillion dollars of new debt in twenty-five months, arriving into a market that is simultaneously demanding a higher term premium. That is the supply-demand collision the long end is expressing.
What a 5.24% long bond does to stocks
The mechanical effect is on the discount rate, and it is unforgiving to long-duration equities.
At a forward price-to-earnings multiple of roughly 21.5×, the S&P 500's forward earnings yield is about 4.6%. The 30-year Treasury pays 5.24%. For the first time in this cycle, the risk-free long bond out-yields the index's forward earnings by more than half a percentage point.
That does not mean stocks must fall. Equity earnings grow and coupons do not, which is the entire case for owning them. But it does mean the equity risk premium — the extra compensation for holding stocks instead of governments — has compressed to something close to zero or negative on this measure. Investors are being asked to accept equity risk for no visible yield advantage.
What actually happens in practice:
- Long-duration growth compresses hardest. Companies whose value sits in cash flows a decade out are the most sensitive to the terminal rate.
- Balance-sheet quality starts mattering again. Businesses refinancing floating or short-dated debt into a 5%-plus curve face real margin pressure. Businesses sitting on net cash earn 4% on it.
- Dividend and value sectors get a relative bid, because their cash flows are nearer.
- Rate-sensitive real-economy demand slows. The 30-year mortgage is back near 6.7%, a one-year high.
Equities have so far absorbed this with striking calm. The S&P 500 closed at 7,666.60 on September 3, the Dow at 53,061.95 and the Nasdaq at 26,217.83, all higher on the day. That resilience is itself the risk: the bond market has repriced and the equity market has not.
What it means for crypto
Bitcoin has behaved less like a hedge against fiscal debasement and more like a long-duration risk asset, which is what the correlation data has said for years.
BTC rose 24.95% in August, an unusually strong month driven mostly by fund inflows while other cohorts sold, and was trading near $77,300 in early September. It then wobbled as oil spiked and rate-hike odds climbed — the same reaction function as the Nasdaq, not gold.
The honest framing is that a rising real long rate is a headwind for ETH and BTC alike, because it raises the opportunity cost of holding a non-yielding asset. The counter-argument — that a government issuing $5 trillion in two years is precisely the case for a fixed-supply asset — is real but operates on a much longer horizon than a September FOMC meeting. Both things can be true, and traders keep confusing the timeframes.
How to track the long end without a Bloomberg terminal
The data that drives all of this is public and free. The U.S. Treasury publishes its daily par yield curve every afternoon, Japan's Ministry of Finance publishes the full JGB curve, and the Treasury's Fiscal Data service publishes the average interest rate on the debt stock monthly. Every U.S. and Japanese figure in this article came from those three sources.
Where it gets hard is connecting a move in the long bond to what it does to a specific position. That is the gap SimianX is built for. Market Pulse flags the cross-asset moves as they happen, live analysis sessions let you put a specific ticker in front of a panel of frontier AI models and ask what a 5.3% discount rate does to its multiple, and the AI model leaderboard shows which models have actually been right about rate-sensitive assets rather than which sound most confident. For positions you want watched continuously rather than checked manually, autopilots run the monitoring for you.
Frequently asked questions
Why are bond yields rising in 2026 if central banks are supposed to control rates?
Central banks set the overnight rate. The market sets everything beyond about two years. The 2026 move is concentrated in the long end precisely because it reflects things policy does not control: expected average inflation over thirty years, the volume of debt to be absorbed, and the term premium investors demand for taking duration risk.
If long yields are rising, should I just buy long bonds?
A higher yield means new purchases earn a bigger coupon, but it also means the long bonds you already hold are taking price losses. Whether it is worth buying depends on whether you believe yields have peaked — and of the four forces described above, at least three show no obvious relief before the end of 2026. For most investors the sturdier move is to shorten duration rather than reach for the longest maturity on the way down.
Is a 5.24% 30-year yield historically high?
No — it is historically normal, and that is the point. The 30-year averaged well above 6% through the 1990s. What is unusual is the sixteen-year sub-5% stretch from 2007 to 2023 that shaped current investor intuition.
Does a steepening curve mean the recession risk is over?
Not reliably. Curves typically re-steepen before recessions arrive, as the front end anticipates cuts or the long end demands more premium. Our yield-curve inversion reference table shows the inversion, not the re-steepening, is the signal with the record.
Why did Japan's bond market matter so much this time?
Japanese institutions have been among the largest foreign buyers of U.S. and European long bonds for decades, funded by near-zero domestic yields. With the 10-year JGB near 3% and the 30-year at a record, that trade no longer needs to leave home. The marginal foreign bid for everyone else's duration weakens.
What would make yields fall from here?
A genuine break in energy prices, a credible fiscal consolidation in the U.S., U.K. or France, or a growth scare severe enough to overwhelm the supply story. The first two are policy choices. The third is not the kind of relief equity investors should hope for.
The bottom line
The 30-year Treasury at 5.31% is not a fear trade or a technical overshoot. It is the market re-establishing a price for long-term money after sixteen years in which that price was suppressed — by crisis, by central bank purchases, and by the assumption that inflation was permanently solved.
The single most important number is not the yield. It is the 175 basis-point gap between the 3.49% the Treasury currently pays and the 5.24% the market now charges. That gap closes mechanically, one maturing bond at a time, regardless of who wins an election or what the Fed does on September 16.
Every valuation model built between 2008 and 2022 assumed the opposite. Repricing those assumptions is the work of the next several years, and the bond market has started without waiting for permission.
Sources: U.S. Department of the Treasury daily par yield curve and Fiscal Data average interest rates; Japan Ministry of Finance JGB interest rate series; market reporting for U.K., German and French levels, September 1–4, 2026. Yields cited are constant-maturity closes unless noted. Nothing here is investment advice.