Back to Leaderboard
Convex Finance
AI Crypto Asset Analysis

Convex Finance

CVX

Convex is a protocol that simplifies Curve boosting experience in order to maximize yields. Convex allows Curve liquidity providers to earn trading fees and claim boosted CRV without locking CRV themselves. Liquidity providers can receive boosted CRV and liquidity mining rewards with minimal effort. If you would like to stake CRV, Convex lets users receive trading fees as well as a share of boosted CRV received by liquidity providers. This allows for a better balance between liquidity providers and CRV stakers as well as better capital efficiency.

Market Rank #315Category DeFi

Quick Start

Choose an exchange-specific pair and open Live with analysis auto-started for that market.

OKX
Perpetual SwapUSDT

CVX/USDT

OKX

Avg Win Rate

-

Best Timeframe

-

Analysis for CVX/USDT

The selected pair shows the latest fundamental and news analysis, together with analyzed time.

Fundamental Analysis

Last analyzed

This analysis is more than 14 days old. Its levels and news may no longer apply; start a live analysis for a current read.

Overall, the analysis leans towards a slightly bearish to neutral bias in the short term, with the potential for a bounce due to oversold conditions on the 4H timeframe. The long-term trend is uncertain.

Okay, let's dive into a detailed analysis of CVX/USDT.

1. Trend Analysis:

  • Overall Trend: On the daily timeframe, CVX shows a volatile sideways trend after a significant pump on 2026-01-03. Zooming into shorter timeframes (4H, 1H), reveals a downtrend. The price has retraced significantly from its recent high.
  • Recent Price Action: The most recent hourly candles show some consolidation around the $1.97-$1.98 level.
  • Monthly Candle: The last monthly candle closed positive, indicating buying pressure over the long term, but this needs to be balanced against the more recent downtrend on shorter timeframes.

2. Key Support and Resistance Levels:

  • Resistance:
    • Immediate Resistance: $1.98 (current price area)
    • Stronger Resistance: $2.00 - $2.01 (psychological level and recent high on shorter timeframes)
    • Further Resistance: $2.20 - $2.30 (based on 4H and Daily candles)
  • Support:
    • Immediate Support: $1.95 (recent low on hourly timeframe)
    • Stronger Support: $1.91 - $1.92 (significant level on 4H and Daily timeframes)
    • Further Support: $1.70 - $1.75 (previous consolidation zone on the Daily chart)

3. Market Structure and Sentiment:

  • Market Structure: The market structure is currently in a downtrend on shorter timeframes (1H, 4H). The price is below the 20-period SMA on the hourly chart, reinforcing the bearish sentiment.
  • Sentiment: The RSI on the 4H timeframe is at 20.1, indicating oversold conditions. This could suggest a potential bounce, but it's not a guarantee. The hourly RSI is 38.6, also leaning towards oversold territory. The 15 min RSI is at 65, indicating buying pressure.
  • Volume: Volume has been declining on the hourly timeframe, suggesting weakening bearish momentum. However, significant volume spikes can be seen on the 4H chart during the recent downtrend.

4. Indicators Analysis:

  • Moving Averages: On the hourly timeframe, the price is below the 12 and 26 EMA, suggesting bearish momentum. On the daily timeframe, the price is below the 20 SMA.
  • MACD: The hourly MACD is showing a bullish crossover, which may indicate a short-term bounce. The Daily MACD histogram is negative, suggesting a loss of bullish momentum.
  • Bollinger Bands: The price is currently near the lower Bollinger Band on the hourly timeframe, which could lead to a bounce.
  • Volume: The volume is low compared to the 20-period SMA on the 1H, indicating low trading activity.
  • ATR: The ATR (Average True Range) indicates volatility. The ATR is low on the 1m and 5m timeframes, but higher on the 1H and 4H, reflecting the increased volatility during the recent price swings.

5. Overall Directional Bias:

Given the analysis, I'm leaning towards a slightly bearish to neutral bias in the short term, with the potential for a bounce.

  • Bearish Factors: The overall trend on the shorter timeframes is down. The price is below key moving averages on the hourly chart.
  • Neutral/Bullish Factors: The oversold RSI on the 4H timeframe and the bullish crossover on the hourly MACD suggest a possible bounce.

Trading Considerations:

  • Short-Term: A trader might consider looking for a short-term bounce towards the $2.00 - $2.01 resistance level. However, be cautious, as the overall trend is still bearish.
  • Long-Term: A trader should wait for a clear break above the $2.30 resistance level before considering a long-term bullish position. Watch for a confirmation of the reversal of the downtrend on higher timeframes.
  • Risk Management: Given the volatility, use appropriate stop-loss orders.

Confidence Score:

I'd give this analysis a confidence score of 65/100. The short-term is uncertain due to oversold conditions, but the overall bearish trend on shorter timeframes cannot be ignored.

Disclaimer: This is an analysis based on the provided data and should not be taken as financial advice. Trading cryptocurrencies involves significant risk, and you should always do your own research before making any investment decisions.


News Analysis

Last analyzed

This analysis is more than 14 days old. Its levels and news may no longer apply; start a live analysis for a current read.

The analysis suggests a bearish outlook for CVX due to market volatility and Bitcoin's decline, outweighing positive news like regulatory clarity and potential institutional interest.

1. News Impact Analysis

a. Sei Labs Research on Stablecoins

  • What happened? Sei Labs published research suggesting that stablecoins can turn the U.S. Federal Reserve into a global retail bank.
  • Why does it matter for CVX? If stablecoins are widely adopted, they could increase liquidity and transaction volumes in decentralized finance (DeFi), potentially benefiting CVX as a governance token for Convex Finance, which enhances yield farming on Curve.
  • Expected price impact: Neutral to slightly bullish in the long term as stablecoin adoption increases, leading to more trading in DeFi.
  • Timeframe: Longer-term impact as market adjusts to stablecoin integration.

b. Onchain Stock Exchange Announcement

  • What happened? A major announcement from the NYSE regarding an equity tokenization platform.
  • Why does it matter for CVX? This could attract institutional interest in DeFi projects like Convex, as tokenized equities may create a bridge between traditional finance and crypto markets.
  • Expected price impact: Bullish, as increased institutional engagement may result in higher demand for CVX.
  • Timeframe: Medium-term impact as the announcement is digested.

c. Institutional Liquidations Due to Trade War Jitters

  • What happened? Market volatility surged, leading to significant liquidations amid geopolitical tensions.
  • Why does it matter for CVX? Increased volatility and selling pressure in the broader crypto market can lead to a risk-off sentiment, negatively impacting CVX.
  • Expected price impact: Bearish, as liquidations could trigger further selling in altcoins, including CVX.
  • Timeframe: Immediate impact as liquidations occur now.

d. Bitcoin Market Correction and Altcoin Slide

  • What happened? Bitcoin fell below $95,000, causing a decline in the overall crypto market.
  • Why does it matter for CVX? As Bitcoin declines, altcoins often follow due to correlated market movements. CVX may experience downward pressure as traders exit alt positions for safety.
  • Expected price impact: Bearish, as the altcoin market, including CVX, sees significant selling pressure.
  • Timeframe: Immediate to short-term impact.

e. CFTC’s Regulatory Moves

  • What happened? The CFTC appointed a crypto litigation specialist and proposed a plan to modernize crypto oversight.
  • Why does it matter for CVX? Positive regulatory clarity can foster growth in the DeFi space, benefiting tokens like CVX. However, the neutral sentiment indicates market uncertainty about the scope of regulatory changes.
  • Expected price impact: Neutral to slightly bullish over time as clarity can lead to increased confidence.
  • Timeframe: Longer-term as regulations are implemented.

f. Altcoin Season Slide

  • What happened? The Altcoin Season Index fell, indicating Bitcoin's dominance over altcoins.
  • Why does it matter for CVX? A bearish trend in altcoins usually leads to reduced investment in altcoins like CVX, causing downward pressure.
  • Expected price impact: Bearish, as traders shift focus to Bitcoin.
  • Timeframe: Immediate to short-term impact.

g. Delaware Life and BlackRock Bitcoin Exposure

  • What happened? New Bitcoin-linked annuities were announced.
  • Why does it matter for CVX? This could signify a growing acceptance of crypto in traditional finance, potentially boosting DeFi projects as more institutions seek exposure to crypto.
  • Expected price impact: Bullish, as increased institutional interest may positively impact CVX.
  • Timeframe: Medium-term impact as institutions adjust their portfolios.

2. Market Sentiment (from Polymarket)

  • There is no specific prediction market data available to gauge market confidence. However, the mixed sentiments from the news suggest a cautious approach among traders, with bearish indicators dominating the short-term outlook.

3. Synthesize Actionable Insights

  • Overall Direction: Bearish bias in the immediate term due to significant selling pressure in the altcoin market and geopolitical uncertainties. Longer-term outlook could be bullish if institutional interest grows.
  • Key Catalysts: Watch for developments in the Bitcoin market, regulatory clarity from the CFTC, and any news from institutional players regarding crypto adoption.
  • Risk Factors: Continued geopolitical tensions, further market liquidations, and a prolonged downturn in altcoin sentiment could adversely affect CVX prices.
  • Trading Recommendation: Traders should closely monitor Bitcoin's price movements and overall market sentiment. A cautious approach is advised, with potential opportunities to accumulate CVX if prices stabilize post-correction. Watch for any supportive regulatory news that could shift sentiment positively.

Related News

AMBCryptobullish

Convex Finance is up 22% – THIS data says CVX’s rally is not done

Convex TVL hits $597M as usage rises and token holders accumulate, fueling the rally.

Open source
BitcoinEthereumNewsneutral
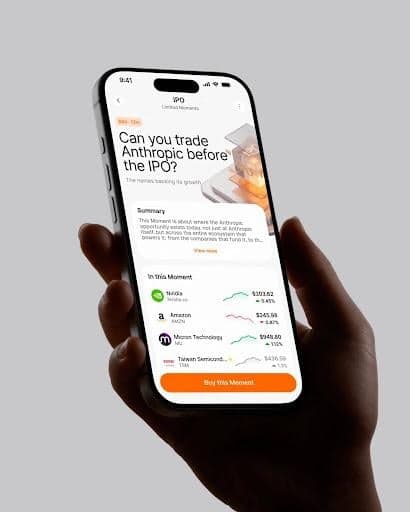
Rise launches moments, letting traders trade the market stories behind the news

Rise launches moments, letting traders trade the market stories behind the news

The post Rise launches moments, letting traders trade the market stories behind the news appeared on BitcoinEthereumNews.com. Six Moments go live on the Rise app. Each takes a single market question, maps the instruments that sit behind it, and opens the whole set in one tap. Rise, the trading app from INGOT Group, launched Rise Moments, a new way to act on a market view without researching, sizing and placing every instrument behind it one at a time. Every Moment starts w...

Open source
Changellybearish
Convex Finance (CVX) Price Prediction

Convex Finance (CVX) Price Prediction

Convex Finance Overview Our real-time CVX to USD price update shows the current Convex Finance price as $2.00 USD. Our analysis of the technical indicators suggests that the current market feeling is bearish Bearish 65%, with a Fear & Greed Index score of 74 (Greed). Over the last 30 days, Convex Finance has had 13/30 (43%) green days and 6.66% price volatility. Convex Finance Profit Calculator...

Open source
Kriptonovinibullish

Анализ на цените на CVX: Сигналите за препродажба RSI се възстановяват до $2.22

Технически анализ на CVXUSDT: Отскок на низходящия канал към цел 2.22, тъй като RSI сигнализира за възстановяване от препродаденост Токенът CVX на Convex Finance се приближава до критична точка на пречупване на едночасовата графика, след като се плъзна до долната граница на краткосрочен низходящ канал. Ценовото действие сега е близо до многосесийната подкрепа, докато индексът на относителната сила (Relative Strength Index) е навлязъл в територия на препродажба, създавайки...

Open source

Tradable Markets

Browse every supported spot and perpetual market by exchange, then launch analysis immediately.

Period
Timeframe
Side

Model Rankings for CVX

Review how CVX performs across models under the current filter.

No trading data available for CVX

Why use this Convex Finance page

See how AI models perform on Convex Finance, compare live markets by exchange, and choose the exact pair you want to open.

Use this page when you want to move from asset-level ranking into a specific live market.

Related Assets

Continue into other closely watched asset pages.

Related research

More in Crypto cycles

FAQ

Where do the CVX pairs come from?

They are the live CVX markets currently available across supported exchanges. Use them to compare spot and perpetual choices, then open the market you actually want to analyze.

What happens after I press start analysis?

You will open Live with the selected market already filled in, and analysis will begin automatically. That lets you move straight from this page into the market you want to review.

Is the best CVX model always the best pair to trade?

Not always. A strong model on CVX does not mean every exchange and contract type behaves the same way, so this page shows both the overall model ranking and the specific markets you can open.