HYPE/USDT Analysis
Data reference: 2026-10-30 06:49 UTC
Current price: 93.12–93.14 USDT
Short-term horizon: Next 24 hours
1. Trend Analysis
Daily trend: Strongly bullish, but extended
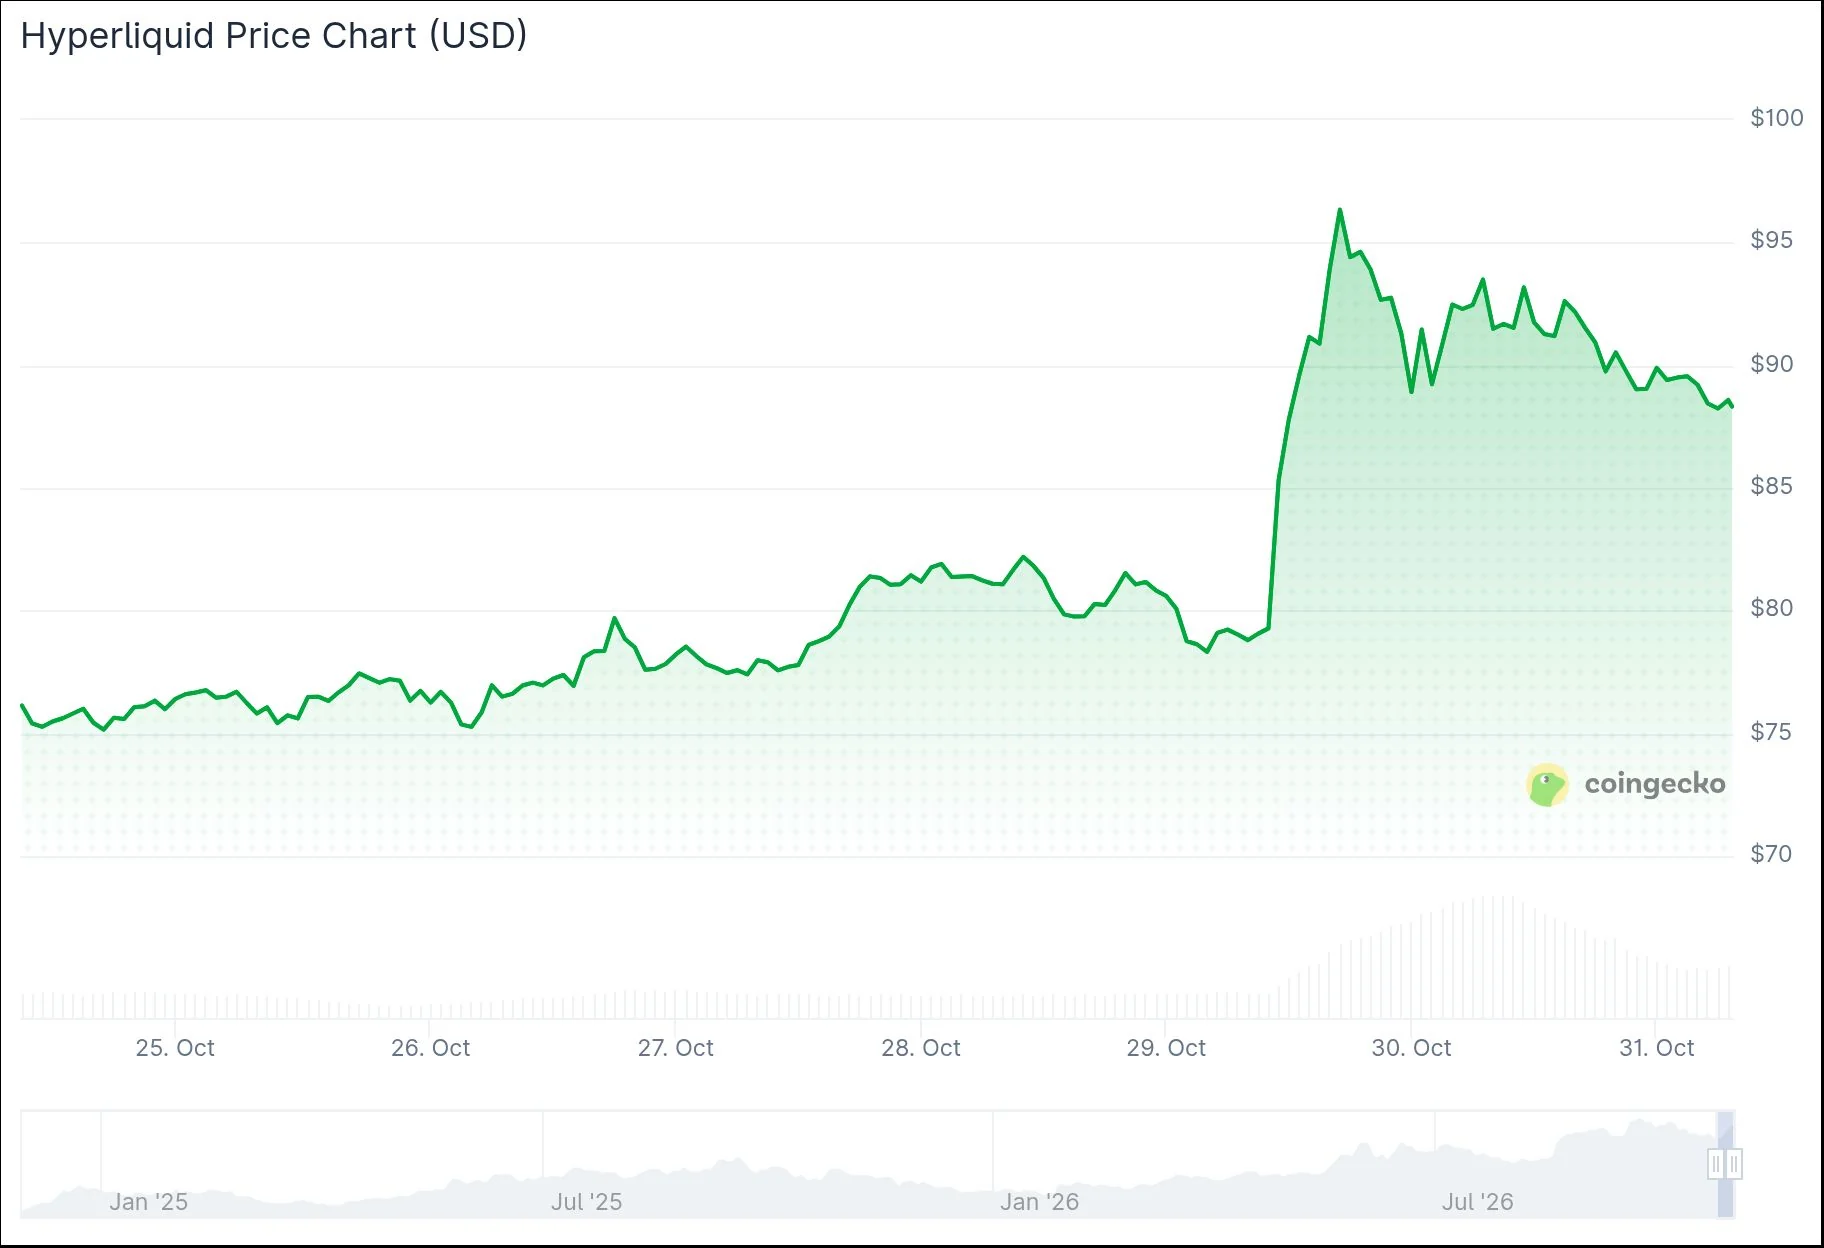
HYPE has appreciated:
- +17.74% over 24 hours
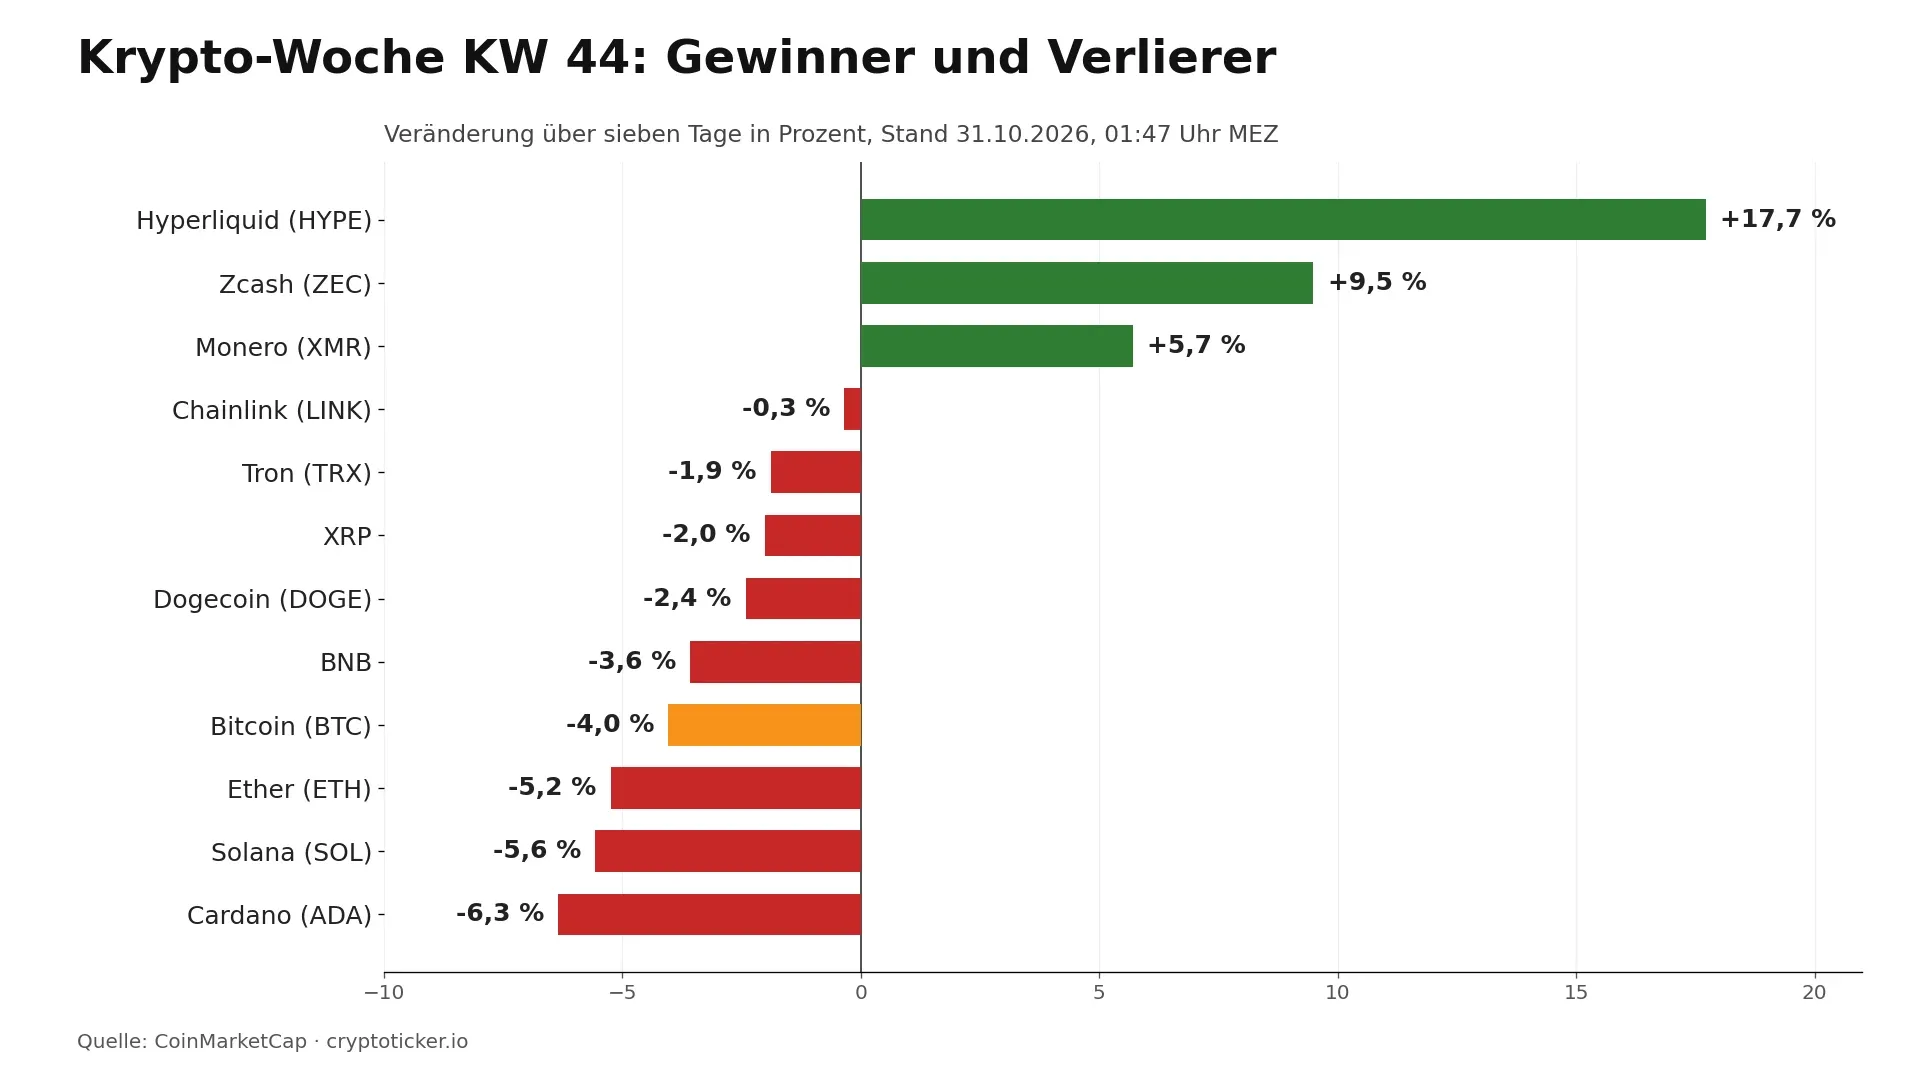
- +18.71% over 7 days
- Price is trading near the upper portion of the recent range, at approximately 79% of the 24-hour range
- 24-hour volume is 4.36x the 7-day daily average
The daily candles show a sharp breakout from the 76–82 USDT consolidation area. The previous daily candle reached 97.74 USDT, confirming strong upside momentum, although the large intraday range also shows substantial volatility and profit-taking risk.
Price is currently above:
- EMA 12: 82.96
- EMA 26: 83.31
- SMA 20: 81.01
- Bollinger Band middle: 81.01
- Bollinger Band upper: 89.43
Trading above the upper Bollinger Band indicates powerful momentum, but also means the market is stretched in the short term. A return toward the 89–90 USDT area would be technically normal and would not necessarily invalidate the bullish trend.
Momentum indicators
Although the MACD line remains slightly negative in absolute terms, it is well above the signal line and the histogram is strongly positive. This represents a bullish momentum reversal and supports continuation, provided price does not sharply reject the recent highs.
Volume
The volume expansion is a major positive factor. A breakout accompanied by volume above 4x the recent average is more credible than a low-volume price spike. However, such an extreme volume increase can also occur during liquidation events or short-covering, meaning the market may need to consolidate before another sustained advance.
2. Key Support and Resistance Levels
Resistance
97.00–97.74 USDT
This is the immediate and most important resistance zone.
- Recent 24-hour high: 97.088
- Recent daily high: 97.74
- Psychological resistance: 100.00
A decisive close above 97.74, preferably with sustained volume, would confirm a fresh breakout and expose the 100–105 USDT region.
100.00 USDT
This is a major psychological level. It may attract:
- Profit-taking from recent buyers
- New short positions
- Increased volatility and failed-breakout risk
A move above 100 USDT without a meaningful increase in selling pressure would strengthen the medium-term bullish structure.
105.00–110.00 USDT
This is a potential extension zone if HYPE establishes acceptance above 100 USDT. There is limited recent price history above the current range, so these levels are projections rather than well-tested historical resistance.
Support
89.00–90.00 USDT
This is the first important support zone.
- Previous daily close: approximately 89.06
- Recent breakout region
- Close to the upper Bollinger Band area
Holding this zone would suggest that the breakout remains structurally healthy.
84.00–86.00 USDT
This is a stronger intermediate support area based on:
- Recent daily opening and closing prices
- The EMA 12 and EMA 26 region
- The upper portion of the prior consolidation
A pullback into this zone would represent a deeper but still potentially constructive retest.
80.00–82.00 USDT
This is the key structural support zone.
- Prior consolidation range
- Near the SMA 20 at 81.01
- Near the daily EMA cluster
- Several recent daily closes occurred in this region
A sustained move below 80 USDT would weaken the breakout thesis and suggest that the recent rally was primarily a temporary volatility event.
76.00–78.00 USDT
This is major lower support, corresponding to the recent base and several daily lows. A break below this area would materially damage the short-term bullish structure.
3. Market Structure and Sentiment
Market structure
The recent structure has shifted from a prolonged decline and consolidation into a bullish impulse:
- Price formed a base around 76–82 USDT
- HYPE broke above the prior trading range
- Price accelerated toward 97.74 USDT
- The current price remains substantially above the breakout area
This is a bullish market-structure transition, but the move has occurred very quickly. The market is now vulnerable to a retest of the breakout zone.
The daily price is approximately:
- 12% above the EMA 12
- 12% above the EMA 26
- 15% above the SMA 20
That degree of separation reflects strong momentum but also increases mean-reversion risk.
Derivatives sentiment
The derivatives data is bullish but not yet at an extreme:
- Funding: +0.0100% per 8 hours
- 7-day average funding: +0.0075%
- Open interest change: +10.78%
- Top-trader account long/short ratio: 1.08
- Top-trader position long/short ratio: 0.98
Interpretation:
- Positive funding shows that longs are paying shorts, indicating bullish positioning.
- Funding is elevated relative to its 7-day average, but not excessively extreme.
- Rising open interest alongside rising price confirms that new positions are entering the move.
- The account ratio is modestly long, while the position ratio is slightly short. This suggests that larger positions are not aggressively one-sided long.
This combination is healthier than an extreme long squeeze setup, but the increase in open interest means a sharp reversal could trigger long liquidations if price loses the 89–90 USDT support zone.
Sentiment assessment
Sentiment is strongly optimistic, driven by:
- Large 24-hour gain
- Breakout above the recent range
- Very high volume
- Positive funding
- Rising open interest
However, sentiment is becoming crowded at the short-term level because RSI is above 70 and price is above the upper Bollinger Band. The market is bullish, but chasing at 93–97 USDT carries unfavorable risk/reward unless price consolidates or successfully retests support.
4. Fundamental Analysis
Hyperliquid is a high-performance Layer 1 focused on fully on-chain financial applications and native trading infrastructure. Its investment thesis is connected to:
- Growth in decentralized perpetual and spot trading
- Protocol trading activity and fee generation
- User retention and liquidity depth
- Expansion of the Hyperliquid ecosystem
- Demand for HYPE-related utility, governance, staking, or economic participation
- Competitive positioning against other decentralized exchanges and Layer 1 networks
The market-cap rank of 25 indicates that HYPE is already a significant crypto asset rather than an early micro-cap project. This can improve liquidity and institutional visibility, but it also means future upside increasingly depends on continued adoption, revenue growth, ecosystem expansion, and token economics.
Supply considerations are important:
- Circulating supply: 270,772,999.43414140
- Total supply: 999,835,210.43414140
- Max supply: 1,000,000,000.00000000
Only approximately 27.1% of the maximum supply is circulating. Future unlocks, emissions, distributions, or other supply expansion could create sell pressure and should be monitored closely. Conversely, strong protocol growth and demand could offset this dilution.
For the next 24 hours, fundamentals are primarily a backdrop, not the main price driver. No specific earnings, guidance, or funding event has been provided for this window. The immediate price action is being driven mainly by momentum, volume, market positioning, and breakout dynamics.
5. 24-Hour Scenario Analysis
Bullish continuation scenario
A bullish continuation would be supported if:
- Price holds above 89–90 USDT
- Buyers reclaim and sustain 97.74 USDT
- Volume remains elevated without a sharp reversal
- Funding does not become excessively positive
- Open interest rises in an orderly manner rather than surging during a vertical candle
Targets in this scenario:
- 97.74 USDT
- 100.00 USDT
- 105.00–110.00 USDT
Consolidation scenario
After a move of nearly 18% in 24 hours, consolidation is highly plausible. Price could trade between:
This would allow RSI to cool while preserving the broader bullish structure. Consolidation would be constructive if support remains above 89 USDT.
Bearish pullback scenario
A bearish short-term reversal becomes more likely if:
- Price rejects 97–100 USDT
- Price falls below 89 USDT
- Volume expands during selling
- Open interest remains elevated while price declines
- Price loses the 84–86 USDT zone
Potential downside levels:
- 89–90 USDT
- 84–86 USDT
- 80–82 USDT
A fall below 80 USDT would substantially weaken the breakout and could open the way toward 76–78 USDT.
6. Overall Directional Bias
Bias: Bullish, with elevated pullback risk
The overall trend is bullish because:
- Price is above all major short-term moving averages
- The market broke out of a multi-day consolidation zone
- Volume strongly confirms participation
- MACD momentum has turned positive
- Funding and open interest support active bullish positioning
- Price structure shows higher highs and higher lows in the latest impulse
The main risks are:
- RSI is overbought at 73.49
- Price is above the upper Bollinger Band
- The recent rally is unusually steep
- Price is close to major resistance at 97.74–100.00 USDT
- Rising open interest could amplify a liquidation-driven pullback
- Low circulating supply relative to maximum supply creates potential dilution risk
For the next 24 hours, the preferred approach is not to chase aggressively at current levels. A hold above 89–90 USDT would maintain the bullish setup, while a confirmed breakout above 97.74 USDT would improve continuation odds.
Trade Stance
Preferred stance: Wait for confirmation or a pullback rather than chase the current spike.
- Long bias: Above 89–90 USDT, especially after a successful retest
- Breakout confirmation: Sustained trading above 97.74 USDT
- Risk invalidation: Sustained loss of 84–86 USDT, with stronger invalidation below 80–82 USDT
- Short bias: Only becomes attractive after a confirmed rejection near 97.74–100.00 USDT and a breakdown below 89 USDT
Confidence Score
78/100 — bullish
This score reflects strong trend, volume, and market-structure confirmation. The score is reduced from a higher level because the asset is significantly extended, RSI is overbought, price is near major resistance, and open interest has increased alongside a sharp rally.