
Back to Leaderboard
Terra
AI Crypto Asset Analysis

Terra

LUNA

Terra 2.0 which will assume the Terra name is a new blockchain launched by Terraform Labs as part of the passing of governance proposal 1623.

Market Rank #471Category Other

Quick Start

Choose an exchange-specific pair and open Live with analysis auto-started for that market.

Avg Win Rate

-

Best Timeframe

-

Analysis for LUNA/USDT

The selected pair shows the latest fundamental and news analysis, together with analyzed time.

Fundamental Analysis

Last analyzed

This analysis is more than 14 days old. Its levels and news may no longer apply; start a live analysis for a current read.

The overall trend is bearish, with the price in a downtrend. Short-term consolidation suggests potential for a bounce, but the long-term outlook remains negative.

LUNA/USDT Comprehensive Technical Analysis

1. TREND ANALYSIS

Current Market Structure

Overall Trend: BEARISH with Short-term Consolidation

  • Daily Timeframe (1D): Strong downtrend evident. Price has declined from $0.1063 (December open) to $0.0801 (current), representing a 24.6% monthly decline
  • 4-Hour Timeframe (4H): Mixed signals - price oscillating in a narrow range ($0.0796-$0.0825) with lower highs and lower lows pattern
  • 1-Hour Timeframe (1H): Slight upward momentum in last 4 hours (from $0.0796 to $0.0801), but within a larger downtrend
  • 5-Minute to 1-Minute: Sharp consolidation around $0.0800-$0.0801 with minimal volatility

Key Observation: The price has stabilized at current levels after a significant selloff, but the broader weekly/monthly trend remains decidedly negative.


2. KEY SUPPORT AND RESISTANCE LEVELS

Critical Price Points (Based on Recent Data)

LevelTypeSignificance
$0.0757Support52-week low; established on Jan 17 (4H candle)
$0.0796-$0.0800SupportCurrent consolidation zone; multiple touches in last 24hrs
$0.0810-$0.0815ResistanceLocal resistance; tested multiple times on 1H timeframe
$0.0825Resistance4H resistance level; represents recent swing high
$0.0850ResistancePsychological level; previous support now resistance
$0.0950-$0.0970Strong ResistanceFormer support zone (Jan 3-5); major downtrend initiator
$0.1100+Major ResistanceSMA 50 ($0.11) and EMA 50 ($0.10) - long-term moving averages

Support/Resistance Analysis:

  • Immediate Support: $0.0796 (very tight, 0.17% below current)
  • Secondary Support: $0.0757 (recent low, 5.5% below)
  • Immediate Resistance: $0.0815 (1.75% above)
  • Major Resistance: $0.0950+ (18% above)

3. MARKET STRUCTURE AND SENTIMENT

Technical Indicators Analysis

Momentum Indicators (RSI)

TimeframeRSI ValueSignal
1-Minute68.75Overbought (>70) - approaching extremes
5-Minute72.34OVERBOUGHT - potential pullback risk
15-Minute52.17Neutral - balanced momentum
1-Hour73.86OVERBOUGHT - strong short-term rally
4-Hour37.20OVERSOLD - suggests potential bounce
Daily31.18OVERSOLD - bearish exhaustion signal

RSI Interpretation:

  • Short-term (1m-1H) shows overbought conditions indicating a potential pullback
  • Longer-term (4H-1D) shows oversold conditions, suggesting the downtrend may be exhausting
  • Divergence Alert: 1H RSI is overbought while 4H RSI is oversold - conflicting signals

MACD Analysis

TimeframeMACDSignalHistogramStatus
1-Minute0.00.00.0Flat/Minimal
5-Minute0.00010.00.0Weak positive
15-Minute0.00010.00010.0Converging
1-Hour0.00020.00010.0001Weak bullish
4-Hour-0.0008-0.00110.0003Bearish (negative histogram)
Daily-0.006-0.0057-0.0003Bearish (negative, widening)

MACD Interpretation:

  • Daily MACD is negative and widening, confirming downtrend strength
  • 4H MACD is also negative, supporting bearish bias
  • Shorter timeframes show minimal momentum, suggesting indecision

Bollinger Bands

  • Current Price: $0.0801 (at middle band across all timeframes)
  • Band Width: Extremely tight across all timeframes, indicating low volatility
  • Implication: Price is compressed; breakout likely imminent

Volume Analysis

TimeframeCurrent VolumeSMA 20Status
1m1,6191,087Above average (+49%)
5m1427,710Below average (-98%)
15m1,76125,210Below average (-93%)
1H102,21695,698Above average (+7%)
4H367,484648,517Below average (-43%)
Daily1,913,9538,299,212Below average (-77%)

Volume Interpretation:

  • Declining volume on larger timeframes suggests weakness in the downtrend
  • Current consolidation lacks conviction (low volume)
  • This could precede a significant move in either direction

Market Sentiment Summary

  • Short-term (1m-1H): Bullish momentum with overbought RSI - risky entry
  • Medium-term (4H): Oversold conditions suggesting potential bounce
  • Long-term (1D): Bearish with oversold RSI and negative MACD - exhaustion phase
  • Overall: Mixed sentiment with technical exhaustion signals

4. OVERALL DIRECTIONAL BIAS

Primary Bias: BEARISH (Long-term) with NEUTRAL/CAUTIOUS (Short-term)

Reasoning:

Bearish Factors (Supporting Downtrend):

  1. ✗ 24.6% monthly decline from $0.1063 to $0.0801
  2. ✗ Daily RSI at 31.18 - deeply oversold but confirming downtrend exhaustion
  3. ✗ Daily MACD negative and widening - bearish momentum
  4. ✗ Price below SMA 50 ($0.11) and EMA 50 ($0.10) - below key moving averages
  5. ✗ Lower highs and lower lows pattern on 4H chart
  6. ✗ Volume declining on larger timeframes - weak conviction in recovery

Bullish Factors (Supporting Potential Bounce):

  1. ✓ Daily RSI at 31 - extreme oversold, historically precedes bounces
  2. ✓ 4H RSI at 37 - oversold on intermediate timeframe
  3. ✓ Price at support level ($0.0796-$0.0800 consolidation)
  4. ✓ Bollinger Bands compressed - breakout imminent
  5. ✓ LUNA 2.0 narrative - blockchain still operational with governance activity

Neutral/Risk Factors:

  1. ⚠ Conflicting RSI signals across timeframes (1H overbought vs 4H/1D oversold)
  2. ⚠ MACD showing weakness on 4H and 1D
  3. ⚠ Low volume across most timeframes - lacks conviction
  4. ⚠ Market cap rank #471 - relatively low liquidity and susceptibility to manipulation
  5. ⚠ Circulating supply concerns - 687M tokens with potential inflation from 1B total supply

5. TRADING SCENARIO ANALYSIS

Bull Case (Probability: 35%)

  • Trigger: Break above $0.0815-$0.0825 with volume
  • Target 1: $0.0850 (6% upside)
  • Target 2: $0.0950 (18% upside)
  • Stop Loss: Below $0.0757 (5.5% downside)
  • Risk/Reward: 1:1.2 to 1:3.3

Bear Case (Probability: 55%)

  • Trigger: Break below $0.0796 with volume
  • Target 1: $0.0757 (5.5% downside)
  • Target 2: $0.0731 (8.7% downside)
  • Stop Loss: Above $0.0825 (2.9% upside)
  • Risk/Reward: 1:1.9 to 1:3

Sideways Case (Probability: 10%)

  • Range: $0.0796-$0.0825 (0.36% range)
  • Duration: 2-5 days until breakout
  • Implication: Continuation pattern forming

6. CRITICAL LEVELS TO WATCH

LevelActionConfidence
$0.0815Resistance - potential short entry if rejectedHIGH
$0.0796Support - buy zone if heldMEDIUM
$0.0757Major support - breakdown if brokenHIGH
$0.0850Resistance - short-term target if bullishMEDIUM
$0.0950Major resistance - key level for trend reversalHIGH

FINAL ASSESSMENT

Summary

LUNA/USDT is in a bearish downtrend with signs of short-term exhaustion. The daily timeframe shows oversold conditions (RSI 31), but this has not yet triggered a meaningful recovery. Current consolidation at $0.0800-$0.0801 lacks volume conviction, suggesting the market is waiting for a catalyst.

The conflicting signals between timeframes (1H overbought vs 1D oversold) create an uncertain near-term environment. A breakout below $0.0796 would confirm further downside toward $0.0757 and beyond. Conversely, a breakout above $0.0815 with volume could signal a temporary bounce toward $0.0850-$0.0950.

Key Risk: LUNA's low market cap rank (#471) and declining volumes make it susceptible to sudden moves. The token's recovery depends heavily on broader crypto sentiment and Terra ecosystem developments.


CONFIDENCE SCORE: 32/100

Score Breakdown:

  • Trend Clarity: 7/10 (Clear downtrend, but exhaustion signals emerging)
  • Support/Resistance Validity: 8/10 (Well-defined levels with multiple touches)
  • Volume Confirmation: 4/10 (Low volume across all timeframes - major weakness)
  • Indicator Alignment: 5/10 (Conflicting signals between timeframes)
  • Risk/Reward Ratio: 6/10 (Asymmetric downside risk given oversold conditions)
  • Fundamental Narrative: 2/10 (LUNA 2.0 lacks compelling growth story; market cap rank suggests limited investor interest)

Interpretation:

The 32/100 score reflects HIGH CAUTION. While technical exhaustion suggests a potential bounce, the declining volume, weak momentum, and bearish longer-term structure make this an unfavorable risk/reward setup.

Recommendation:

  • Bearish traders: Wait for a break below $0.0796 with volume confirmation before shorting
  • Bullish traders: Require a close above $0.0815 on 1H with volume before considering longs
  • Conservative traders: AVOID until clearer directional bias emerges

This is NOT a strong buy or sell signal—it's a consolidation zone with downside bias. Patience is warranted.

News Analysis

Last analyzed

This analysis is more than 14 days old. Its levels and news may no longer apply; start a live analysis for a current read.

Several news items point to negative sentiment for LUNA, including scams, tax implications, and trust issues, outweighing the positive impact of the new ETF.

1. News Impact Analysis

News Item 1: Fraudster Extracts $500,000 Life Savings of Man

  • What happened? A man lost his $500,000 life savings to a pig butchering scheme, a type of scam prevalent in the crypto space.
  • Why does it matter for LUNA? This news highlights ongoing issues with scams in the crypto market, potentially leading to a loss of trust among retail investors, which can negatively impact LUNA's price.
  • Expected price impact: This is likely to cause selling pressure as negative sentiment regarding scams can deter new investments.
  • Timeframe: Immediate impact expected within the next 24-72 hours.

News Item 2: Bitwise Launches Bitcoin-Linked Debasement ETF

  • What happened? Bitwise introduced a new ETF that includes Bitcoin to protect against inflation and declining dollar power.
  • Why does it matter for LUNA? The launch of this ETF represents growing institutional interest in Bitcoin and other cryptocurrencies, which could lead to increased demand for LUNA as an alternative asset.
  • Expected price impact: This news is bullish and likely to create buying pressure, as it may attract new investors looking to diversify into cryptocurrencies.
  • Timeframe: Impact expected in the next 24-72 hours as news spreads.

News Item 3: Netherlands Eyes Unrealized Gains Tax on Stocks and Crypto

  • What happened? The Netherlands is considering a tax on unrealized gains for various asset classes, including cryptocurrencies.
  • Why does it matter for LUNA? This could create bearish sentiment in the European crypto market, as increased taxation may discourage investment in cryptocurrencies, including LUNA.
  • Expected price impact: This is expected to create selling pressure, as investors may choose to liquidate their holdings before the potential tax is implemented.
  • Timeframe: Effect may be felt soon, within the next 24-72 hours as discussions gain traction.

News Item 4: Betrayal in the Crypto Space

  • What happened? The article discusses themes of betrayal and trust issues in crypto, emphasizing risks associated with the ecosystem.
  • Why does it matter for LUNA? This can contribute to negative sentiment around LUNA and the broader crypto market, as trust is essential for investment.
  • Expected price impact: Likely to cause selling pressure as fear and uncertainty may lead to a decrease in buying interest.
  • Timeframe: Immediate impact expected within the next 24-72 hours.

Additional News Insights

  • Trading Psychology After a Losing or Winning Streak: While this is a neutral sentiment piece, it highlights the psychological factors influencing traders, which could indirectly affect market movements based on trading behavior.
  • Anoma’s Intent Gossip: This piece is also neutral and may not directly impact LUNA but reflects broader discussions affecting the crypto landscape.

2. Market Sentiment (from Polymarket)

  • Absence of Prediction Market Data: The lack of available prediction market data limits insights into immediate market confidence. However, the bearish sentiment from multiple news items suggests that market participants may be cautious or pessimistic.

3. Synthesize Actionable Insights

  • Overall Direction: Bearish bias due to a combination of scams, potential taxation, and trust issues in the crypto market.
  • Key Catalysts:
    • Ongoing news about scams could deter investors.
    • The Netherlands’ tax proposal could impact European market sentiment.
    • Launch of the Bitwise ETF may provide a temporary bullish counterbalance.
  • Risk Factors:
    • Continuous negative news could exacerbate selling pressure.
    • Regulatory changes in Europe could lead to broader market declines.
  • Trading Recommendation: Traders should watch for:
    • Immediate price reactions to scam news and tax proposals.
    • Buying opportunities if LUNA dips significantly due to fear, but remain cautious of overall market sentiment.
    • Monitor institutional activity around the newly launched ETF for potential bullish signals.

Conclusion

Expect LUNA to face downward pressure in the coming 24-72 hours primarily due to negative sentiment from scams and taxation discussions. The Bitwise ETF could offer some support, but the overall outlook remains bearish. Traders should prepare for volatility and consider protective measures against potential downturns.

Related News

CryptoBriefingbullish
OpenAI’s GPT-6.1 Terra ranks #14 in Code Arena WebDev with 1,671 points

OpenAI’s GPT-6.1 Terra ranks #14 in Code Arena WebDev with 1,671 points

GPT-6.1 Terra's efficiency and cost-effectiveness could democratize access to advanced coding tools, impacting developer productivity and innovation. The post OpenAI’s GPT-6.1 Terra ranks #14 in Code Arena WebDev with 1,671 points appeared first on Crypto Briefing.

Open source

CoinMonksbearish
Algorithmic Stablecoins Are Facing an Uphill Battle: Understanding the Regulatory Pushback

Algorithmic Stablecoins Are Facing an Uphill Battle: Understanding the Regulatory Pushback

Photo by Markus Spiske on UnsplashHow the TerraUSD collapse exposed the risks of algorithmic stability and why regulators are tightening the rules for stablecoins.Stablecoins offer the promise of stability in a market that often feels like a rollercoaster ride. While Bitcoin can swing wildly, a stablecoin is designed to hold a value close to a currency such as the US dollar. However, not all stablecoins are designed the same way.Fiat-backed stablecoins, such as USDC, hold...

Open source
CoinMonksneutral
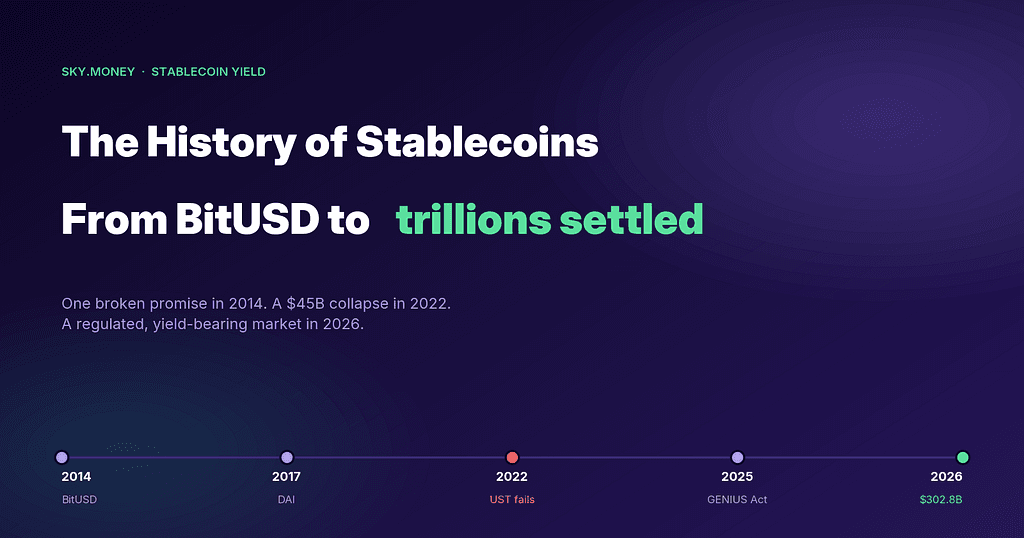
The History of Stablecoins: 12 Years, 3 Collapses, $33 Trillion Settled

The History of Stablecoins: 12 Years, 3 Collapses, $33 Trillion Settled

From one broken promise in 2014 to a governance-set savings rate in 2026. Here is what twelve years of stablecoin history teaches you about where yield actually comes from.Twelve years of stablecoin history, from BitUSD’s broken peg to a $302.8B market.On 21 July 2014, a token called BitUSD launched with a single promise. It would always be worth one dollar.It broke that promise, and it never recovered.Twelve years later, stablecoins settle roughly $33 trillion a year. The...

Open source
BitcoinEthereumNewsneutral
OpenAI GPT-6 Pricing Slashes Costs with New Sol and Luna Models

OpenAI GPT-6 Pricing Slashes Costs with New Sol and Luna Models

The post OpenAI GPT-6 Pricing Slashes Costs with New Sol and Luna Models appeared on BitcoinEthereumNews.com. OpenAI has quietly rewritten its pricing playbook for artificial intelligence models, and the numbers are hard to ignore. The company released two new additions to its GPT-6 family, GPT-6 Sol and GPT-6 Luna, cutting API costs by roughly half compared with GPT-5.6 promotional rates. The move puts OpenAI GPT-6 pricing at the center of a broader industry shake-up, one...

Open source

Tradable Markets

Browse every supported spot and perpetual market by exchange, then launch analysis immediately.

Period
Timeframe
Side

Model Rankings for LUNA

Review how LUNA performs across models under the current filter.

No trading data available for LUNA

Why use this Terra page

See how AI models perform on Terra, compare live markets by exchange, and choose the exact pair you want to open.

Use this page when you want to move from asset-level ranking into a specific live market.

Related Assets

Continue into other closely watched asset pages.

Related research

More in Crypto cycles

FAQ

Where do the LUNA pairs come from?

They are the live LUNA markets currently available across supported exchanges. Use them to compare spot and perpetual choices, then open the market you actually want to analyze.

What happens after I press start analysis?

You will open Live with the selected market already filled in, and analysis will begin automatically. That lets you move straight from this page into the market you want to review.

Is the best LUNA model always the best pair to trade?

Not always. A strong model on LUNA does not mean every exchange and contract type behaves the same way, so this page shows both the overall model ranking and the specific markets you can open.



