
AI Crypto Asset Analysis
Pudgy Penguins
PENGU
PENGU is the official coin of Pudgy Penguins.
Market Rank #131Category Other
PENGU
PENGU is the official coin of Pudgy Penguins.
Choose an exchange-specific pair and open Live with analysis auto-started for that market.

Binance
Avg Win Rate
0.0%
Best Timeframe
15m
The selected pair shows the latest fundamental and news analysis, together with analyzed time.
Analyzed
Neutral with a modest bearish lean. Price is stabilizing after decline but remains below multiple EMAs and has not cleared resistance around 0.0079-0.0081.
Current price: 0.007772
Overall bias: Neutral, with a modest bearish lean
24-hour view: Price is attempting to stabilize after a broader decline, but has not yet cleared nearby resistance.
Confidence score: 44/100 — this reflects a cautious, slightly bearish directional assessment, not a probability of a particular price target.
24-hour interpretation: The bounce is real but modest. Unless buyers reclaim resistance around 0.0079–0.0081, the move is better described as a recovery attempt within a weak, range-bound structure rather than a confirmed bullish reversal.
Levels below are approximate zones, not precise turning points.
Support
Resistance
PENGU is the Pudgy Penguins ecosystem token on Solana, but the supplied information contains no project-specific catalyst, token-unlock schedule, demand data, or news event that can be assessed for this 24-hour window. The circulating supply is 62,860,396,090 against a maximum supply of 88,888,888,888, so supply dynamics are relevant context, but these figures alone do not establish immediate selling pressure.
Fundamental weight for the next 24 hours: Low / backdrop. No earnings, guidance, funding event, or other time-specific catalyst is provided. For this horizon, price action, liquidity, and positioning are more relevant.
Bias: Neutral with a modest bearish lean.
The positive hourly and 4-hour changes, neutral RSI, and price near the 20-day and 200-day averages suggest potential for continued stabilization. However, the 7-day decline and overhead resistance from the 26-day and 50-day averages argue against a confident bullish call. Meanwhile, increased open interest and short-leaning trader ratios make a sharp move possible, but do not determine its direction.
This is a short-horizon market assessment, not a guarantee or personalized investment advice.
Analyzed
Slightly negative macro tilt from rates and energy concerns is only partially offset by a weak institutional adoption narrative, producing a low-impact net bearish bias for PENGUUSDT over the next 24 hours.
Overall bias: Neutral to slightly bearish. The news is broad crypto-market coverage, not news specific to Pudgy Penguins or PENGU. Most items are low-value and unlikely to move PENGUUSDT on their own. The main near-term risk is a broader risk-off reaction to higher energy costs and interest-rate concerns; a positive counterweight is the report of Google developing crypto custody for banks, which may support confidence in institutional adoption but does not directly benefit PENGU.
Net effect: Slightly negative macro tilt, offset by a weakly positive adoption narrative. The likely impact is small unless broader markets react strongly to rates, energy prices, or geopolitical headlines.
The Polymarket listing shows 50% / 50%, but has $0 liquidity and $0 24-hour volume. It is therefore not a reliable measure of market confidence or a useful short-term PENGUUSDT signal. It concerns Pudgy Penguins’ NFT floor price, not the token’s immediate trading price.
Market data is mixed: PENGUUSDT is at $0.007772, up 0.39% over 24 hours and 1.17% over 4 hours, but down 1.03% over 7 days. Volume is 1.50x its seven-day daily average, suggesting elevated activity. Open interest is up 3.66%, while top-trader long/short ratios are below 1 (0.68 by accounts; 0.79 by positions), indicating those groups are net short. Funding is slightly positive at +0.0022% per 8 hours, so positioning is not uniformly bearish. Taken together, this is a contested market rather than a strong directional setup.
These reference levels are drawn from the supplied 24-hour range and anchored to the current price of $0.007772. No PENGU-specific event or scheduled catalyst inside the next 24 hours was provided.

Google Gemini AI Predicts a Pudgy Penguins (PENGU) Takeover
Google Gemini AI predicts something potentially huge for Pudgy Penguins (PENGU). This is not a conventional bullish forecast. It is an intentionally extreme, over-the-top scenario built around a hypothetical landmark catalyst that isn’t completely impossible, but remains highly unlikely. The prediction centers on Pudgy Penguins securing a landmark multi-year partnership with a major global entertainment and consumer-brand conglomerate, elevating the Penguins IP to a mainst...
Open source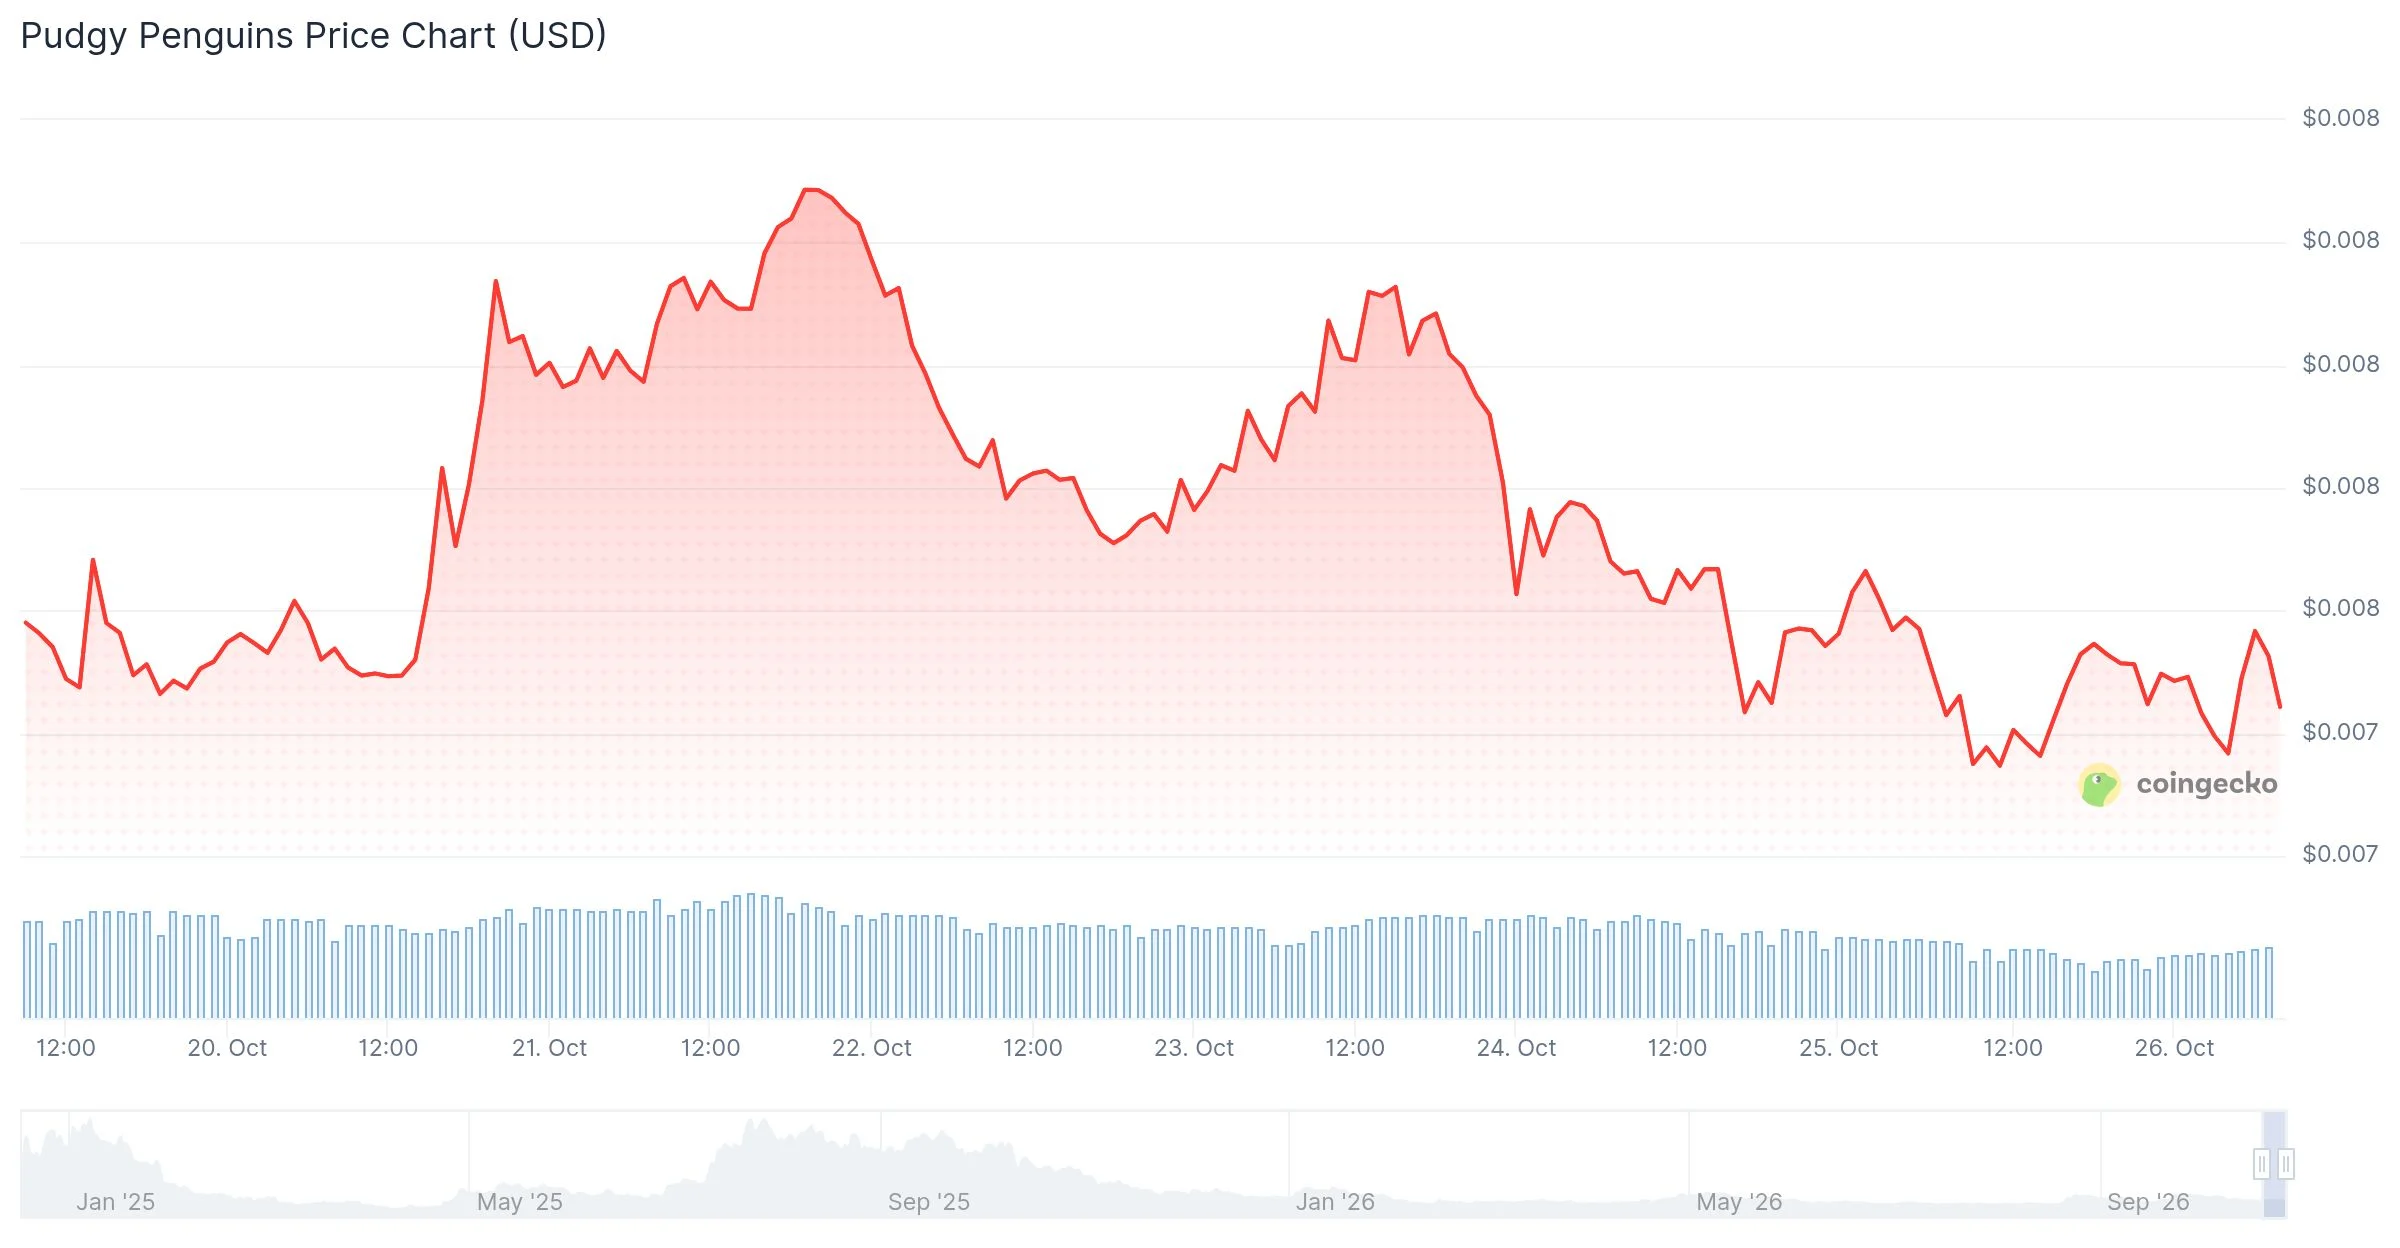
Pudgy Penguins Price Prediction 2027: Can PENGU Reach $0.03 Next Year?
TLDR Pudgy Penguins (PENGU) trades near $0.00744 on October 26 after another rejection from the $0.010–$0.011 region. The daily chart shows PENGU testing the lower edge of an ascending channel that has held since August. The RSI sits at 39.48 and the MACD remains negative, so sellers hold short-term momentum. SoFi listed PENGU on October 21, giving its US customers access to the token. Analyst Ali Martinez flagged a TD Sequential buy signal that points to a possible move...
Open source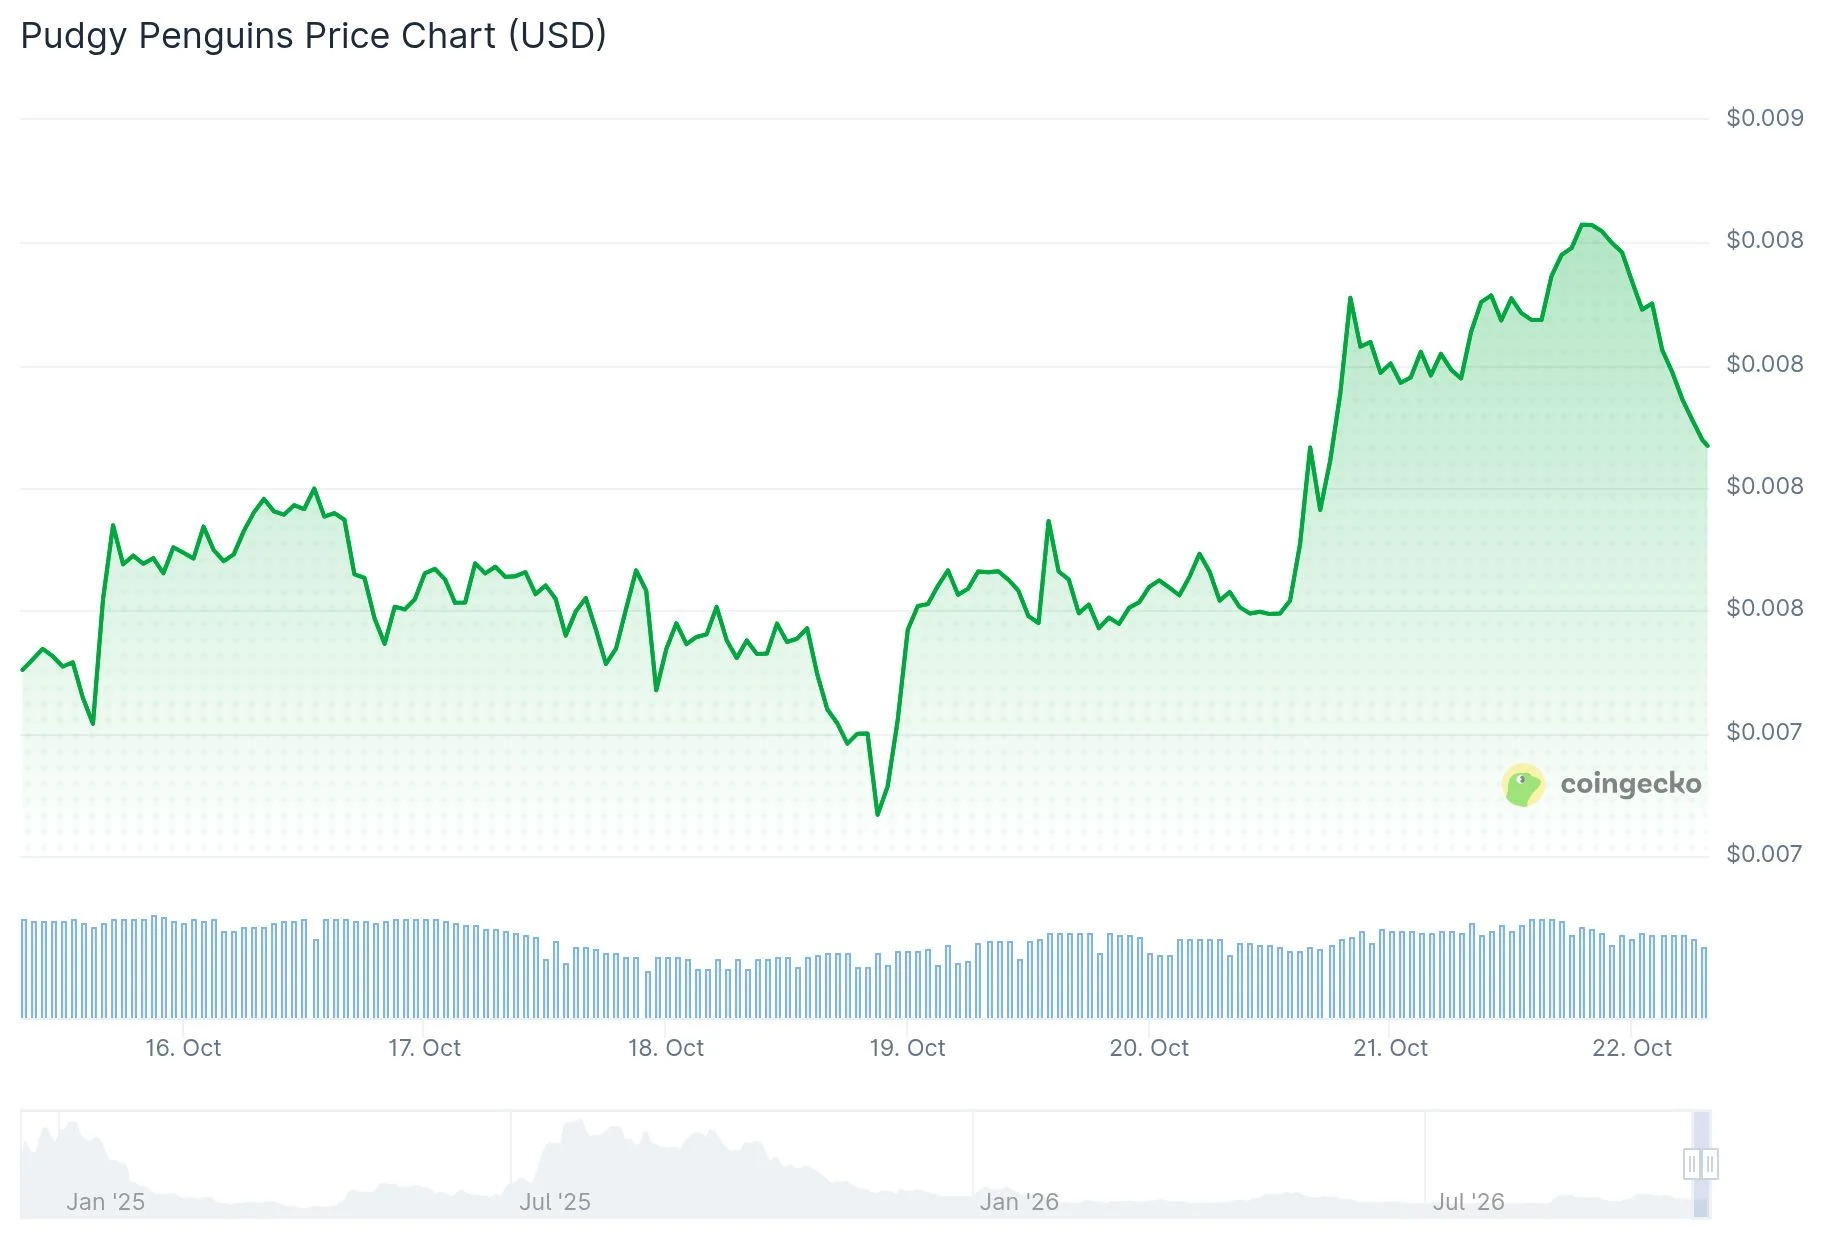
Pudgy Penguins (PENGU) Price: Can SoFi’s 15 Million Users Help PENGU Hold the Line?
TLDR PENGU trades near $0.00784, down about 3.4% on the day, close to the lower edge of a rising channel. SoFi now lets its 15 million-plus members buy, sell and hold PENGU in its app. Key support sits at $0.0074-$0.0077, with resistance at $0.0085-$0.0090. Pudgy Penguins NFT sales rose 77% week over week to about $2.56 million. Igloo will shut down its Abstract Layer 2 network on Dec. 15 to focus on Pudgy Penguins and PENGU. Pudgy Penguins (PENGU) is trading around $0....
Open sourcePudgy Penguins price prediction – Why PENGU’s 9% rally faces THIS crucial test
PENGU’s rebound faces a critical test as buyers attempt to reverse the downtrend and sustain renewed market interest.
Open sourceBrowse every supported spot and perpetual market by exchange, then launch analysis immediately.
Review how PENGU performs across models under the current filter.
No trading data available for PENGU
See how AI models perform on Pudgy Penguins, compare live markets by exchange, and choose the exact pair you want to open.
Use this page when you want to move from asset-level ranking into a specific live market.
Continue into other closely watched asset pages.
They are the live PENGU markets currently available across supported exchanges. Use them to compare spot and perpetual choices, then open the market you actually want to analyze.
You will open Live with the selected market already filled in, and analysis will begin automatically. That lets you move straight from this page into the market you want to review.
Not always. A strong model on PENGU does not mean every exchange and contract type behaves the same way, so this page shows both the overall model ranking and the specific markets you can open.



