
AI Crypto Asset Analysis
Pump.fun
PUMP
Market Rank #86Category DeFi
PUMP
Choose an exchange-specific pair and open Live with analysis auto-started for that market.

OKX
Avg Win Rate
0.0%
Best Timeframe
15m
The selected pair shows the latest fundamental and news analysis, together with analyzed time.
Analyzed
Bearish bias with lower highs and lower lows, price below all major EMAs and SMAs, and negative MACD. Immediate support near current price limits short-term conviction; stance is wait/no trade with only 32/100 confidence.
Data timestamp: 2026-11-03 04:24 UTC
Current price: 0.00393
Analysis horizon: Next 24 hours
Trade stance: Wait / NO_TRADE
Directional bias: Bearish, with a possibility of a short-term technical bounce
Confidence score: 32/100
A score below 50 reflects a bearish-to-neutral outlook; it is not a direct recommendation to short spot.
PUMP has weakened materially over the recent sessions:
The daily candles show a clear deterioration from the recent local high near 0.005225 to the current 0.00393. Price has formed lower highs and lower lows since that peak.
The technical indicators confirm the negative trend:
The MACD remains below its signal line, indicating bearish momentum. The current price is also below the middle Bollinger Band at 0.004349, which reinforces the short-term downside structure.
The RSI is 38.9, which is weak but not yet deeply oversold. This is important for the next 24 hours:
The ATR is 0.0003697, approximately 9.4% of the current price. This is substantial volatility for a 24-hour trading window. A move of roughly one ATR could place price near:
These are not guaranteed targets, but they show that risk is elevated and that tight stops may be vulnerable.
This is the most important current support zone:
Price is currently trading close to the bottom of the recent 24-hour range. Because it is only at approximately 15% of the 24-hour range, selling pressure has already pushed price near the session low.
A sustained break below 0.003879 would be technically negative and could expose the next downside areas.
The recent daily low near 0.003765 is the next meaningful historical support. A clean break below this level would confirm that the current decline is extending beyond the latest range.
Using the recent structure and the daily ATR, this is a reasonable downside projection zone if support at 0.003765 fails. It should be treated as a risk zone rather than a precise target.
This area includes:
A rebound that fails below this zone would likely remain a corrective bounce within a bearish trend.
This zone contains several recent highs and closes:
A recovery above 0.00422 would improve the short-term structure, but it would not yet fully reverse the broader bearish trend.
This is a major technical barrier:
Price would need to reclaim this zone to demonstrate meaningful short-term trend repair.
This area includes:
A move above this region would materially weaken the bearish thesis and indicate that the recent decline may have ended.
The structure is currently bearish:
The market is therefore positioned at a decision point. Support is nearby, but the trend has not shown a confirmed reversal.
24-hour volume is 1.07x the 7-day daily average, while the latest daily volume is below the 20-day average:
This suggests that the recent decline has not been accompanied by an extreme capitulation volume spike. That slightly reduces the probability of a fully exhausted selloff, although volume remains sufficient to confirm active participation.
The derivatives data is mixed but leans cautiously bearish:
The shift from positive average funding to slightly negative current funding indicates that bullish positioning has cooled and some traders may be positioned short. However, the negative funding is not extreme.
The decline in open interest alongside the price decline suggests deleveraging or position closure rather than aggressive new short buildup. This can be interpreted in two ways:
The top-trader account ratio of 0.53 is bearish, while the position ratio of 0.87 is only mildly bearish. This indicates that sentiment is cautious rather than decisively one-sided.
PUMP is a Solana-based token associated with Pump.fun and has a market-cap rank of 86. Its circulating supply is approximately 590 billion, compared with a maximum supply of 1 trillion.
The difference between circulating and maximum supply represents potential future dilution. Without specific unlock schedules, distribution details, revenue data, or current protocol metrics, the fundamental valuation picture cannot be assessed with high confidence.
For the next 24 hours, fundamentals are a backdrop rather than the primary driver, because no earnings, guidance event, funding extreme, or scheduled catalyst has been provided within this window. Price action, liquidity, market-wide crypto sentiment, and positioning are likely to dominate.
This becomes more likely if:
Potential downside areas:
A short-term bounce is possible because:
For a rebound to become credible, price should first reclaim:
A bounce that fails below 0.00412 would likely be a temporary relief rally rather than a trend reversal.
A more durable reversal would require:
This scenario is not currently confirmed.
The evidence favors a bearish directional bias over the next 24 hours:
However, immediate shorting at 0.00393 is not especially attractive because price is already near strong support at 0.003879, and a relief bounce could occur from this area. The mildly negative funding and falling open interest also suggest that the market may be partially deleveraged.
Therefore, the best risk-adjusted stance for the next 24 hours is wait / no trade, unless price provides confirmation.
A break below 0.003879 would strengthen the bearish case. Conversely, reclaiming 0.00422, and especially 0.00435, would reduce bearish confidence and signal that a short-term recovery may be developing.
Analyzed
Bearish net pressure from fragile BTC recovery, security warnings, and declining stablecoin liquidity keeps downside risk elevated for PUMP over the next 24 hours with limited evidence of near-term reversal.
Overall bias: Bearish, with limited near-term upside evidence. PUMP is at $0.00393, down 5.64% over 24 hours and trading near the bottom of its $0.003879–$0.004223 range. The recent news and derivatives data favor continued caution, although a sharp rebound in Bitcoin could provide relief.
The price is only about 15% above the 24-hour low, while 24-hour volume is 1.07 times its seven-day daily average. That combination points to active trading near the low, but does not by itself confirm a reversal. Open interest is down 2.10%, and funding has turned slightly negative at -0.0018% per 8 hours versus a seven-day average of +0.0072%. Together, these suggest reduced or more cautious leveraged positioning—not a strong basis for assuming a squeeze upward. Top-trader ratios are also below one: 0.53 by account and 0.87 by position, indicating a short-leaning tilt.
The displayed markets offer little reliable short-term direction. The ANSEM-versus-PUMP market shows 95.0% on one outcome, but has only $4,444 liquidity and no 24-hour volume; it is a relative-ranking question, not a direct price forecast. The major-CEX listing market shows 79.0% on one outcome, but liquidity is just $4 and volume is zero. Revenue and graduation markets are near 50/50, with no liquidity or volume. Treat these as weak, low-confidence signals rather than actionable evidence of near-term buying demand.
Net impact: Bearish-to-neutral for the next 24 hours, with downside risk elevated while PUMP remains near its daily low and broader liquidity and security concerns persist.
Key near-term catalyst: Whether Bitcoin stabilizes after the security-related selloff. No specific scheduled event inside the next 24 hours is identified in the supplied information.

Bitcoin Tests $78K After Binance Hack Selloff as NEAR Drops 6%
TL;DR Bitcoin recovered above $78,000 after falling to a six-week low near $76,100 following the Binance security incident, but a later CoinMarketCap reading put BTC back near $77,759. NEAR led notable altcoin losses with a 6.3% decline to $4.13, while HYPE, BCH and several other large- and mid-cap tokens also traded lower. The market remained relatively calm on Monday, leaving Bitcoin’s weekend rebound incomplete and the $78,000 area unconfirmed as technical support. B...
Open sourcePump.fun стартира конкурс за създатели награди от 100 000 долара
Pump.fun премахва 4x Boost за препоръки, намалява дела на създателите до 37,5% от таксите на платформата Pump.fun прекрати временната си 4x промоция за препоръки, намалявайки дела, изплащан на препоръчителите, от 100% на 37,5% от таксите на платформата, генерирани от търговците, които те привличат. Промяната влезе в сила на 1 ноември и означава, че създателите на съдържание вече ще получават 62,5% по-малко приходи от препоръки от същия обем допустими такси в сравнение с ув...
Open source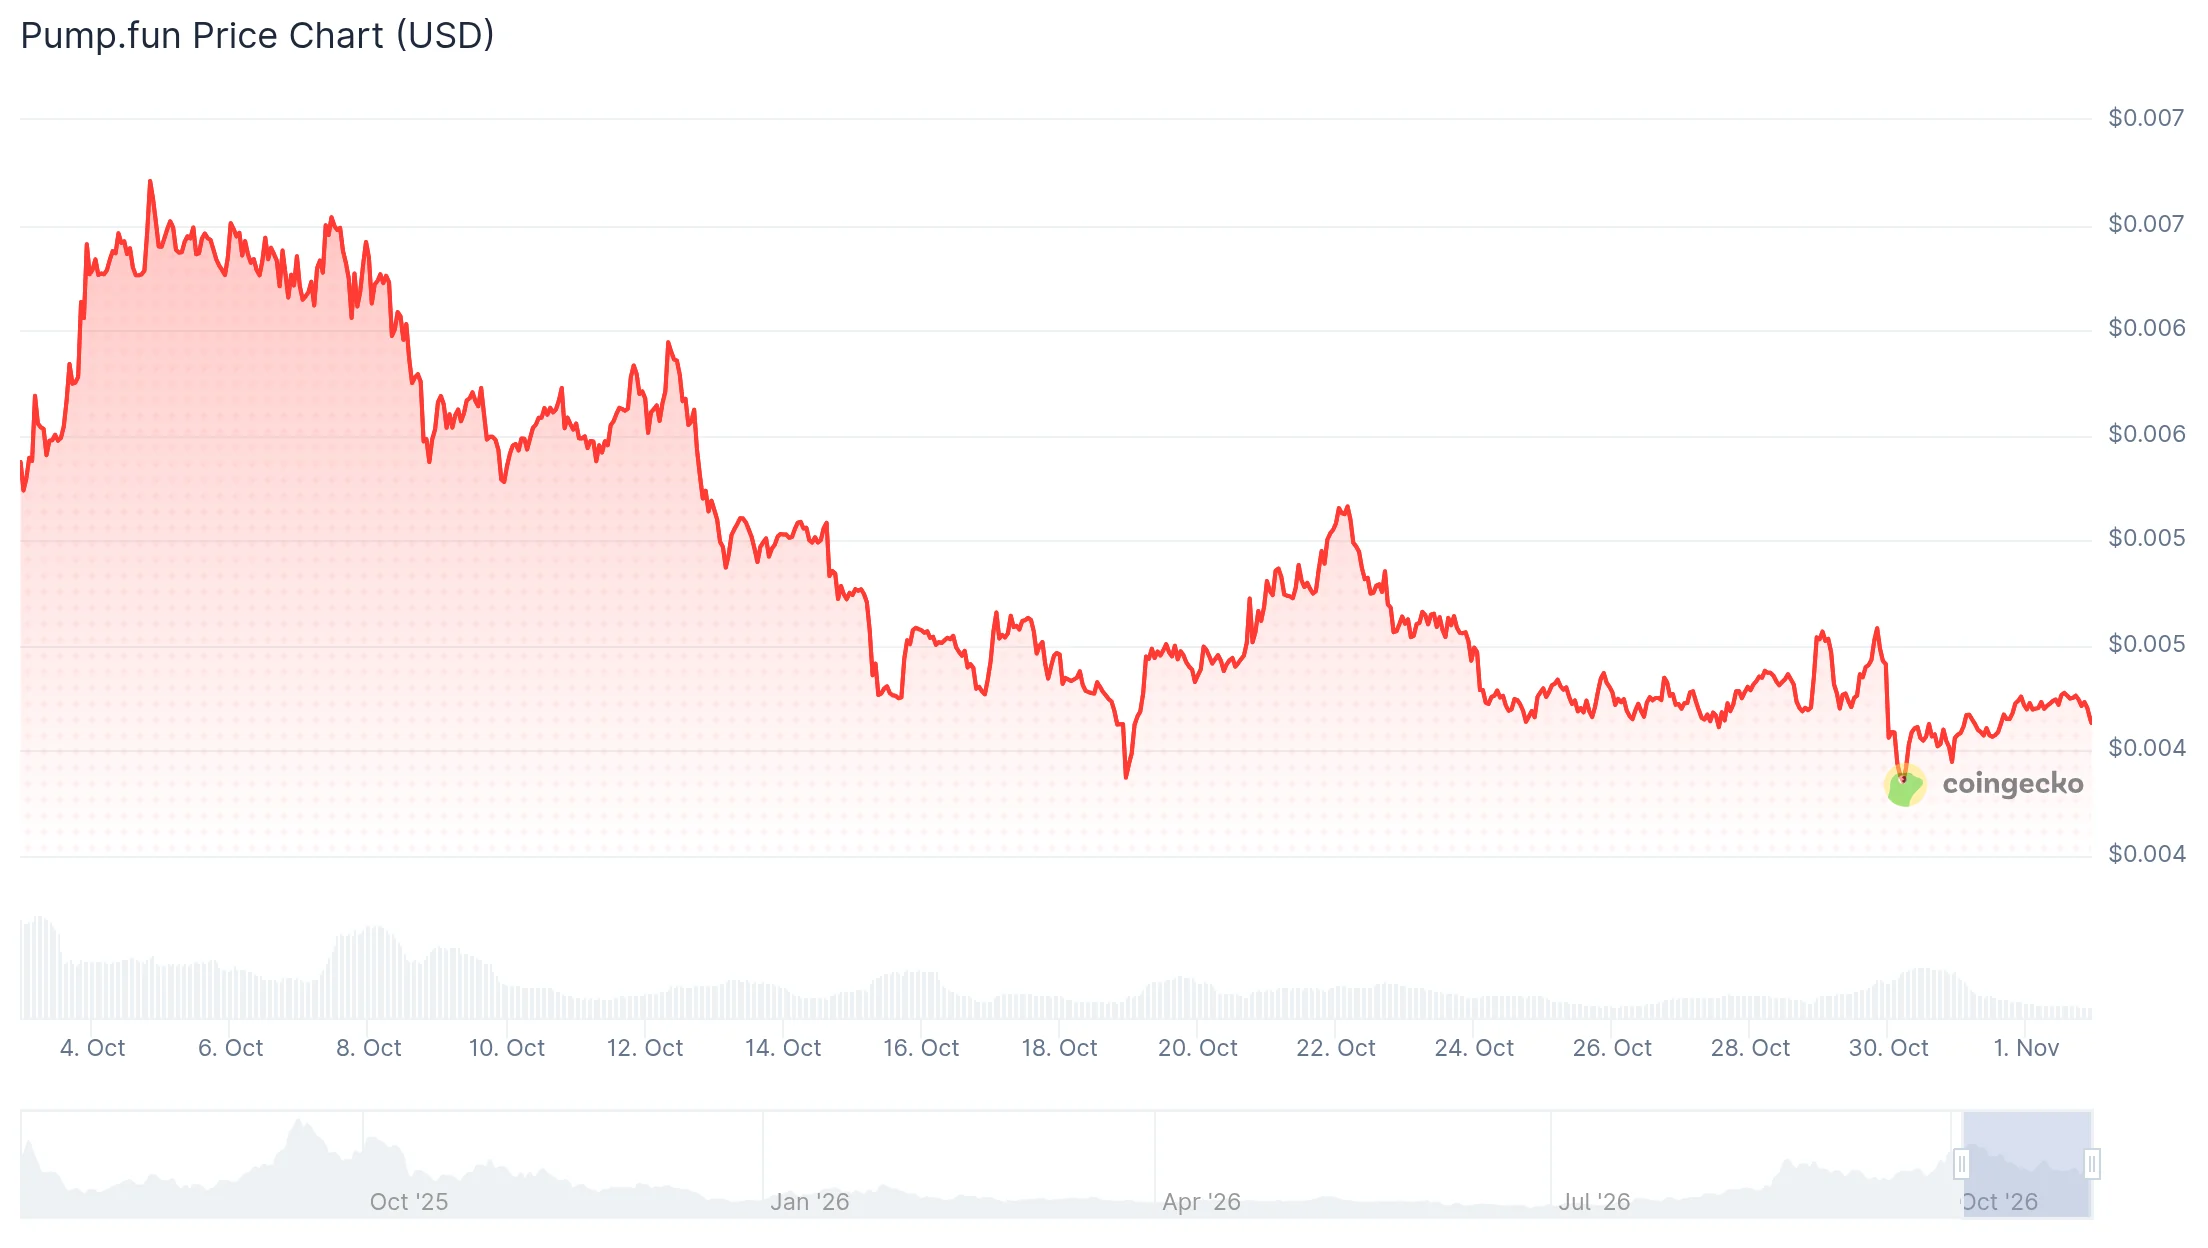
Pump.fun Token Count Raises Questions After 30% PUMP Price Drop
TLDR: Pump.fun faces scrutiny over a reported 312 tokens currently above $100,000. The tally covered 24.4 million launches on the platform. The reported count measures current valuations. It leaves unclear how many launched tokens previously crossed $100,000 before losing value. PUMP fell nearly 30% in October. The memecoin market lost 15% of its capitalization, shedding more than $5 billion. Pump.fun earns protocol fees from trading activity. Its revenue depends on tur...
Open source
Pump.fun Cuts Referral Share to 37.5% as 4x Boost Ends
Creators will earn 62.5% less from the same referral fees, while the platform says it will keep distributing all app revenue through rewards.... Read the full story at The Defiant
Open sourceBrowse every supported spot and perpetual market by exchange, then launch analysis immediately.
Review how PUMP performs across models under the current filter.
No trading data available for PUMP
See how AI models perform on Pump.fun, compare live markets by exchange, and choose the exact pair you want to open.
Use this page when you want to move from asset-level ranking into a specific live market.
Continue into other closely watched asset pages.
They are the live PUMP markets currently available across supported exchanges. Use them to compare spot and perpetual choices, then open the market you actually want to analyze.
You will open Live with the selected market already filled in, and analysis will begin automatically. That lets you move straight from this page into the market you want to review.
Not always. A strong model on PUMP does not mean every exchange and contract type behaves the same way, so this page shows both the overall model ranking and the specific markets you can open.