Back to Leaderboard
Sky
AI Crypto Asset Analysis

Sky

SKY

SKY is a governance token, which is like a digital voting share, for Sky Protocol. This system launched in 2024 as a rebrand and upgrade of the older Maker Protocol. Sky Protocol’s main value lies in giving users a simple, secure way to trade, save, and earn rewards without ever giving up control of their funds. It is built around a stablecoin called USDS, which is always worth one US dollar, but it is completely decentralized.

Market Rank #75Category DeFi

Quick Start

Choose an exchange-specific pair and open Live with analysis auto-started for that market.

Avg Win Rate

-

Best Timeframe

-

Analysis for SKY/USD

The selected pair shows the latest fundamental and news analysis, together with analyzed time.

Fundamental Analysis

Last analyzed

This analysis is more than 14 days old. Its levels and news may no longer apply; start a live analysis for a current read.

The overall trend for SKY/USD is bearish, with a high probability of a short-term bounce due to oversold conditions. However, the longer-term trend remains bearish.

SKY/USD Comprehensive Technical Analysis

1. Trend Analysis

Multi-Timeframe Trend Assessment

Daily (1D) - Primary Trend: The daily chart reveals a volatile but ultimately bearish-to-neutral structure over the past 21 days. Price opened the period around $0.0714, rallied significantly to a high of ~$0.0853 (around March 11-12), and has since sold off aggressively back to the current $0.0710 level. This creates a classic "pump and dump" or "distribution" pattern.

  • Daily RSI: 38.84 — Below the 50 midline, indicating bearish momentum but not yet oversold (30). Room to fall further.
  • Daily MACD: Histogram at -0.0007 — Strongly negative, with the MACD line (0.0007) well below the signal line (0.0014). This confirms accelerating bearish momentum on the daily timeframe.
  • Price vs. SMAs: Current price ($0.0710) is sitting at/near the SMA 50 ($0.07) and SMA 200 ($0.06), but below the SMA 20 ($0.07) and BB middle ($0.07). The price is near the lower Bollinger Band ($0.07), suggesting it's at the lower end of its recent range.

4-Hour Trend:

  • RSI: 45.36 — Slightly below neutral, confirming mild bearish pressure.
  • MACD histogram: 0.0 (flat) — The bearish momentum is decelerating on this timeframe, with MACD line (-0.0004) slightly above signal (-0.0005). This hints at potential stabilization.
  • Price dropped from ~$0.0799 high to current $0.0710, a decline of approximately 11% over 3-4 days.
  • Volume on the current 4H bar (339K) is dramatically below the 20-period SMA (2.71M), indicating very low participation — either exhaustion of sellers or lack of buyer interest.

1-Hour Trend:

  • RSI: 46.56 — Neutral territory.
  • MACD histogram: -0.0001 — Mildly bearish, with the MACD crossing below signal recently.
  • Price made a local high at ~$0.0729 (around hour 18-19 of the dataset) and has since declined to $0.0710. This constitutes a short-term downtrend within the 1H timeframe.
  • Volume (143K) is well below the 20-period SMA (417K) — declining volume on the decline, which can sometimes signal selling exhaustion.

15-Minute Trend:

  • RSI: 56.75 — Slightly bullish on the very short term, suggesting a minor bounce attempt.
  • MACD histogram turned slightly positive (0.0), indicating the very near-term selling pressure may be easing.

5-Minute / 1-Minute:

  • 5m RSI: 12.73 — Extremely oversold. This is a strong signal of short-term oversold conditions.
  • 1m RSI: 21.74 — Also deeply oversold.
  • These micro-timeframe readings suggest a short-term bounce is likely imminent, but this doesn't change the larger picture.

Trend Summary:

TimeframeTrendStrength
DailyBearishModerate
4-HourBearish (decelerating)Moderate
1-HourBearishMild
15-MinNeutral/Slight bounceWeak
5-MinOversold bounce setupStrong (short-term)

Overall Trend: Bearish across higher timeframes, with short-term oversold conditions suggesting a potential relief bounce.


2. Key Support and Resistance Levels

Resistance Levels:

  1. $0.0716 - $0.0720 — Immediate resistance. This was the recent 15m consolidation zone and the 1H SMA area. Price needs to reclaim this to show any short-term strength.
  2. $0.0729 - $0.0735 — The recent 1H swing high and the daily SMA 20 area. This is a critical level — a break above would suggest the daily downtrend is pausing.
  3. $0.0756 - $0.0760 — The 4H breakdown level from March 21. This acted as support before breaking down and would now serve as strong resistance.
  4. $0.0799 - $0.0810 — The major swing high from the recent rally. Unlikely to be tested in the near term given current momentum.
  5. $0.0853 — The absolute high of the period. Major resistance.

Support Levels:

  1. $0.0710 - $0.0705 — Current price zone and the most recent 4H candle lows. Immediate support being tested NOW.
  2. $0.0700 — Psychological round number support. Extremely important.
  3. $0.0662 - $0.0682 — The swing low from the daily candle on ~March 22 ($0.0662 low, $0.0682 close area). This is the critical support — if broken, it opens significant downside.
  4. $0.0700 area — The SMA 200 on the daily sits at $0.06, providing a longer-term floor, but there's a gap between current support and this level.

Key Price Zones:

$0.0853 ████████████████████████████ Major Resistance (Period High)
$0.0800 ██████████████████████ Strong Resistance
$0.0756 ████████████████ Breakdown Resistance
$0.0730 ████████████ Near-term Resistance / SMA 20
$0.0716 ████████ Immediate Resistance
$0.0710 ◄────── CURRENT PRICE
$0.0700 ████████ Psychological Support
$0.0662 ████████████████ Critical Support (Recent Low)
$0.0600 ████████████████████████████ SMA 200 / Major Support

3. Market Structure and Sentiment

Market Structure:

Lower Highs, Lower Lows on Daily: The daily chart shows:

  • High ~$0.0853 → Lower high ~$0.0810 → Lower high ~$0.0799 → Lower high ~$0.0761
  • Low ~$0.0694 → Recovery → Now approaching $0.0700 again

This is a bearish market structure with a series of lower highs. The critical question is whether the $0.0662-$0.0700 support zone holds.

Volume Analysis:

  • Declining volume across all timeframes. The current 1D volume (9.03M) is less than half the 20-period SMA (19.64M). The 4H volume (339K) is only ~12.5% of its 20-period SMA (2.71M). The 1H volume (143K) is ~34% of its SMA.
  • This declining volume during the selloff is somewhat bullish — it suggests sellers are running out of steam rather than aggressive distribution. However, it also means buyers aren't stepping in with conviction.
  • The massive volume spikes occurred during the rally phase ($0.07 → $0.085) and the initial selloff, suggesting the "smart money" activity has already occurred.

Bollinger Band Analysis:

  • Daily: Price is near the lower BB ($0.07), suggesting it's at the lower end of the statistical range. Mean reversion could pull it back toward the middle band ($0.07).
  • 4H: BB upper at $0.08, middle at $0.07, lower at $0.07. Price is near the lower band — oversold on this timeframe.
  • 1H: Price is within the bands but trending toward the lower band.

Sentiment Indicators:

  • RSI Divergence Check: The daily RSI at 38.84 is approaching oversold but hasn't reached the extreme 30 level yet. There's still room for further decline before a technical oversold bounce.
  • MACD Bearish Cross on Daily: The negative histogram (-0.0007) is widening, which is a bearish signal. Until this starts to narrow, the daily trend remains bearish.
  • ATR Analysis: Daily ATR is 0.0058 (~8.2% of price), indicating high volatility relative to the price. The 4H ATR of 0.0021 (~3%) suggests significant intra-day swings are normal.

Fundamental Context:

  • SKY (formerly MakerDAO) is a well-established DeFi governance token ranked #75 by market cap.
  • Circulating supply is ~97.7% of max supply, meaning minimal dilution risk.
  • Being on Ethereum and listed on Coinbase provides solid liquidity and legitimacy.
  • The rebrand from MKR to SKY in 2024 was a significant event; the token is still finding its post-rebrand equilibrium.
  • DeFi sector sentiment is crucial — if broader DeFi tokens are under pressure, SKY will follow.

4. Overall Directional Bias

Bearish with Caution — Potential Near-Term Bounce

Primary Bias: BEARISH (Short to Medium Term)

Reasoning:

  1. Daily structure is bearish — lower highs, bearish MACD, RSI below 50
  2. Price broke below the $0.0735 support and hasn't reclaimed it
  3. The rally from $0.07 to $0.085 has been fully retraced — this is bearish; it shows the rally was rejected
  4. MACD histogram on daily is expanding negatively — momentum is with sellers

Mitigating Factors (Why Not Aggressively Bearish):

  1. Volume is declining sharply — sellers may be exhausted
  2. 5m and 1m RSI are extremely oversold (12.73 and 21.74) — short-term bounce likely
  3. Price is near the $0.0700 psychological support — this could attract buyers
  4. 4H MACD histogram is flattening — bearish momentum decelerating on intermediate timeframe
  5. SMA 200 on daily at $0.06 provides a backstop ~15% below

Scenario Analysis:

Bull Case (30% probability):

  • Price holds $0.0700, bounces to retest $0.0730-0.0750
  • Volume picks up on the bounce, RSI recovers above 50 on daily
  • Target: $0.0750-0.0800

Base Case (45% probability):

  • Price consolidates between $0.0680-$0.0730 for several days
  • Low volume chop as the market digests the recent selloff
  • Eventually resolves lower unless broader crypto market provides a catalyst

Bear Case (25% probability):

  • Price breaks below $0.0700 and retests the $0.0662 low
  • If $0.0662 breaks, next major support is $0.0600 (SMA 200)
  • This

News Analysis

Last analyzed

This analysis is more than 14 days old. Its levels and news may no longer apply; start a live analysis for a current read.

Overall, the analysis suggests a mildly bearish outlook for SKY due to macroeconomic headwinds outweighing the positive impact of Bitcoin's rally and institutional developments.

SKY-USD Impact Analysis

Executive Summary

Overall Bias: MILDLY BEARISH with notable uncertainty

SKY (formerly MakerDAO's governance token) operates as a DeFi governance/stablecoin ecosystem token. None of these news items directly mention SKY, so we're analyzing second-order effects through macro, crypto sentiment, and ecosystem dynamics.


1. News-by-News Impact on SKY

🔴 BEARISH Factors

US PMI Reignites Stagflation Fears

  • What: Growth slowing + inflation rising = stagflation signal
  • SKY Impact: This is the most significant item. Stagflation fears hit risk assets hard. SKY, as a mid-cap DeFi token, is MORE sensitive to risk-off moves than BTC. When traders de-risk, they sell altcoins/DeFi tokens first. Additionally, stagflation fears could reduce DeFi borrowing demand, directly impacting SKY's ecosystem (DAI/USDS lending volumes).
  • Pressure: SELLING, moderate intensity, 24-72hr timeframe

Australia CPI / Hawkish RBA

  • What: Stubborn inflation → hawkish central bank
  • SKY Impact: Reinforces the global "higher for longer" rate narrative. Higher traditional yields compete directly with DeFi yields — this is a structural headwind for SKY's value proposition. Less capital flows into DeFi when risk-free rates stay elevated.
  • Pressure: Mild selling, slow-burn effect

Oil Crisis Hitting Asia

  • What: Middle East supply disruption, energy instability
  • SKY Impact: Adds to macro uncertainty and inflationary pressure. Indirectly negative for risk appetite. Asian markets are significant crypto participants — if Asian economies face energy headwinds, capital may retreat from speculative DeFi positions.
  • Pressure: Mild selling pressure

🟢 BULLISH Factors

Bitcoin Surpasses $70,000

  • What: BTC at a major psychological milestone
  • SKY Impact: This is the most important counterweight. BTC rallies historically create a "rising tide" effect. SKY benefits from: (1) increased crypto TVL as portfolio values rise, (2) more collateral deposited in MakerDAO/Sky protocol, (3) general altcoin rotation after BTC establishes new levels. However, early-stage BTC rallies often DRAIN altcoin liquidity before the rotation happens.
  • Pressure: BUYING, but potentially DELAYED by 48-96 hours

21Shares Active Crypto ETF Strategies / Stripe Tempo Launch

  • What: Institutional infrastructure expanding
  • SKY Impact: Long-term positive for DeFi legitimacy. Active ETF strategies could eventually include DeFi exposure. Stripe entering crypto payments validates stablecoin ecosystems — SKY's USDS/DAI stablecoin is a direct beneficiary of growing stablecoin adoption narratives.
  • Pressure: Mild bullish, longer-term (weeks, not days)

⚪ NEGLIGIBLE

  • Bitget/MotoGP activation: Zero SKY impact
  • Russian hacker sentenced: Zero direct impact
  • Silver bullish momentum: Marginal — precious metals rallying alongside BTC suggests broad inflation hedge demand, slightly positive
  • US-Israel peace talks: Marginal, could reduce geopolitical risk premium

2. Prediction Market Sentiment

No Polymarket data available. This itself is notable — lack of active SKY-related prediction markets suggests low speculative attention, which typically means the token moves primarily on broader market beta rather than idiosyncratic catalysts.


3. Net Impact Synthesis

FactorDirectionWeight
Stagflation fearsBearishHIGH
BTC $70K rallyBullishHIGH
Global rate hawkishnessBearishMEDIUM
Institutional crypto infraBullishLOW
Geopolitical uncertaintyBearishLOW

Net Score: SLIGHTLY BEARISH (-1 on a -5 to +5 scale)

The BTC rally and stagflation fears roughly cancel, but the stagflation narrative edges out because SKY is a DeFi-specific asset more sensitive to rate expectations and risk appetite than BTC itself.


4. Trader Recommendations

Next 24-72 Hours:

  • Watch BTC dominance: If BTC.D rises while BTC rallies, SKY will UNDERPERFORM. If BTC.D stabilizes/drops, expect rotation into DeFi tokens including SKY.
  • Key risk: If US stagflation narrative accelerates (watch for more PMI/CPI data), expect SKY to drop 3-7% even if BTC holds.
  • Entry strategy: Wait for altcoin rotation signal (BTC consolidation + declining BTC dominance). Don't chase.
  • Defensive play: SKY's stablecoin revenue model provides a floor — significant downside below protocol revenue-based valuation is limited.

Bottom line: Hold off on new SKY longs until BTC-to-altcoin rotation confirms. Current macro headwinds slightly outweigh the BTC rally tailwind for DeFi-specific assets.

Related News

PANewsbullish
收入,成了今年最硬的加密叙事

收入,成了今年最硬的加密叙事

撰文:WallStreetBets 编译:Luffy,Foresight News 2026 年是能产生收入的加密项目蓬勃发展的一年。 年初至今,我们看到各协议的合计收入达到 116.8 亿美元。如果 11 月与 12 月能做到与 10 月相近,到年底这个数字应会达到约 139 亿美元,仅比 2025 年少了不到 10 亿美元,而 2025 年的市场环境要好得多。 加密协议年度收入 我们看到的是一种由基本面驱动的趋势,尽管大盘走弱,它仍在积聚动能。每当我看到这种背离,我就想弄清它由什么驱动,更重要的是,投资机会在哪里。 在这篇文章里,我会拆解我的发现,包括: 为什么我认为加密的 「收入叙事」 仍处早期 如何评估有收入的生意,并识别有吸引力的代币机会 为什么从 Hyperliquid 到 World Liberty Financial 等主要团队都在拥抱回购 我在哪里寻找下一波跑赢市场的标的 收入叙事的基本逻辑 加密从不缺投资叙事,问题是大多数叙事都活不长。 我们看到投资者追逐过 NFT、元宇宙、SocialFi,以及一个接一个的 「公...

Open source
The Defiantneutral
Sky Advisor Proposes Halting New Core Vault Borrowing

Sky Advisor Proposes Halting New Core Vault Borrowing

BA Labs reports 771 open vaults and 376.33 million USDS in debt. Borrowers could still repay and manage collateral, but not mint more.... Read the full story at The Defiant

Open source
PANewsneutral
Anchorage Digital关联钱包近两日向Coinbase转入1亿枚ENA,价值超1500万美元

Anchorage Digital关联钱包近两日向Coinbase转入1亿枚ENA,价值超1500万美元

PANews 11月12日消息,据Arkham监测数据显示,某个与Anchorage Digital关联钱包最近两天已Coinbase转入总计1亿枚ENA,价值约合1529万美元。 此外,该钱包目前仍持有价值约1275万美元的MORPHO、价值约774万美元的SKY等其他加密资产。监测数据显示,大约八个月前Anchorage Digital标记地址向该钱包250万枚USDC,疑似用于代币购买。

Open source
CoinMonksneutral
Can an Onchain Protocol Be Investment Grade? The Question Just Got Real

Can an Onchain Protocol Be Investment Grade? The Question Just Got Real

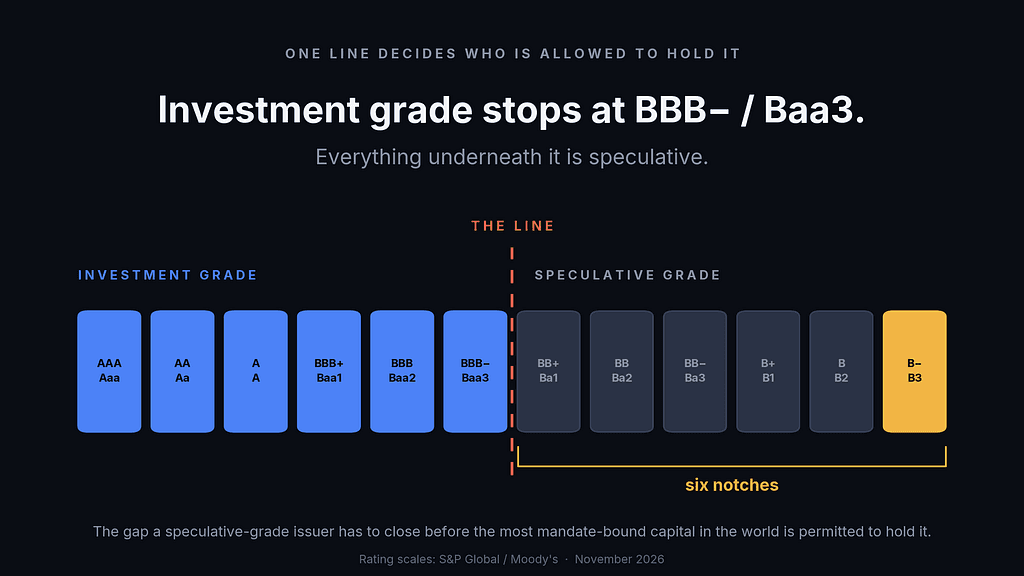
One line decides who is allowed to hold it. Everything underneath is speculative.Most arguments about trust in crypto end in a shrug.In October, one of them ended in a letter grade.On 1 October, S&P Global affirmed Sky Protocol at B−. Six days later, Moody’s assigned B3. Two agencies. Two review teams. Two methodologies. One answer.Neither grade is investment grade. Both sit six notches below the line.Read that as bad news if you like. Here is the other reading. For th...

Open source

Tradable Markets

Browse every supported spot and perpetual market by exchange, then launch analysis immediately.

Period
Timeframe
Side

Model Rankings for SKY

Review how SKY performs across models under the current filter.

No trading data available for SKY

Why use this Sky page

See how AI models perform on Sky, compare live markets by exchange, and choose the exact pair you want to open.

Use this page when you want to move from asset-level ranking into a specific live market.

Related Assets

Continue into other closely watched asset pages.

Related research

More in Crypto cycles

FAQ

Where do the SKY pairs come from?

They are the live SKY markets currently available across supported exchanges. Use them to compare spot and perpetual choices, then open the market you actually want to analyze.

What happens after I press start analysis?

You will open Live with the selected market already filled in, and analysis will begin automatically. That lets you move straight from this page into the market you want to review.

Is the best SKY model always the best pair to trade?

Not always. A strong model on SKY does not mean every exchange and contract type behaves the same way, so this page shows both the overall model ranking and the specific markets you can open.