
 By Muke
What $1,000 in Costco's 1985 IPO Became: Splits, Special Dividends and the Math
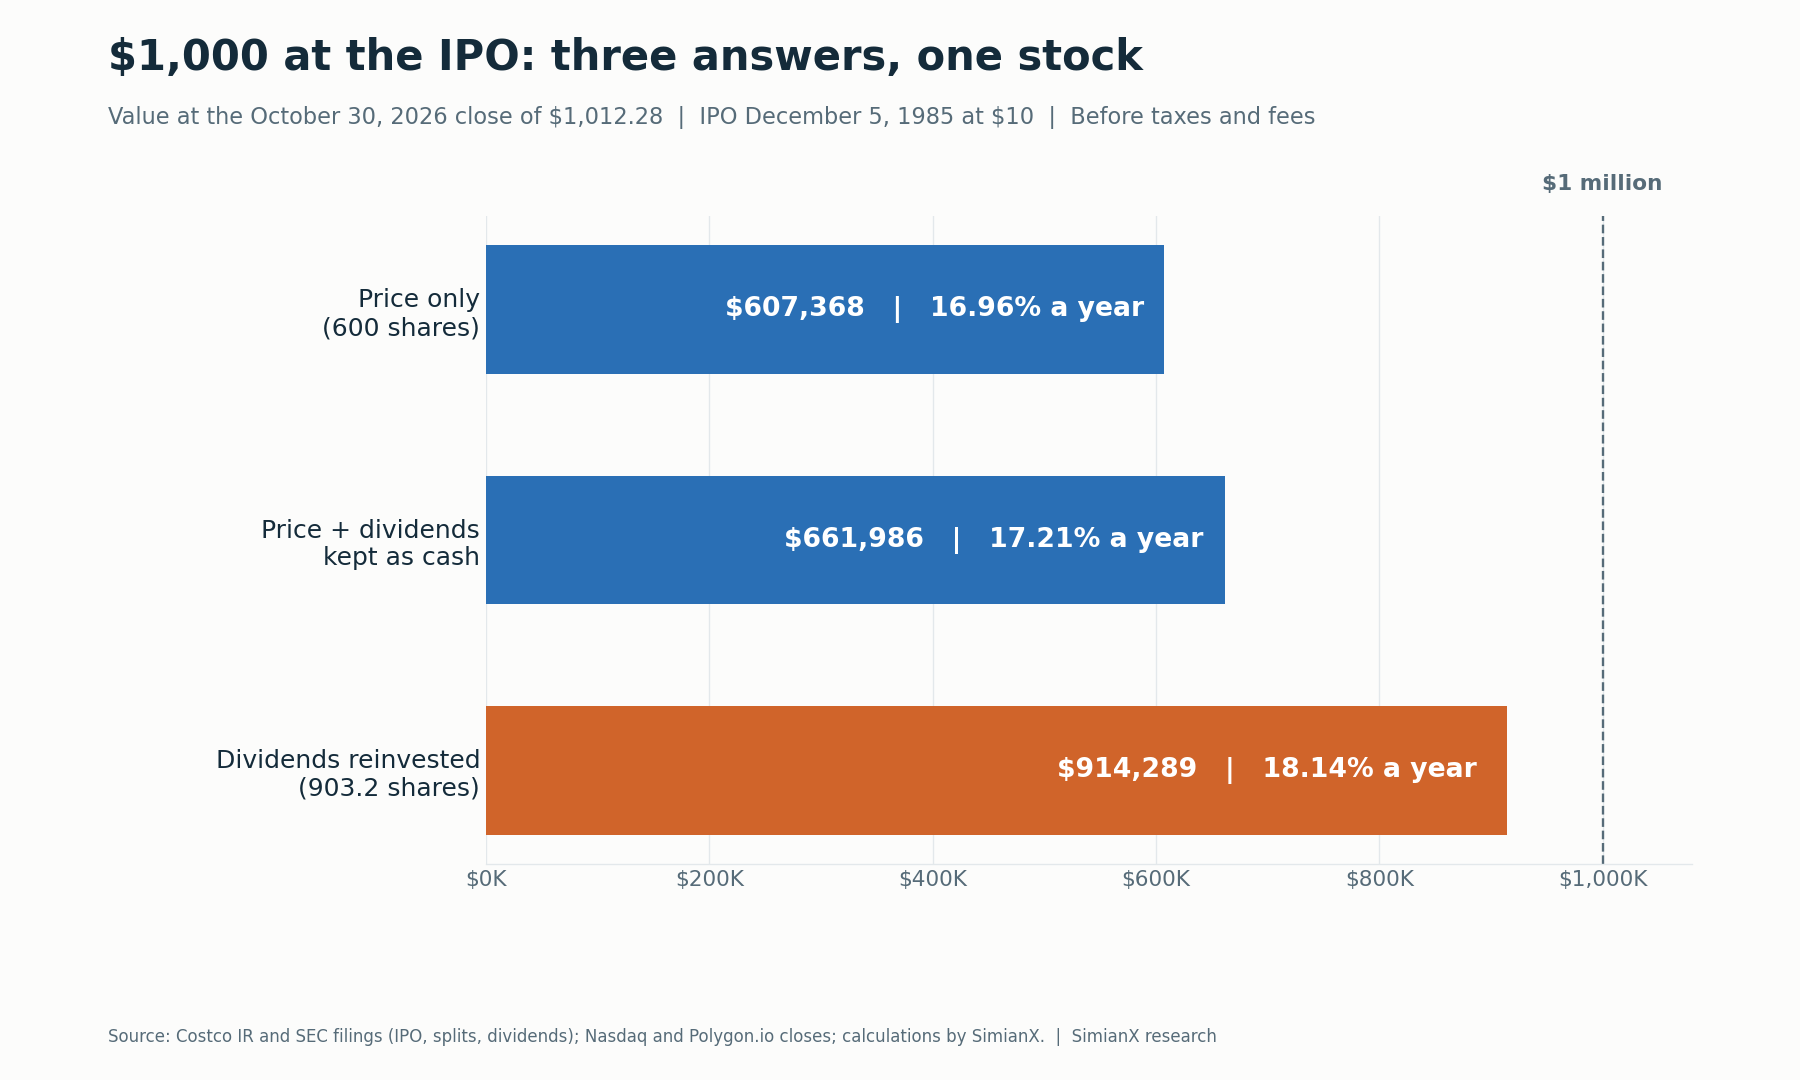
Quick answer: Costco went public on December 5, 1985, at $10 a share. At that price, $1,000 bought 100 shares, and three stock splits turned them into 600. At the October 30, 2026 close of $1,012.28, those shares were worth $607,368. Add the $54,618 in dividends as idle cash and the total is $661,986. Reinvest every dividend at the close on its ex-dividend date and the position is about 903.2 shares worth $914,289. All three figures are before taxes and fees, and all assume the buyer paid the $10 offering price.
Most answers to this question stop at the first number, or quote a total that nobody can reproduce. The gap between them is more than $300,000, and it comes down to what you assume about dividends. Costco has declared 96 dividends since 2004, and five of them were special payouts that together returned $44 a share.
This reference rebuilds all three figures from primary records. The IPO terms and split dates come from Costco's investor FAQ and split history. The merger, the 1994 exchange offer and the dividends come from SEC filings. Daily closes come from Polygon.io and were checked against Nasdaq and the price ranges in Costco's 10-K reports. Calculations are ours. Data is as of the October 30, 2026 close.
How Much Is $1,000 of Costco IPO Stock Worth Today?
The answer depends on what happened to the dividends. Each row below is a correct answer to a different question.
| What happened to the dividends | Ending value | Multiple of $1,000 | Annualized over 40.90 years |
|---|---|---|---|
| Ignored (price only, 600 shares) | $607,368 | 607.4× | 16.96% |
| Kept as cash, earning nothing | $661,986 | 662.0× | 17.21% |
| Reinvested in more shares (903.2 shares) | $914,289 | 914.3× | 18.14% |
How we calculated it:
- Start: $1,000 ÷ $10 = 100 shares on December 5, 1985. No purchases or sales after that.
- Splits: 100 × 2 × 1.5 × 2 = 600 shares.
- Price: 600 × $1,012.28 = $607,368.
- Cash dividends: $91.03 a share × 600 = $54,618. This counts the $1.47 dividend that went ex on October 30, 2026 and is payable on November 13.
- Reinvestment: each dividend buys shares at the close on its ex-dividend date, with no taxes, fees or fractional-share limits. Buying at the close on the payment date instead gives $911,368, a difference of 0.3%, so the method choice matters little.
Every $10 move in the share price changes the price-only value by $6,000 and the reinvested value by about $9,030.
Costco IPO Date, IPO Price and Stock Split History
Costco has split its stock three times, and the last split was in January 2000. Two other corporate actions sit in the same history and leave the share count unchanged for a holder who started with Costco.
| Date | Event | Ratio | Shares held |
|---|---|---|---|
| Dec 5, 1985 | IPO at $10 | n/a | 100 |
| May 15, 1991 | Stock split | 2-for-1 | 200 |
| Mar 6, 1992 | Stock split | 3-for-2 | 300 |
| Oct 21, 1993 | Merger with The Price Company | 1-for-1 for Costco holders | 300 |
| Dec 20, 1994 | Price Enterprises exchange offer | Optional, no tender | 300 |
| Jan 13, 2000 | Stock split | 2-for-1 | 600 |
The total split factor is 2 × 1.5 × 2 = 6, so the split-adjusted IPO price is $10 ÷ 6 = $1.67, the figure in Costco's FAQ. A split changes the number of shares, not the value of the holding, so all of the gain came from the share price rising after each split. Costco's table dates the last split January 13, 2000, while its fiscal 2000 10-K says the shares began trading at the post-split price on January 14.
Two Events That Are Not Splits, and the Wrong Numbers They Produce
The 1993 merger. Costco and The Price Company combined to form PriceCostco on October 21, 1993. Per the fiscal 1994 10-K, each Price share became 2.13 PriceCostco shares, and each Costco share became one. The 2.13 ratio applies only to Price Company holders, but it appears in Costco's split tables, so it is easy to misapply.
The 1994 exchange offer. PriceCostco offered one share of Price Enterprises, its spun-off real estate business, for each PriceCostco share tendered, up to 27 million shares. Costco's table lists this as "1-for-1," which looks like a split. It was optional, and a holder who tendered gave up Costco shares. About 23.2 million shares were tendered, and Price Enterprises bought the remaining 3.8 million shares from the company in February 1995, so a holder who did not tender received nothing and kept the same share count. Our figures follow that holder.
| Mistake | Shares | Price-only value |
|---|---|---|
| Correct: splits only | 600 | $607,368 |
| Applying the 2.13 merger ratio to Costco shares | 1,278 | $1,293,694 |
| Treating the 1994 exchange as a 2-for-1 split | 1,200 | $1,214,736 |
| Dividing $1,000 by the rounded $1.67 | 598.8 | $606,155 |
A stock-only figure above $1 million as of this date usually reflects one of the first two errors. A stock-only value of $1 million needs a share price of $1,666.67.
Every Costco Special Dividend
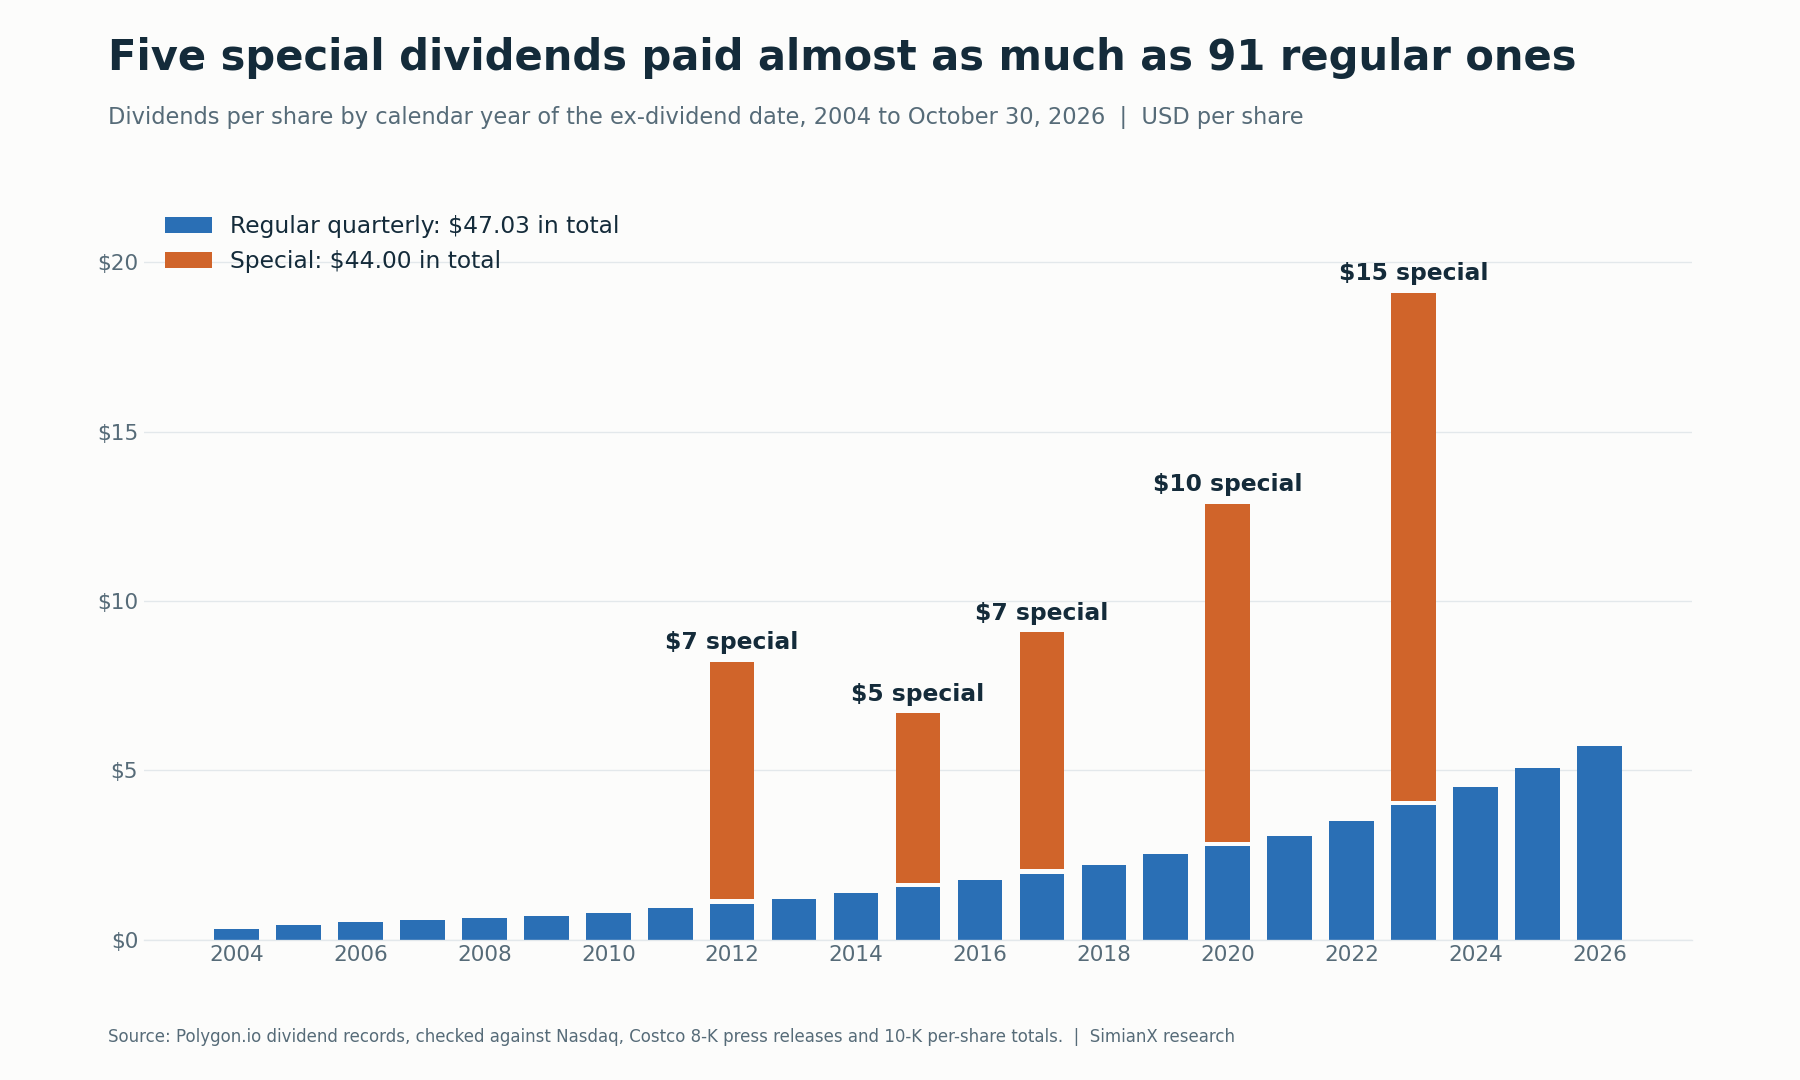
Costco paid no dividend for its first 18 years as a public company. The first quarterly dividend of $0.10 was paid on May 31, 2004. Since then there have been 91 regular dividends totaling $47.03 a share, plus five specials totaling $44.00.
| Announced | Ex-date | Paid | Per share | On 600 shares | Total payout | Stated funding |
|---|---|---|---|---|---|---|
| Nov 28, 2012 | Dec 6, 2012 | Dec 18, 2012 | $7.00 | $4,200 | ~$3.0B | Not stated |
| Jan 30, 2015 | Feb 5, 2015 | Feb 27, 2015 | $5.00 | $3,000 | ~$2.2B | Cash and new borrowing |
| Apr 25, 2017 | May 8, 2017 | May 26, 2017 | $7.00 | $4,200 | ~$3.1B | Mostly new borrowing |
| Nov 16, 2020 | Dec 1, 2020 | Dec 11, 2020 | $10.00 | $6,000 | ~$4.4B | Existing cash |
| Dec 14, 2023 | Dec 27, 2023 | Jan 12, 2024 | $15.00 | $9,000 | ~$6.7B | Not stated |
| Total | $44.00 | $26,400 | ~$19.4B |
On the IPO position, the specials alone returned 26.4 times the original $1,000 in pretax cash.
Is there a 2026 special dividend? None had been declared as of November 2, 2026. The company's 2026 dividend filings through its October 14 announcement cover only the regular quarterly payment. Past specials came 2.2 to 3.6 years apart by announcement date, and nearly three years have passed since the last one. Costco ended fiscal 2026 with $20.2 billion in cash and $6.2 billion of long-term debt, including the current portion. Those facts show capacity, not intent: the board has no fixed schedule for specials, and we do not forecast one.
The regular dividend rose from $0.10 to $1.47 a quarter, or $5.88 a year. On 600 shares that is $3,528 a year, 3.5 times the original investment. At $1,012.28, though, the stock yields only 0.58%. Today's buyer does not get that income stream.
Costco Stock Price History: The $1,000 Year by Year
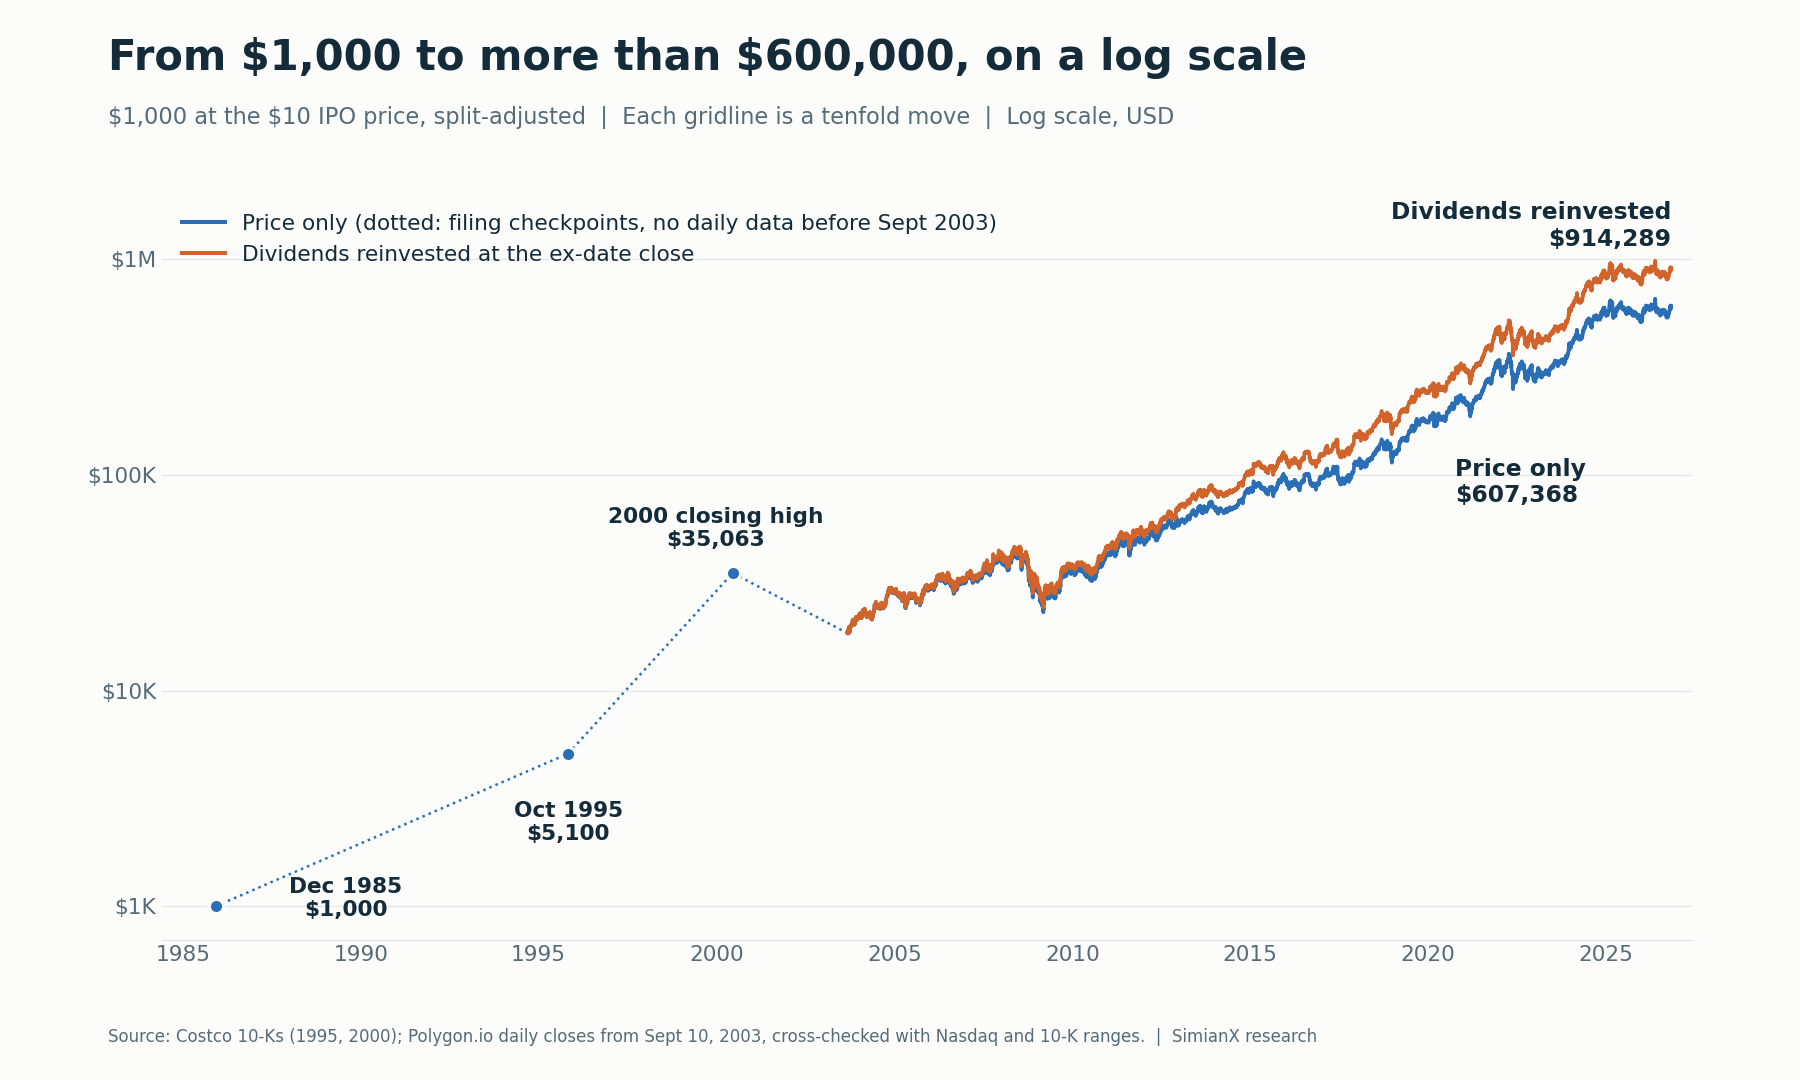
Daily data starts in September 2003. For the earlier years, Costco's filings give these checkpoints.
| Date | Share price | Shares | Value | Source |
|---|---|---|---|---|
| Dec 5, 1985 | $10.00 | 100 | $1,000 | Costco FAQ |
| Oct 31, 1995 | $17.00 | 300 | $5,100 | Fiscal 1995 10-K, last sale |
| Q2 2000 closing high | $58.44 | 600 | $35,063 | Fiscal 2000 10-K |
| Q2 2000 closing low | $30.00 | 600 | $18,000 | Fiscal 2000 10-K |
| Sep 10, 2003 | $30.71 | 600 | $18,426 | Polygon.io |
After ten years, $1,000 had become about $5,100. After nearly 18 years, it was $18,426. The compounding that makes the headline number came mostly later.
| Year-end | Close | Price-only value | Cumulative cash dividends | Value with dividends reinvested |
|---|---|---|---|---|
| 2003 | $37.21 | $22,326 | $0 | $22,326 |
| 2004 | $48.41 | $29,046 | $180 | $29,257 |
| 2005 | $49.47 | $29,682 | $447 | $30,191 |
| 2006 | $52.87 | $31,722 | $750 | $32,577 |
| 2007 | $69.76 | $41,856 | $1,089 | $43,397 |
| 2008 | $52.50 | $31,500 | $1,464 | $32,990 |
| 2009 | $59.17 | $35,502 | $1,884 | $37,720 |
| 2010 | $72.21 | $43,326 | $2,361 | $46,646 |
| 2011 | $83.32 | $49,992 | $2,916 | $54,451 |
| 2012 | $98.73 | $59,238 | $7,755 | $69,937 |
| 2013 | $119.02 | $71,412 | $8,478 | $85,204 |
| 2014 | $141.75 | $85,050 | $9,303 | $102,636 |
| 2015 | $161.50 | $96,900 | $13,236 | $122,128 |
| 2016 | $160.11 | $96,066 | $14,286 | $122,465 |
| 2017 | $186.12 | $111,672 | $19,656 | $149,864 |
| 2018 | $203.71 | $122,226 | $20,982 | $165,738 |
| 2019 | $293.92 | $176,352 | $22,494 | $241,478 |
| 2020 | $376.78 | $226,068 | $30,144 | $320,242 |
| 2021 | $567.70 | $340,620 | $31,986 | $486,167 |
| 2022 | $456.50 | $273,900 | $34,080 | $393,526 |
| 2023 | $660.08 | $396,048 | $45,456 | $586,230 |
| 2024 | $916.27 | $549,762 | $48,156 | $818,484 |
| 2025 | $862.34 | $517,404 | $51,192 | $774,316 |
| Oct 30, 2026 | $1,012.28 | $607,368 | $54,618 | $914,289 |
More than half of the price-only value, 54.9%, was added after the end of 2022, when the position stood at $273,900.
How Much Would $1,000 in Costco Be Worth If Invested Later?
Most people asking this question did not have money in the 1985 deal. Here is the same calculation from later starting points, with all figures ending at the October 30, 2026 close.
| Invested | Start date | Start close | Price only | Dividends reinvested | Annualized, reinvested |
|---|---|---|---|---|---|
| 1 year ago | Oct 30, 2025 | $920.18 | $1,100 | $1,108 | 10.82% |
| 3 years ago | Oct 30, 2023 | $554.88 | $1,824 | $1,901 | 23.86% |
| 5 years ago | Oct 30, 2020 | $357.62 | $2,831 | $3,086 | 20.66% |
| 10 years ago | Oct 31, 2016 | $147.87 | $6,846 | $8,109 | 23.29% |
| 15 years ago | Oct 31, 2011 | $83.25 | $12,160 | $16,853 | 20.72% |
| 20 years ago | Oct 30, 2006 | $53.10 | $19,064 | $28,013 | 18.13% |
A buyer from 2016 did better per year than the IPO buyer. Part of the reason is valuation: on fiscal 2016 diluted EPS of $5.33, the October 2016 price was about 27.7 times earnings, against 48.76 times now.
What the Holder Had to Sit Through
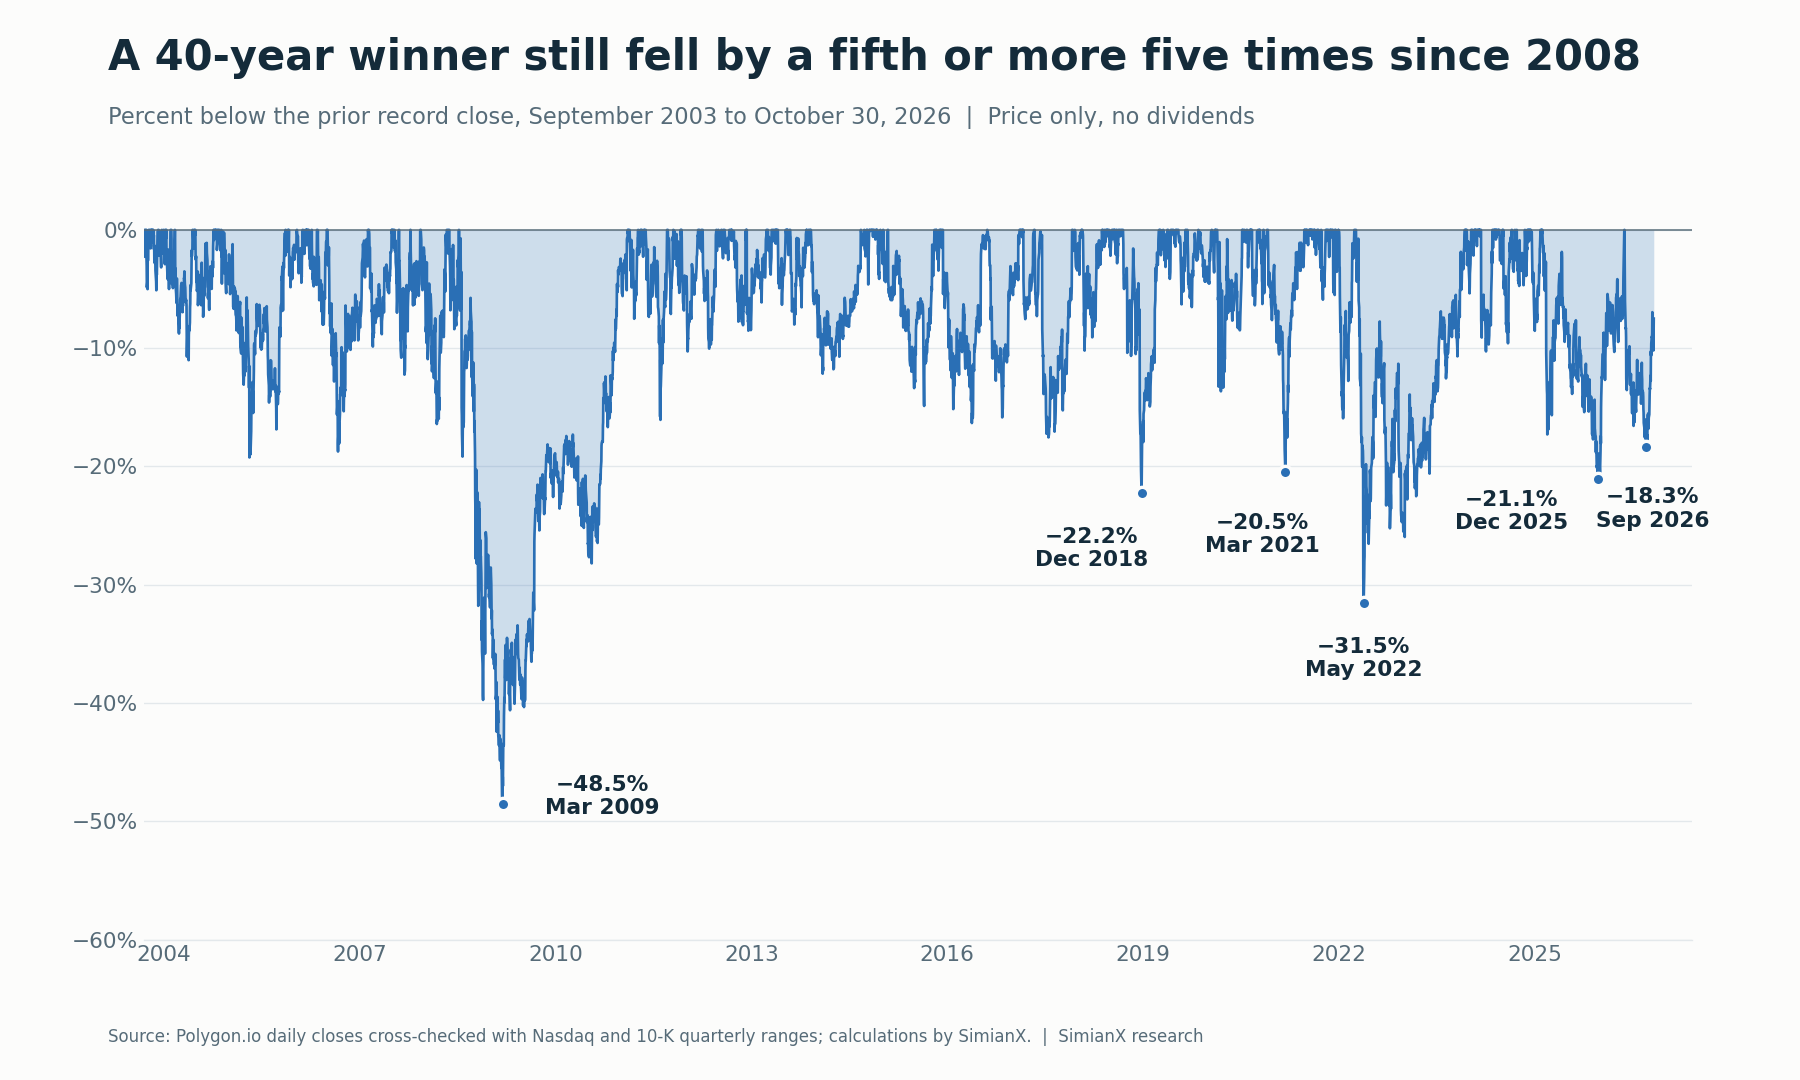
The annualized figure hides how rough the path was. The table uses closes where we have them and ignores dividends.
| Decline | High | Low | Change | Value on the position | First close back above the high |
|---|---|---|---|---|---|
| 1993 to 1995 (high and low sale prices) | $25.25 | $12.00 | −52.5% | $7,575 → $3,600 | Not verified |
| 2000 | $58.44 | $30.00 | −48.7% | $35,063 → $18,000 | Jun 29, 2007 |
| 2008 to 2009 | $74.66 | $38.44 | −48.5% | $44,796 → $23,064 | Feb 8, 2011 |
| 2018 | $244.21 | $189.99 | −22.2% | $146,526 → $113,994 | Apr 4, 2019 |
| 2020 to 2021 | $391.77 | $311.42 | −20.5% | $235,062 → $186,852 | Jun 22, 2021 |
| 2022 | $608.05 | $416.43 | −31.5% | $364,830 → $249,858 | Dec 7, 2023 |
| 2025 | $1,076.86 | $850.00 | −21.1% | $646,116 → $510,000 | May 19, 2026 |
| 2026 so far | $1,094.32 | $893.74 | −18.3% | $656,592 → $536,244 | Not yet |
The first row covers the 300 shares held at the time and comes from the quarterly ranges in the fiscal 1995 10-K, so it spans the merger and the exchange offer. The 2000 drop took about half the value off the position within a single quarter, and in our daily series, which starts in September 2003, the first close above that level is June 29, 2007. For scale, see how long every S&P 500 bear market took to recover.
Costco vs. the Whole US Market
To compare with a broad benchmark over the same 40 years, we compounded the US total market return from the Kenneth R. French Data Library, which includes dividends and runs from the start of December 1985 through September 2026, the latest month available.
| $1,000 invested, through Sep 30, 2026 | Value |
|---|---|
| US total market, dividends included, before fund fees | about $86,900 |
| Costco, price only ($910.34 close) | $546,204 |
| Costco, dividends reinvested | $821,025 |
With dividends in both, Costco finished at about 9.4 times the market. That gap is real, but we chose this stock because it won. For a look at the index itself, see the S&P 500 returns table, and for a younger IPO worked the same way, see Tesla's IPO return.
What Drove the Gain: Earnings and a Higher Multiple
We can split the move since 2003 cleanly, because per-share earnings are on record for both ends.
| Measure | Fiscal 2003 / Sep 10, 2003 | Fiscal 2026 / Oct 30, 2026 | Change |
|---|---|---|---|
| Diluted EPS | $1.53 | $20.76 | ×13.57 |
| Share price | $30.71 | $1,012.28 | ×32.96 |
| Price to trailing EPS | 20.07× | 48.76× | ×2.43 |
Earnings explain most of the rise, since 13.57 × 2.43 ≈ 32.96. But the multiple more than doubled, and that part cannot repeat from here without the multiple rising again. Fiscal 2026 shows why investors pay up: net sales rose 10.1% to $297.2 billion, adjusted comparable sales rose 6.6%, and net income rose to $9.226 billion from $8.099 billion. Membership fees of $5.907 billion were equal to about 51% of the $11.685 billion in operating income.
One item needs stripping out. Fourth-quarter earnings included a non-recurring benefit of $0.15 a share from IEEPA tariff refunds, net of what Costco reinvested in member value. That is under 1% of annual EPS, so it barely moves the multiple.
Does the Past Return Make Costco a Buy Now?
No historical return can answer that, but arithmetic can frame it. The table below assumes EPS grows 10% a year for five years, a round figure for illustration and not a forecast.
| Assumption after five years | Price multiple | Price change |
|---|---|---|
| EPS +10% a year, P/E stays 48.76× | 1.611× | +61.1% |
| EPS +10% a year, P/E falls 20% | 1.288× | +28.8% |
| EPS +10% a year, P/E falls 40% (to about 29×) | 0.966× | −3.4% |
The scenarios exclude dividends, taxes and fees. Five years of solid earnings growth can still leave the stock flat if the multiple drops to about 29 times earnings, which remains above the 20 times of 2003. You can follow the current numbers on our COST stock page.
Limits of the Calculation
- The $10 price is an assumption. It is the offering price, which not every buyer could get in 1985. We could not verify a first-day trading price. At $12 a share, the same $1,000 becomes 500 shares and $506,140 on price alone.
- Nominal dollars. Using the BLS CPI-U (109.3 in December 1985, 336.940 in September 2026), prices rose about 3.08 times. In December 1985 dollars, $607,368 is about $197,000 and $914,289 is about $297,000.
- Taxes and fees. Dividends are usually taxed when paid, which would reduce the amount reinvested. Selling could also trigger capital gains tax.
- Hindsight. Costco is the survivor we picked. A fair test of IPO investing would have to include the companies that failed.
- Real behavior. The figures assume a holder who never sold through three declines of about 50%.
Frequently Asked Questions
When did Costco go public, and at what price?
December 5, 1985, at $10.00 a share, according to Costco. Adjusted for splits, that is about $1.67.
How many times has Costco stock split?
Three times: 2-for-1 on May 15, 1991, 3-for-2 on March 6, 1992, and 2-for-1 on January 13, 2000. One IPO share is now six shares.
When was Costco's last stock split?
January 2000. There has been no split since, which is why the shares now trade near $1,000.
How much would $1,000 invested at Costco's IPO be worth today?
At the October 30, 2026 close: $607,368 on price alone, $661,986 with dividends held as cash, or about $914,289 with dividends reinvested, all before taxes and fees.
Would it have reached $1 million?
Not yet. With dividends reinvested, the holding needs a share price of about $1,107, or 9.4% above the October 30 close. It came closest at the record close of $1,094.32 on May 19, 2026, when it was worth about $985,400. On price alone, it needs $1,666.67.
How much would $1,000 invested in Costco 10 years ago be worth?
From the October 31, 2016 close of $147.87: $6,846 on price alone, or $8,109 with dividends reinvested, as of October 30, 2026.
How many special dividends has Costco paid?
Five: $7 in 2012, $5 in 2015, $7 in 2017, $10 in 2020 and $15 paid in January 2024, for $44 a share in total. None had been declared for 2026 as of November 2.
Conclusion
The number you get depends on the question you ask. $607,368 is what the shares alone are worth, and about $914,289 is what full reinvestment produces. The split history is simple, and the errors come from the merger and the exchange offer. The return also came with three declines of about 50%, and part of the gain came from a higher multiple, which today's buyer pays for up front. To test the current setup with fresh data, run a live SimianX AI analysis. This article is for information only and is not investment advice.
Related Reading
- When Did Tesla IPO? The Date, Price, and 290x Return
- S&P 500 Returns by Year: Every Year 1928–2026 Table
- How Long Every Bear Market Took to Recover: 1929-2022
- IEEPA Tariff Refunds: 78 Stocks That Got Paid and How Much
- Lululemon Stock Price History: From $511 Peak to Below $100
- Walmart & Target 2026: Decoding US Consumer Stress Signals
References
- Costco Investor Relations: investor FAQ (IPO, merger ratios, first dividend)
- Costco Investor Relations: stock split history and dividend page
- Costco: fiscal 1994 Form 10-K (merger terms)
- Costco: Form 8-K of January 3, 1995 (exchange offer results)
- Costco: fiscal 1995 Form 10-K (spin-off note, price ranges)
- Costco: fiscal 2000 Form 10-K (2000 split, closing price ranges)
- Costco: fiscal 2003 Form 10-K (EPS)
- Costco: fiscal 2016 Form 10-K (EPS)
- Costco: fiscal 2026 results (Form 8-K, Exhibit 99.1)
- Costco: fiscal 2026 Form 10-K (cash, debt, dividends)
- Costco: October 14, 2026 quarterly dividend announcement
- Nasdaq: COST historical prices
- Polygon.io: US stock and dividend data
- Kenneth R. French Data Library: US market factors
- US Bureau of Labor Statistics: CPI-U, all items
- Investopedia: dividend reinvestment plans