
Samsung Electronics (005930) Stock: Price History, Earnings and What Moves It
Quick answer (October 16, 2026 close): Samsung Electronics common stock (KRX: 005930) closed at ₩215,500, up 79.7% in 2026 after a 125.4% gain in 2025, but 40.6% below its record close of ₩362,500 on June 18, 2026. The 52-week closing range is ₩94,800 to ₩362,500. Market value of the common shares: about ₩1,260 trillion (roughly $940 billion). Third-quarter 2026 preliminary guidance (October 8): revenue of about ₩195 trillion and operating profit of about ₩107.4 trillion, the first time any Korean company has earned more than ₩100 trillion of operating profit in a quarter.
Updated October 18, 2026: prices through the October 16 close, the Q3 2026 preliminary earnings guidance, the October 15 KOSPI circuit breaker and the October 16 analyst consensus added. Next update: after the full Q3 2026 results on October 29.
Samsung Electronics is the largest company on the Korea Exchange and, in 2026, one of the most volatile mega-caps in the world. Its common stock trades in Seoul under the code 005930 (Yahoo Finance: 005930.KS). In seven months it went from ₩94,800 (November 21, 2025) to ₩362,500 (June 18, 2026), almost a fourfold rise, and then gave back 40% of the peak value by mid-October as the KOSPI sold off.
This page is a permanent reference for the stock: the year-end price and annual return for every year since 1999, every decline of 30% or more since 2000, the last eight quarters of operating profit, what actually drives the share price, and how Samsung compares with SK Hynix and the KOSPI. All prices are official Korea Exchange closing prices, adjusted for the 2018 50-for-1 stock split and checked against at least two independent sources. It is data, not a recommendation: SimianX publishes no price target of its own, and the analyst consensus below is quoted with its source and date.
Samsung Electronics stock at a glance
| Item | Value |
|---|---|
| Listing / code | Korea Exchange (KOSPI) · 005930 (common) · 005935 (preferred) |
| Latest close | ₩215,500 (October 16, 2026), about $160.7 at ₩1,341 per dollar |
| Change in 2026 | +79.7% (from ₩119,900 at the end of 2025) |
| Change in 2025 | +125.4%, the best calendar year since 1999 |
| 52-week closing range | ₩94,800 (Nov 21, 2025) to ₩362,500 (Jun 18, 2026) |
| 52-week intraday range | ₩94,500 to ₩374,500 (Jun 19, 2026) |
| Record close | ₩362,500 on June 18, 2026 (−40.6% at the latest close) |
| Common shares outstanding | 5,846,278,608 (after the April 2026 cancellation) |
| Market value, common shares | ₩1,259.9 trillion · about $940 billion |
| Foreign ownership | 45.98% of common shares (October 16, 2026) |
| Q3 2026 preliminary results | Revenue ≈ ₩195 trillion (+126.6% YoY) · operating profit ≈ ₩107.4 trillion (+782.5% YoY) |
| Analyst consensus (22 brokers, Oct 16, 2026) | Average target price ₩495,227 · consensus EPS ₩45,521 · forward P/E 4.7× |
| Next earnings date | Full Q3 2026 results on October 29, 2026 |
Sources: Korea Exchange closing prices via Yahoo Finance, CNBC and Naver Finance; share count, foreign ownership, market value and consensus from WiseReport (FnGuide) as of October 16, 2026; earnings from Samsung's October 8 guidance. Dollar figures use the October 16 USD/KRW close of ₩1,340.95 (Yahoo Finance). The market value covers common shares only; the preferred shares (005935) are listed separately.
A note on "today's price": since March 2025, Korean stocks also trade on Nextrade, an alternative trading system approved by the Financial Services Commission, which runs pre-market (8:00–8:50 a.m.) and after-market (3:30–8:00 p.m.) sessions. Some portals now show an integrated price that includes those late trades. On October 16, 2026 that integrated last price was ₩217,000, while the official Korea Exchange close was ₩215,500. Every figure on this page uses the official close.
Samsung stock price by year, 1999–2026
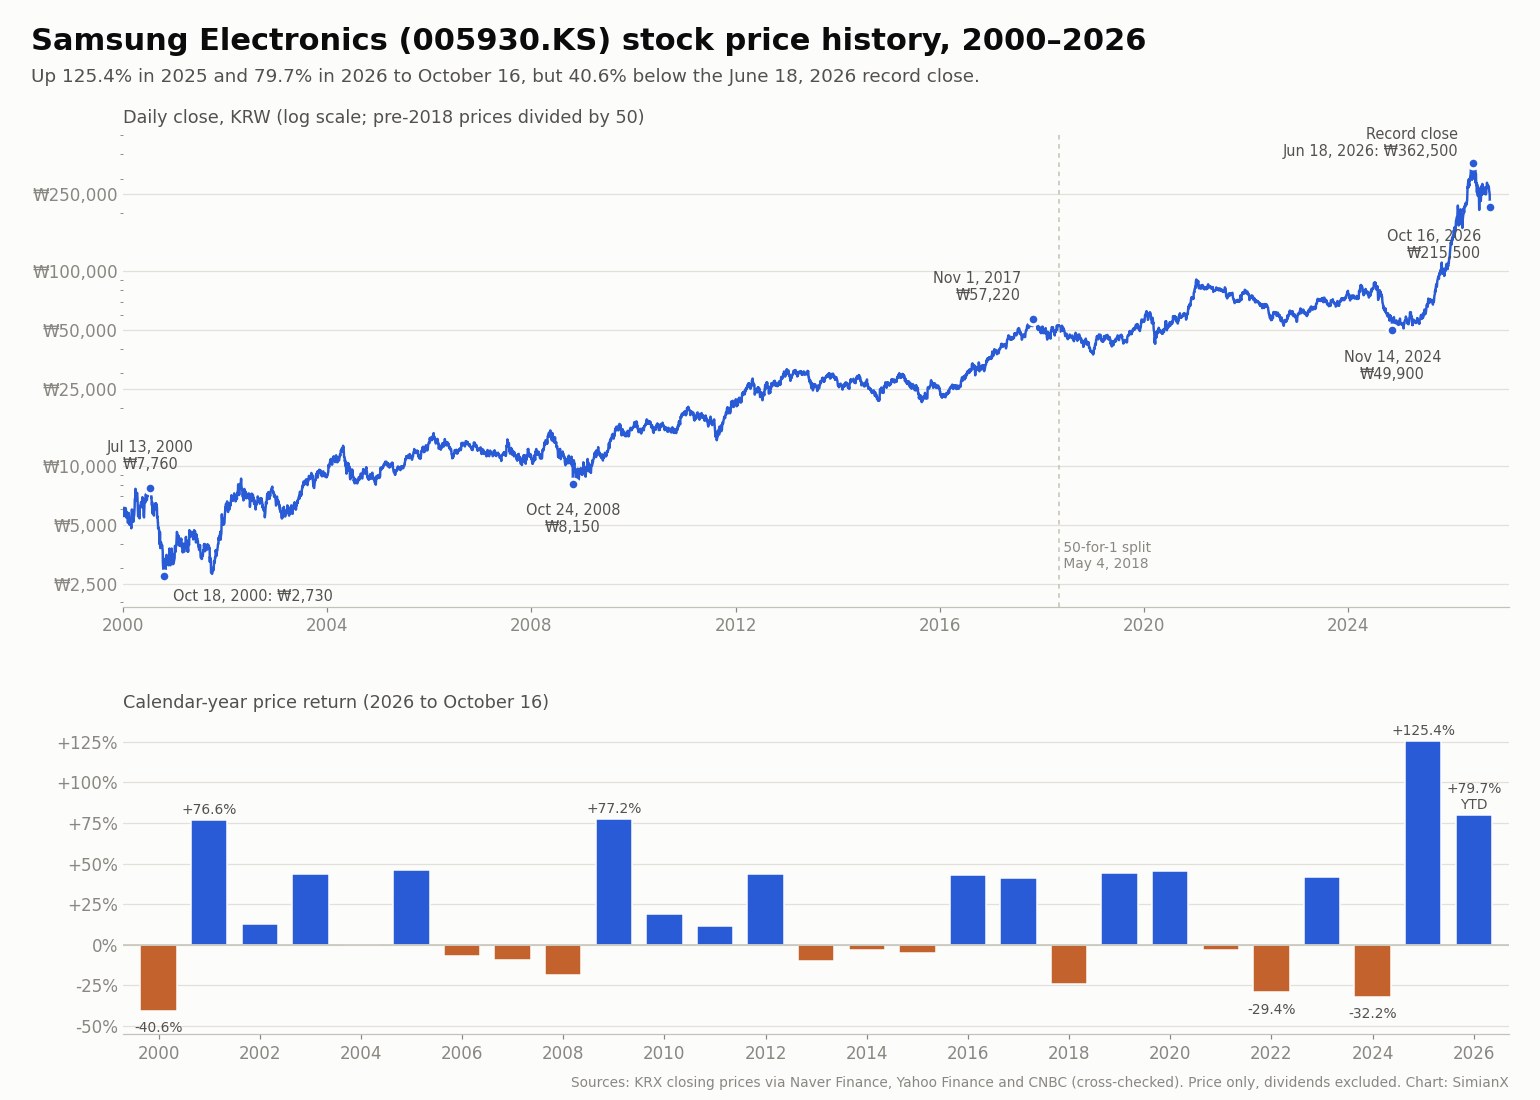
Year-end close is the last Korea Exchange session of the year. Prices before May 4, 2018 are divided by 50 for the stock split. Down years are in bold.
| Year | Year-end close (₩) | Annual change | Highest close (₩) | Lowest close (₩) | KOSPI annual change |
|---|---|---|---|---|---|
| 1999 | 5,320 | +244.1% | 5,580 | 1,595 | +82.8% |
| 2000 | 3,160 | −40.6% | 7,760 | 2,730 | −50.9% |
| 2001 | 5,580 | +76.6% | 5,670 | 2,800 | +37.5% |
| 2002 | 6,280 | +12.5% | 8,640 | 5,470 | −9.5% |
| 2003 | 9,020 | +43.6% | 9,600 | 5,390 | +29.2% |
| 2004 | 9,010 | −0.1% | 12,740 | 8,040 | +10.5% |
| 2005 | 13,180 | +46.3% | 13,240 | 8,700 | +54.0% |
| 2006 | 12,260 | −7.0% | 14,800 | 10,980 | +4.0% |
| 2007 | 11,120 | −9.3% | 13,740 | 10,140 | +32.3% |
| 2008 | 9,020 | −18.9% | 15,280 | 8,150 | −40.7% |
| 2009 | 15,980 | +77.2% | 16,500 | 8,840 | +49.7% |
| 2010 | 18,980 | +18.8% | 18,980 | 14,720 | +21.9% |
| 2011 | 21,160 | +11.5% | 21,680 | 13,600 | −11.0% |
| 2012 | 30,440 | +43.9% | 30,660 | 20,320 | +9.4% |
| 2013 | 27,440 | −9.9% | 31,520 | 24,340 | +0.7% |
| 2014 | 26,540 | −3.3% | 29,400 | 21,660 | −4.8% |
| 2015 | 25,200 | −5.0% | 30,060 | 21,340 | +2.4% |
| 2016 | 36,040 | +43.0% | 36,240 | 22,520 | +3.3% |
| 2017 | 50,960 | +41.4% | 57,220 | 35,560 | +21.8% |
| 2018 | 38,700 | −24.1% | 53,000 | 38,250 | −17.3% |
| 2019 | 55,800 | +44.2% | 56,700 | 37,450 | +7.7% |
| 2020 | 81,000 | +45.2% | 81,000 | 42,500 | +30.8% |
| 2021 | 78,300 | −3.3% | 91,000 | 68,800 | +3.6% |
| 2022 | 55,300 | −29.4% | 78,900 | 52,600 | −24.9% |
| 2023 | 78,500 | +42.0% | 78,500 | 55,400 | +18.7% |
| 2024 | 53,200 | −32.2% | 87,800 | 49,900 | −9.6% |
| 2025 | 119,900 | +125.4% | 119,900 | 51,000 | +75.6% |
| 2026 (to Oct 16) | 215,500 | +79.7% | 362,500 | 128,500 | +34.5% |
What the table shows. From the end of 1999 to the end of 2025 the stock rose from ₩5,320 to ₩119,900, a compound price return of 12.7% a year before dividends. It rose in 14 of the 26 full calendar years from 2000 to 2025, with a median annual change of +12.0%, and beat the KOSPI in 15 of those 26 years. The best year was 2025 (+125.4%) and the worst was 2000 (−40.6%). Long flat stretches are part of the record: the stock ended 2015 below its 2012 close, and it ended 2024 at ₩53,200, barely above its 2017 close of ₩50,960 seven years earlier. The 2018 row reflects the split year: the ₩53,000 high is the April 27, 2018 close of ₩2,650,000 divided by 50.
Every Samsung stock decline of 30% or more since 2000
A decline is measured from a record closing high to the lowest close before the stock set a new record. "Back to the peak" is the first close at or above the old high.
| Peak close | Low close | Decline | Back to the peak |
|---|---|---|---|
| ₩7,760 (Jul 13, 2000) | ₩2,730 (Oct 18, 2000) | −64.8% | Apr 2, 2002 |
| ₩8,640 (Apr 24, 2002) | ₩5,390 (Feb 10, 2003) | −37.6% | Aug 20, 2003 |
| ₩12,740 (Apr 23, 2004) | ₩8,040 (Dec 13, 2004) | −36.9% | Dec 7, 2005 |
| ₩14,800 (Jan 31, 2006) | ₩10,140 (Oct 25, 2007) | −31.5% | May 6, 2008 |
| ₩15,280 (May 15, 2008) | ₩8,150 (Oct 24, 2008) | −46.7% | Aug 24, 2009 |
| ₩20,200 (Jan 28, 2011) | ₩13,600 (Aug 19, 2011) | −32.7% | Dec 1, 2011 |
| ₩31,520 (Jan 2, 2013) | ₩21,340 (Aug 26, 2015) | −32.3% | Aug 18, 2016 |
| ₩57,220 (Nov 1, 2017) | ₩37,450 (Jan 4, 2019) | −34.6% | Jan 9, 2020 |
| ₩62,400 (Jan 20, 2020) | ₩42,500 (Mar 23, 2020) | −31.9% | Nov 13, 2020 |
| ₩91,000 (Jan 11, 2021) | ₩49,900 (Nov 14, 2024) | −45.2% | Oct 10, 2025 |
| ₩362,500 (Jun 18, 2026) | ₩207,000 (Jul 30, 2026) | −42.9% | Not yet |
Eleven declines of 30% or more in 26 years means one roughly every two and a half years. The longest wait was the last completed one: after the January 2021 peak the stock needed four years and nine months to close at a new high. The 2026 decline is already the fourth deepest since 2000, behind the 2000 dot-com bust, the 2008 financial crisis and the 2021–2024 slide. For the index-level view of the same episodes, see every KOSPI crash since 1990, and for chip stocks worldwide, every SOX semiconductor bear market.
Samsung earnings: the last eight quarters
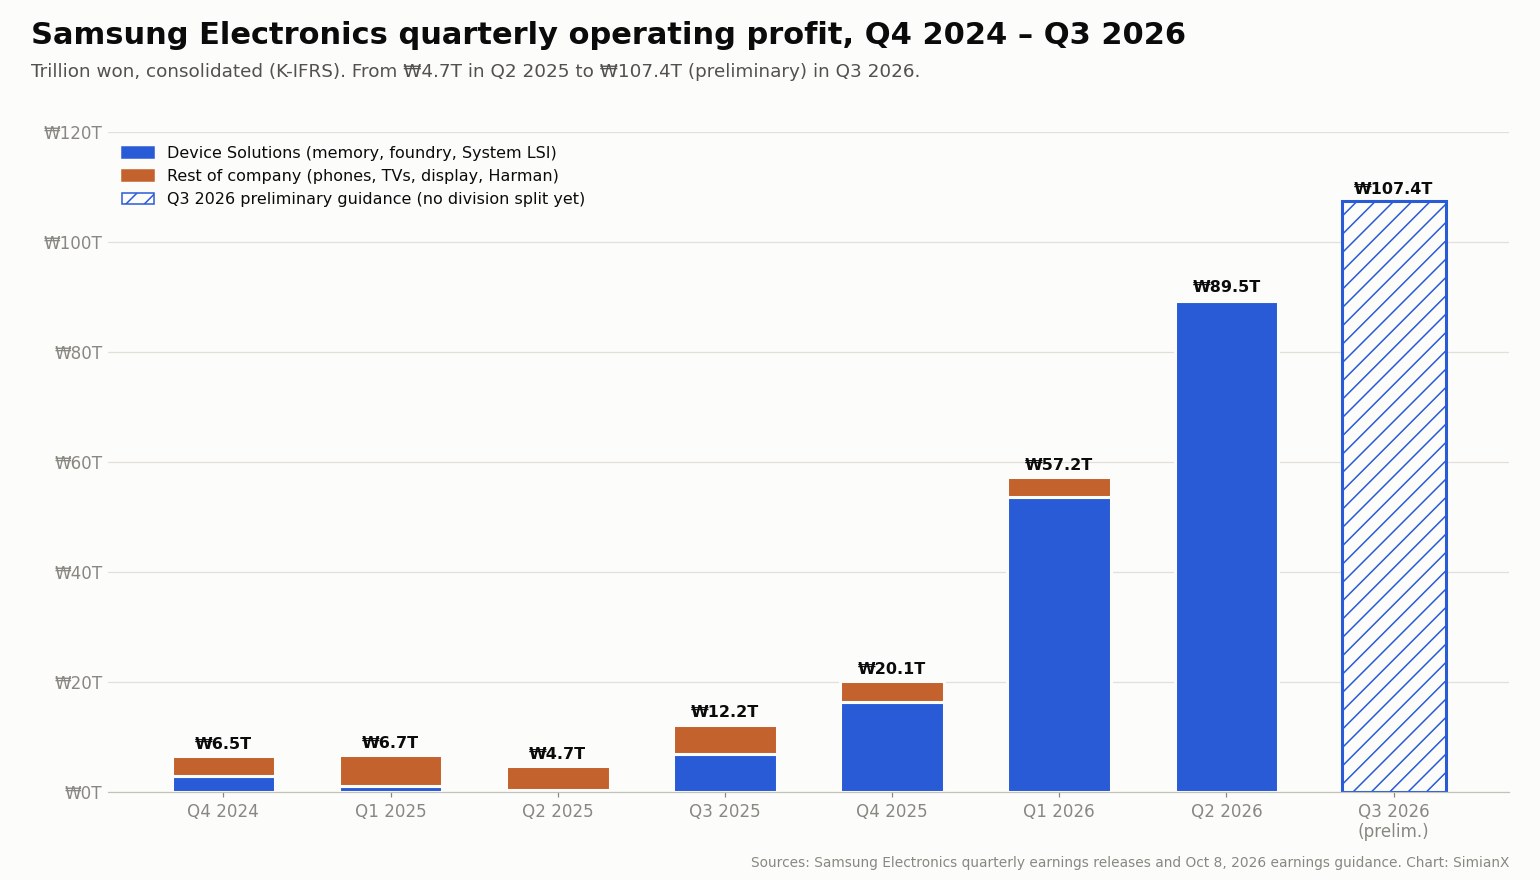
All figures are consolidated, in trillion won (K-IFRS), from Samsung's quarterly earnings releases. Q3 2026 is the preliminary guidance of October 8, 2026, which gives no division breakdown; final figures are due on October 29.
| Quarter | Revenue | Operating profit | Operating margin | Device Solutions (chips) operating profit | MX and Networks (phones) operating profit |
|---|---|---|---|---|---|
| Q4 2024 | 75.8 | 6.5 | 8.6% | 2.9 | 2.1 |
| Q1 2025 | 79.1 | 6.7 | 8.5% | 1.1 | 4.3 |
| Q2 2025 | 74.6 | 4.7 | 6.3% | 0.4 | 3.1 |
| Q3 2025 | 86.1 | 12.2 | 14.2% | 7.0 | 3.6 |
| Q4 2025 | 93.8 | 20.1 | 21.4% | 16.4 | 1.9 |
| Q1 2026 | 133.9 | 57.2 | 42.7% | 53.7 | 2.8 |
| Q2 2026 | 171.5 | 89.5 | 52.2% | 89.2 | −0.7 |
| Q3 2026 (preliminary) | ≈195 | ≈107.4 | ≈55.1% | — | — |
For the full years, Samsung reported revenue of ₩300.9 trillion and operating profit of ₩32.7 trillion in 2024, and ₩333.6 trillion and ₩43.6 trillion in 2025. The first nine months of 2026 add up to about ₩254.1 trillion of operating profit, nearly six times all of 2025.
What changed. In the first half of 2025 the chip division barely broke even: Samsung blamed lower HBM sales, inventory write-downs and U.S. export restrictions on AI chips to China. From the third quarter of 2025, memory prices rose across the industry and Samsung's HBM sales recovered. In February 2026 it shipped its first commercial HBM4, and its Q1 2026 release reported the first mass sales of HBM4 for NVIDIA's Vera Rubin platform. By Q2 2026 the chip division earned ₩89.2 trillion of the company's ₩89.5 trillion: everything else, from Galaxy phones to TVs, roughly netted to zero, and the phone business posted an operating loss of ₩0.7 trillion as memory costs rose. For Q3, the Korea Times reported that the ₩107.4 trillion beat the brokerage consensus of ₩106.64 trillion while revenue fell short of the ₩200.64 trillion forecast, and that analysts expected a second straight loss in the Device eXperience division.
What drives Samsung Electronics stock
1. The memory cycle, now led by AI servers. Samsung was the world's largest DRAM maker by revenue in Q2 2026: TrendForce put its share of Q2 2026 DRAM revenue at 39.4%, ahead of SK Hynix (24.9%) and Micron (23.3%). Memory prices swing hard, and the stock tends to move before the earnings do: the 2025 rally began while the chip division was earning almost nothing (₩0.4 trillion of operating profit in Q2 2025). The quarterly table above is the clearest illustration of how much operating leverage the business has.
2. HBM share. High-bandwidth memory is the stacked DRAM that sits next to AI accelerators. Counterpoint Research estimates Samsung's share of HBM revenue rose from 15% in Q2 2025 to 33% in Q2 2026, against 50% for SK Hynix. Winning qualification and volume with the largest AI chip customers, NVIDIA above all, has been a central question for the stock since Samsung fell behind SK Hynix in HBM.
3. Foundry. Samsung also makes chips for other companies. The business lost ground to TSMC for years; in July 2025 it signed a $16.5 billion contract with Tesla to make AI chips at its Taylor, Texas fab through 2033. In its Q2 2026 release Samsung said foundry earnings improved significantly before incentive provisions, helped by HBM base-die demand and U.S. customers.
4. Smartphones and consumer electronics. The Galaxy phone, TV and appliance businesses still bring in a large share of revenue (₩33.2 trillion for MX and Networks alone in Q2 2026), but they now matter for the stock mainly as a drag when memory costs squeeze their margins.
5. The won. Samsung reports in won but sells chips in dollars, so a weaker won lifts reported earnings and a stronger won cuts them. The won strengthened from ₩1,439.42 per dollar on December 30, 2025 to ₩1,342.13 on October 9, 2026 (FRED noon buying rates), and Korean analysts cited that appreciation as a headwind for Q3 profits. For a dollar-based investor the same move worked the other way: measured in dollars at Yahoo Finance USD/KRW closes, Samsung's 2026 gain to October 16 is about 92%, against 79.7% in won. The full won history is in our dollar exchange rate by year table.
6. KOSPI weight and foreign flows. Samsung is so large that it moves the index and is moved by index-level money. On June 2, 2026, Samsung's market value of ₩2,107.6 trillion was about 29% of the KOSPI's ₩7,215 trillion, and Samsung plus SK Hynix made up 52.52% of the market, according to Korea Exchange data reported by Etoday. Foreign investors own about 46% of the common shares, so global risk appetite feeds straight into the price: on August 24, 2026 foreigners sold a net ₩3.68 trillion of Korean stocks, and on October 15 foreign selling was concentrated in Samsung and SK Hynix.
7. Shareholder returns and the ownership structure. Samsung cancelled 73,359,314 common shares bought back in 2025 on April 2, 2026 (NewsTomato). On August 24, 2026 its plan to return up to ₩110 trillion to shareholders sent the stock down 8.7% to ₩257,000, because investors had expected up to ₩150 trillion and no new share cancellation was announced (Korea Herald). The Herald explained the constraint: cancelling more shares would push the combined stake of Samsung's insurance affiliates above a 10% regulatory cap. Samsung Life Insurance and related parties hold 19.69% of the common shares, and the National Pension Service holds 7.84%.
8. Rates and the AI funding cycle. The October 2026 sell-off was not about Samsung's own results, which beat forecasts. A Samsung Securities report quoted by the Asia Business Daily blamed hotter-than-expected U.S. inflation (September CPI +3.7%), 10-year Treasury yields above 5.3%, widening credit spreads at AI cloud companies such as CoreWeave, and persistent foreign selling. When the cost of funding AI data centres rises, the market discounts the memory makers that supply them. The same mechanism drove the 2026 AI momentum unwind.
Samsung vs SK Hynix vs the KOSPI
| Measure | Samsung Electronics | SK Hynix | KOSPI |
|---|---|---|---|
| 2025 price change | +125.4% | +274.4% | +75.6% |
| 2026 to October 16 | +79.7% | +95.4% | +34.5% |
| 2026 peak close | ₩362,500 (Jun 18) | ₩2,919,000 (Jun 22) | 9,114.55 (Jun 22) |
| Change from 2026 peak to Oct 16 | −40.6% | −56.4% | −37.8% |
| Q2 2026 operating profit | ₩89.5 trillion | ₩60.5 trillion | — |
| Q2 2026 operating margin | 52.2% | 76% | — |
| HBM revenue share, Q2 2026 (Counterpoint) | 33% | 50% | — |
| DRAM revenue share, Q2 2026 (TrendForce) | 39.4% | 24.9% | — |
| U.S. listing | None (GDRs in London) | ADRs on Nasdaq (SKHY) since July 2026 | — |
SK Hynix is the purer HBM bet and has been the bigger winner in both directions: it rose more in 2025 and 2026 and has fallen further from the June peak. Samsung earns more in absolute terms because it is the larger DRAM supplier and sells more conventional DRAM and NAND, whose prices jumped in 2026, but at a lower margin because the phone, TV and display businesses dilute it. Both stocks peaked within two trading days of the KOSPI, which shows how much of the index the two of them have become. The detailed SK Hynix case is in our SK Hynix stock analysis; the KOSPI side, with every crash since 1990, is in the KOSPI crash table. For the other big memory maker, see Micron and HBM3E.
The 2026 round trip in dates
- January 2, 2026: the lowest close of the year, ₩128,500.
- June 18, 2026: record close of ₩362,500; the intraday record of ₩374,500 came the next day.
- June 22, 2026: SK Hynix and the KOSPI (9,114.55) record their peaks.
- July 30, 2026: Samsung reports Q2 operating profit of ₩89.5 trillion; the stock closes at ₩207,000, 42.9% below the record and the lowest close of the decline so far.
- August 24, 2026: the up-to-₩110 trillion shareholder-return plan disappoints; the stock falls 8.7% to ₩257,000 and the KOSPI 3.12%.
- October 8, 2026: Q3 preliminary guidance of ₩107.4 trillion operating profit; the stock closes at ₩262,000.
- October 15, 2026: after the U.S. September CPI report, the KOSPI triggers a circuit breaker and closes at 5,554.22 (−7.6%); Samsung falls 9.5% to ₩210,000.
- October 16, 2026: Samsung closes at ₩215,500 (+2.6%).
The 2018 stock split, explained
Samsung announced a 50-for-1 stock split on January 31, 2018 (Korea Times). The par value fell from ₩5,000 to ₩100, trading was suspended from April 30 to May 3, and the new shares started trading on May 4, 2018 (Korea JoongAng Daily). The last pre-split close was ₩2,650,000, equal to ₩53,000 after the split. Charts and tables that mix unadjusted pre-2018 prices with post-split prices show a fake 98% crash in May 2018; every price on this page before that date is divided by 50.
Where Samsung stock trades
- Korea Exchange: common shares 005930 and preferred shares 005935 (the preferred carry no voting rights and usually trade at a discount). Regular session 9:00 a.m. to 3:30 p.m. Korea time.
- London: global depositary receipts under the symbol SMSN, each representing 25 common shares (AJ Bell listing data).
- United States: no ADR. After Bloomberg reported in July 2026 that Samsung was exploring one, a spokesperson told Reuters that "Samsung Electronics is not reviewing the possibility of issuing American Depositary Receipts" (SamMobile, July 15, 2026). SK Hynix, by contrast, listed ADRs in July 2026, pricing at $149 and raising about $26.5 billion (Korea JoongAng Daily).
- ETFs: Samsung is one of the largest holdings of Korea country funds such as the iShares MSCI South Korea ETF (EWY).
Frequently asked questions
What is Samsung Electronics' stock price today?
At the October 16, 2026 close the common stock (005930) was ₩215,500 on the Korea Exchange, about $160.7. Prices update every Korean trading day; the integrated price on some portals can differ slightly because it includes Nextrade after-hours trades.
What is the Samsung stock price forecast for 2026?
SimianX does not make price forecasts. As of October 16, 2026, the average target price of 22 brokers tracked by WiseReport (FnGuide) was ₩495,227, with a consensus EPS estimate of ₩45,521. Individual targets vary widely, and consensus targets lag sharp price moves like October's.
Why did Samsung stock fall in October 2026?
Not because of its earnings, which beat forecasts. The fall came with a market-wide sell-off: hotter-than-expected U.S. inflation, 10-year Treasury yields above 5.3%, credit stress at AI cloud companies and heavy foreign selling of Korean chip stocks. On October 15 the KOSPI hit a circuit breaker and Samsung fell 9.5%.
When did Samsung split its stock?
A 50-for-1 split took effect on May 4, 2018. One pre-split share at ₩2,650,000 became 50 shares worth ₩53,000 each.
What was Samsung's best and worst year?
Since 1999, the best full year was 2025 (+125.4%) and the worst was 2000 (−40.6%). Other down years of more than 20%: 2024 (−32.2%), 2022 (−29.4%) and 2018 (−24.1%).
How much is Samsung Electronics worth?
The common shares were worth about ₩1,259.9 trillion (about $940 billion) at the October 16, 2026 close. On June 2, 2026, near the peak, the common stock alone was valued at ₩2,107.6 trillion.
When does Samsung report earnings?
Samsung publishes preliminary revenue and operating profit in the first week or so after each quarter ends (October 8 for Q3 2026) and full results with division figures at the end of the month (October 29 for Q3 2026).
Can I buy Samsung stock in the US?
There is no U.S. listing or ADR. U.S. investors can buy the Korean shares through brokers with access to the Korea Exchange, the London GDRs, or ETFs that hold Samsung.
How this page is updated
Updated October 18, 2026. Prices are official Korea Exchange closes. Rows to 2025 come from Naver Finance and match CNBC on every year-end and Yahoo Finance on every year-end except 2005 (₩13,160 vs ₩13,180); 2026 prices come from Yahoo Finance and CNBC, which agree on every date quoted here. Returns are price returns and exclude dividends. Quarterly figures come from Samsung's earnings releases; preliminary figures are replaced with final ones when published. The page is refreshed after each Samsung earnings release (next: October 29, 2026, full Q3 results), after any move of 10% or more in a session, and at year-end, when the 2026 row becomes a full year. Analyst consensus is quoted with its source and date and is not a SimianX forecast.
You can run a live, multi-model AI analysis of the iShares MSCI South Korea ETF (EWY), a U.S.-listed Korea fund that holds Samsung, in the SimianX live analysis room, or browse more reference tables in the SimianX story library.
Related Reading
- SK Hynix Stock Surges 8%: Is the AI Supercycle Real?
- South Korea Stock Market Crash 2026 vs Every KOSPI Crash
- AI Momentum Unwind 2026: Why Semiconductor Stocks Fall
- Semiconductor Bear Markets: Every SOX Crash, 1995–2026
- TSMC Stock 2026: Why Nvidia Still Can’t Replace Its Fab
- Micron (MU): Why HBM3e Makes It the 2026 AI Memory Play
- Why Investors Are Shorting Micron Stock in the AI Boom
- AI Capex 2026: Big Tech Now Spends 96% of Its Cash Flow
- Every Tech Bubble Since 1929: How AI in 2026 Compares
- US Dollar Rate History by Year: 14 Currencies Since 1971
- More reference tables in the Market history topic hub
References
- Samsung Electronics — Earnings guidance for the third quarter of 2026 (October 8, 2026)
- Samsung Electronics — Second quarter 2026 results (July 30, 2026)
- Samsung Electronics — First quarter 2026 results (April 30, 2026)
- Samsung Electronics — Fourth quarter and FY 2025 results (January 29, 2026)
- Samsung Electronics — Third quarter 2025 results (October 30, 2025)
- Samsung Electronics — Second quarter 2025 results (July 31, 2025)
- Samsung Electronics — First quarter 2025 results (April 30, 2025)
- Samsung Electronics — Fourth quarter and FY 2024 results (January 31, 2025)
- Samsung Electronics — Investor relations
- Samsung Electronics — First commercial HBM4 shipment (February 2026)
- Yahoo Finance — 005930.KS historical prices
- CNBC — KOSPI index (.KS11) quote
- Naver Finance — Samsung Electronics daily prices
- WiseReport (FnGuide) — Samsung Electronics company snapshot and consensus (October 16, 2026)
- FRED — South Korean won to US dollar exchange rate (DEXKOUS)
- TrendForce — DRAM industry revenue, 2Q26 (September 7, 2026)
- Counterpoint Research — Global HBM market share, Q2 2026
- Korea Times — Samsung's Q3 2026 operating profit estimate (October 8, 2026)
- Korea Herald — Samsung's ₩110 trillion shareholder return disappoints (August 24, 2026)
- Asia Business Daily — Samsung Securities on the October 2026 KOSPI correction (October 15, 2026)
- Etoday via Daum — Samsung and SK Hynix pass half of KOSPI market value (June 3, 2026)
- NewsTomato — Samsung to cancel ₩14.5 trillion of treasury shares on April 2 (2026)
- Tom's Hardware — Samsung's $16.5 billion Tesla chip contract (July 2025)
- Korea Times — Samsung announces 50:1 stock split (January 31, 2018)
- Korea JoongAng Daily — Samsung Electronics returns to market after stock split (May 2018)
- SamMobile — Samsung denies ADR plans (July 15, 2026)
- Korea JoongAng Daily — Samsung explores potential US ADR listing (July 14, 2026)
- AJ Bell — Samsung Electronics GDR (LSE: SMSN)
- Financial Services Commission — Final approval for the Nextrade ATS (February 5, 2025)