Tesla Q2 Earnings 2026: Can Robotaxi Offset Falling EV Margins?
The Tesla Q2 earnings 2026 report will test whether the company’s accelerating Robotaxi narrative can support its valuation while the core electric-vehicle business faces renewed margin pressure. Tesla enters the report with surprisingly strong vehicle deliveries, wider Robotaxi availability, and a rapidly expanding energy-storage business.
However, investors must also weigh aggressive AI spending, weaker regulatory-credit revenue, and the possibility that promotional pricing supported the delivery rebound.
Tesla will release its second-quarter results after the U.S. market closes on Wednesday, July 22, 2026, followed by a management webcast at 5:30 p.m. Eastern Time.
For investors using SimianX AI to analyze real-time stock signals, the most important question is not simply whether Tesla beats earnings estimates. It is whether the numbers show that Tesla can finance its autonomy strategy without sacrificing the economics of its existing vehicle business.

Tesla Q2 2026 Earnings Expectations at a Glance
Tesla’s company-compiled analyst consensus points to a sharp recovery from the weak second quarter of 2025.
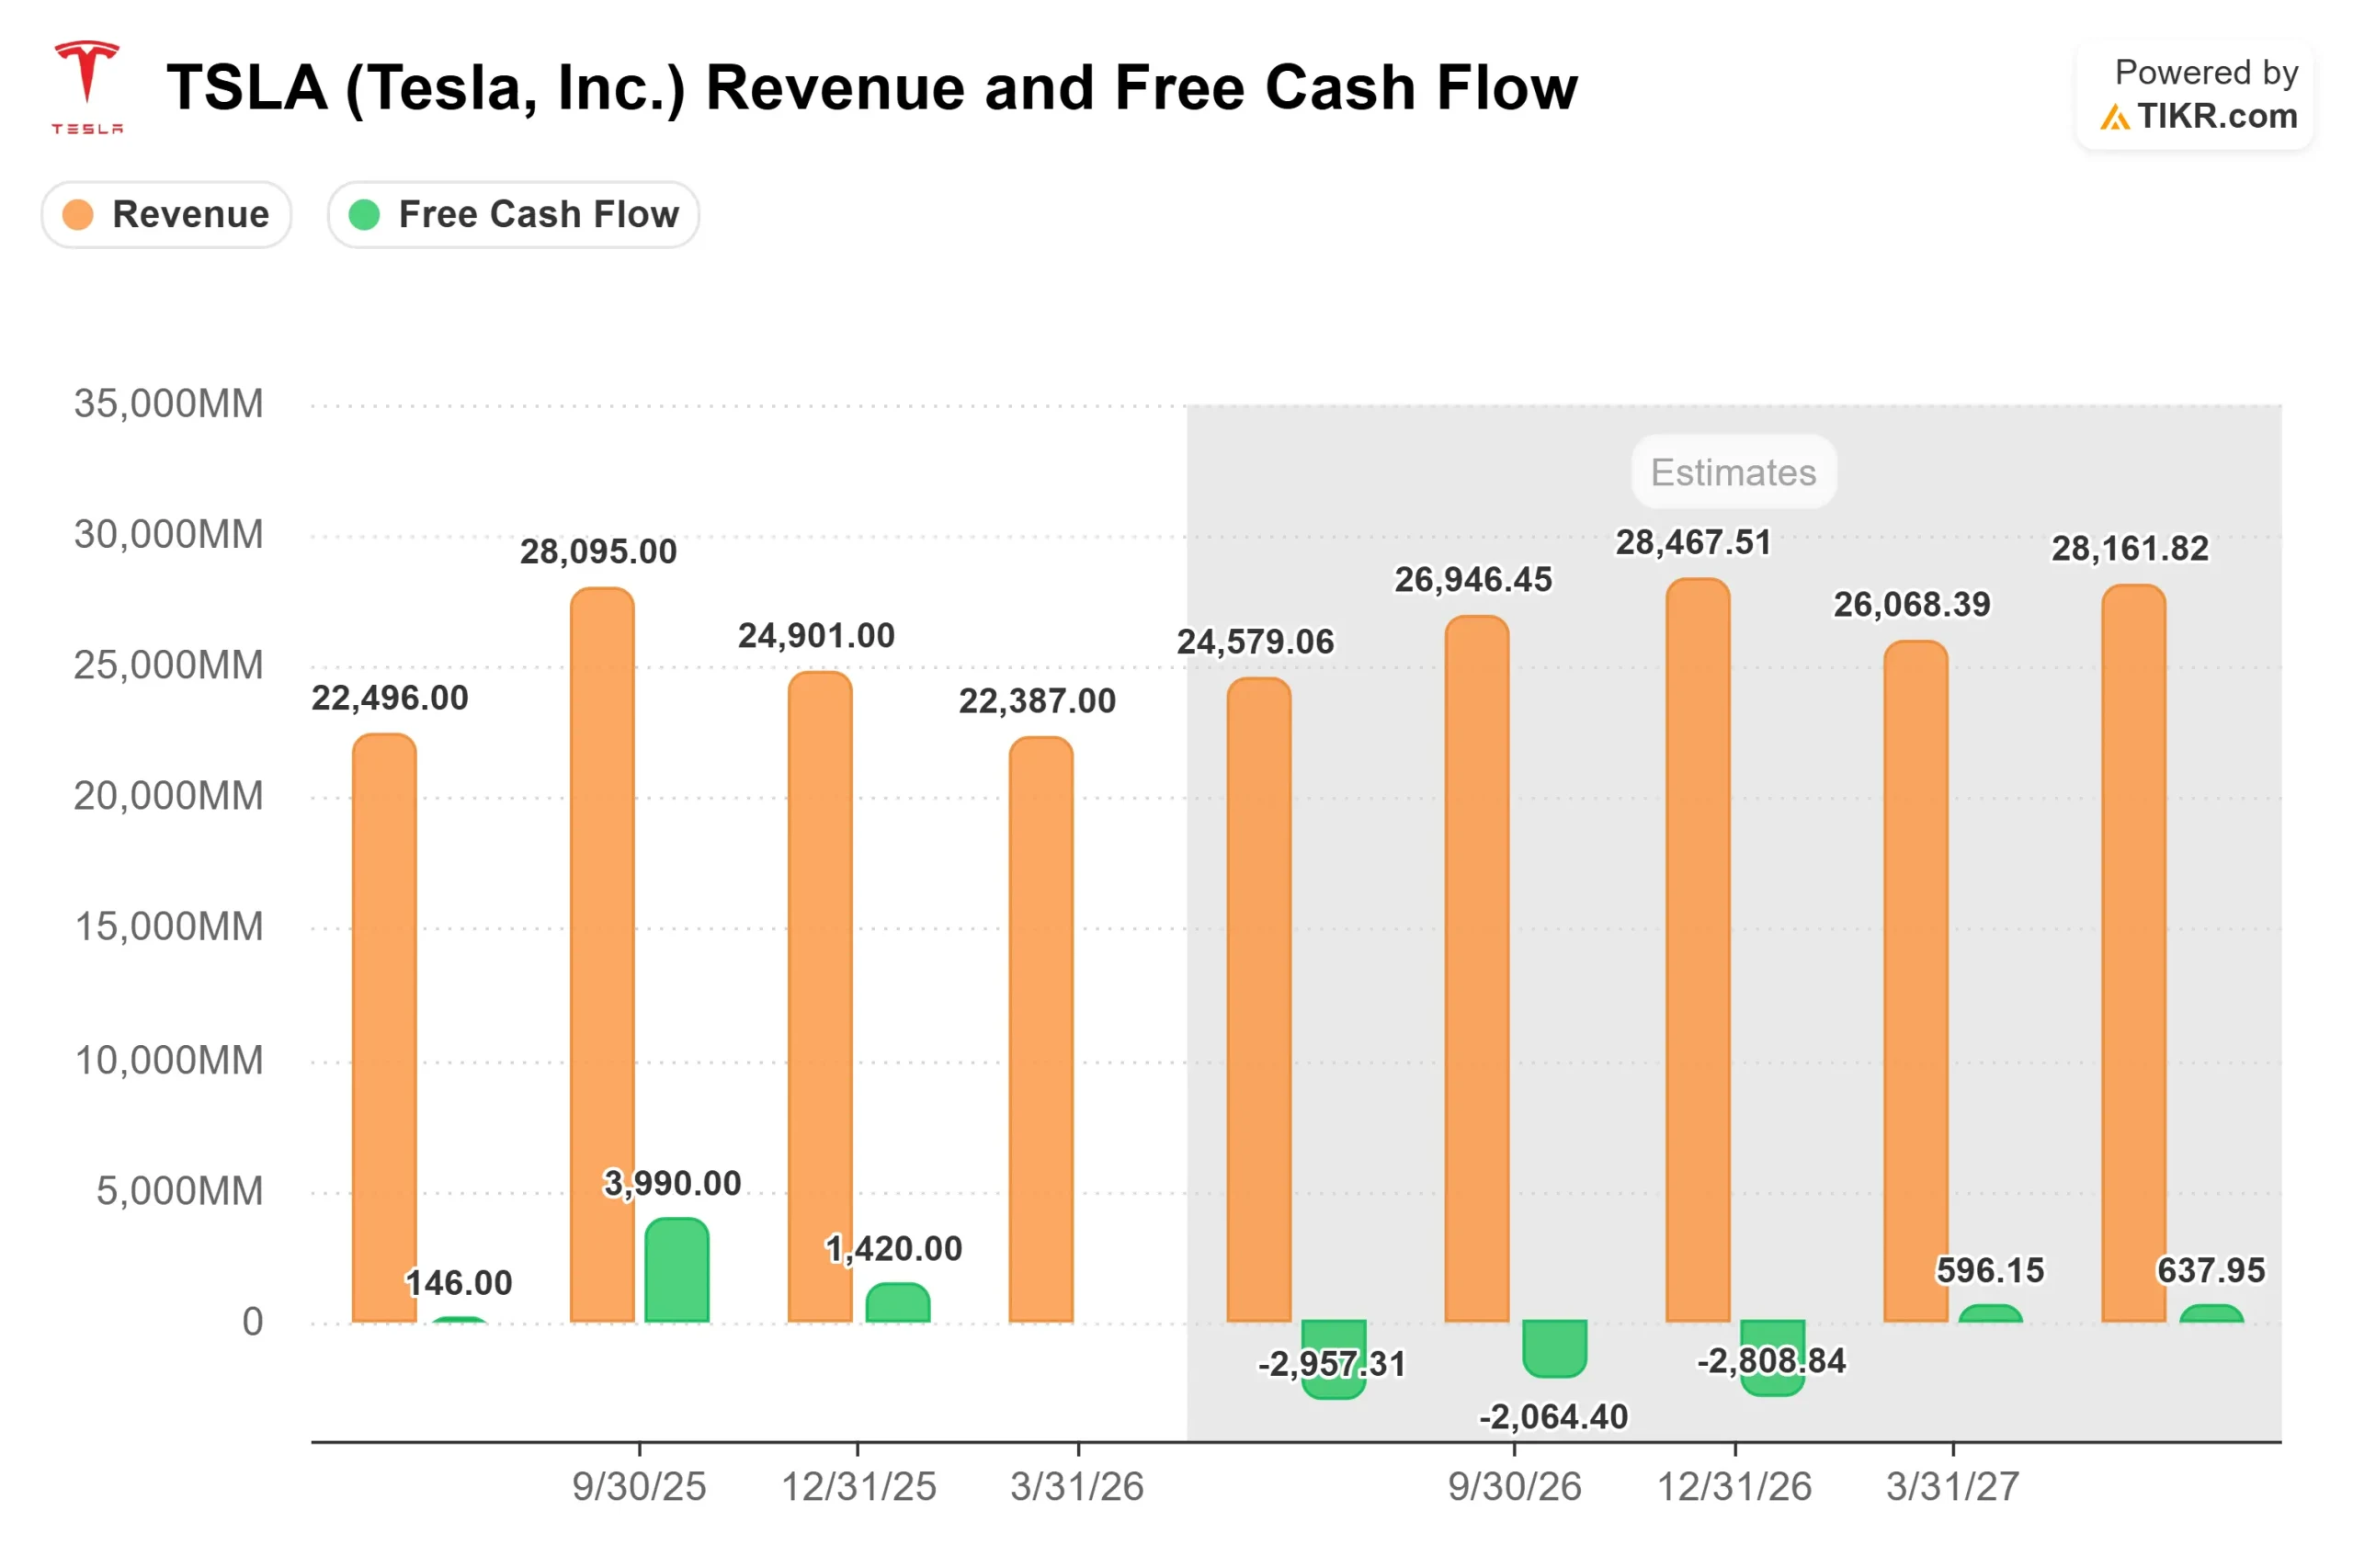
Analysts expect approximately $27.58 billion in total revenue, a 19.5% company-wide gross margin, a 5.4% operating margin, GAAP earnings of $0.36 per share, and non-GAAP earnings of $0.55 per share.
The revenue target would represent growth of roughly 23% from the approximately $22.5 billion reported in Q2 2025.
Yet the projected gross margin is lower than Tesla’s 21.1% company-wide margin in Q1 2026, implying that Wall Street expects some sequential profitability pressure even after the delivery recovery.
| Q2 2026 metric | Analyst consensus | Why it matters |
|---|---|---|
| Total revenue | $27.58 billion | Tests whether delivery growth translated into sales growth |
| Automotive revenue | $20.05 billion | Reveals pricing, product mix, and leasing effects |
| Energy revenue | $3.77 billion | Measures diversification beyond passenger vehicles |
| Total gross margin | 19.5% | Key indicator of pricing and production economics |
| Operating margin | 5.4% | Shows whether AI and Robotaxi expenses are manageable |
| GAAP EPS | $0.36 | Headline earnings benchmark |
| Non-GAAP EPS | $0.55 | Commonly watched Wall Street comparison |
| Operating cash flow | $3.45 billion | Indicates cash generated by existing operations |
| Capital expenditure | $6.70 billion | Reflects Tesla’s AI, factory, and fleet investment |
| Free cash flow | Negative $3.25 billion | Tests whether the AI transition is becoming cash-intensive |
The central earnings conflict is clear: Tesla’s operating businesses may be recovering, but the company is spending faster than those businesses are generating cash.
Investors should avoid treating any single EPS beat as decisive. Stock-based compensation, regulatory credits, digital-asset movements, and one-time manufacturing benefits can all affect reported earnings.
The higher-quality signals will come from:
- Automotive margin excluding regulatory credits
- Operating cash flow
- Capital expenditure
- Robotaxi operating disclosures
- Energy-storage profitability
Why Tesla’s Q2 Delivery Beat May Not Guarantee an Earnings Beat
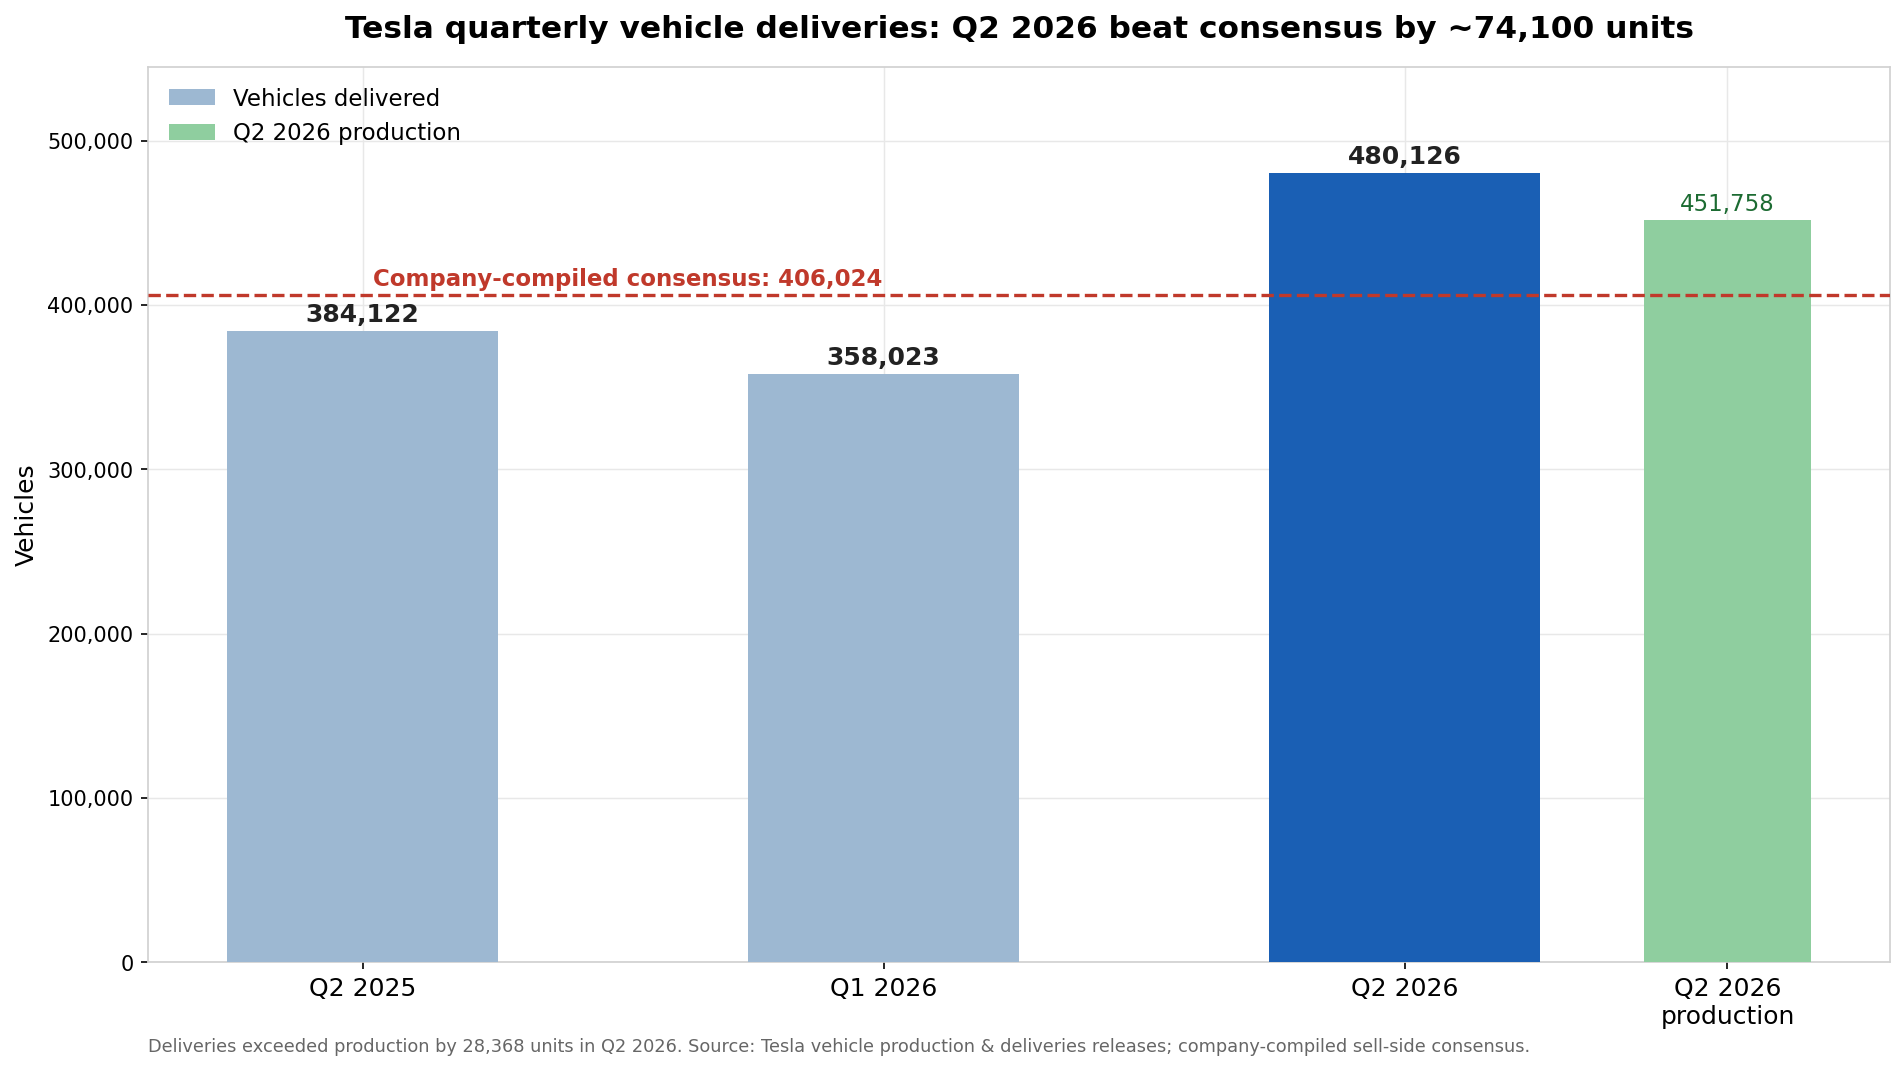
Tesla delivered 480,126 vehicles during Q2 2026, including 467,762 Model 3 and Model Y vehicles and 12,364 other models.
That was approximately 25% above the 384,122 vehicles delivered in Q2 2025 and 34% above the 358,023 delivered in Q1 2026.
The result also exceeded Tesla’s company-compiled sell-side delivery consensus of 406,024 vehicles by approximately 74,100 vehicles, or more than 18%.
It was one of the clearest positive operating surprises entering the earnings report.
However, deliveries do not reveal the price or profitability of each vehicle.
Tesla produced 451,758 vehicles during the quarter, meaning deliveries exceeded production by 28,368 units. All else equal, this suggests Tesla reduced part of its existing vehicle inventory, which may help working capital and factory utilization.
It does not reveal whether that inventory was sold using discounts, lower-cost financing, free charging, or other incentives.
Investors therefore need to evaluate the delivery result through four additional metrics:
- Automotive revenue per delivery
- Automotive gross margin excluding regulatory credits
- Cash generated from vehicle operations
- Finished-goods inventory at the end of the quarter
A simple approximation can be calculated as:
Automotive revenue per delivery = automotive revenue ÷ total deliveries
Using the consensus automotive revenue estimate of $20.05 billion and 480,126 deliveries produces approximately $41,760 of automotive revenue per delivered vehicle.
This is only a directional calculation because automotive revenue also includes leasing and other items. Still, a significant miss below that level could indicate unfavorable pricing or product mix.

Can Tesla Q2 Earnings 2026 Robotaxi Momentum Offset EV Margin Pressure?
Tesla’s Robotaxi operation has moved beyond a demonstration-only concept.
According to Tesla’s public support information, autonomous rides are available in limited areas of Austin, Dallas, Houston, and Miami. The service currently uses Model Y vehicles, operates from 6 a.m. to 2 a.m. Central Time, and allows customers to request rides through Tesla’s Robotaxi app.
That represents meaningful product progress. Tesla is now operating a consumer-facing mobility service rather than merely describing a future autonomous network.
Nevertheless, Robotaxi momentum and Robotaxi profitability are not the same thing.
Tesla has not yet publicly provided enough information for investors to calculate the service’s unit economics.
The four-city footprint demonstrates technical and regulatory progress, but investors still need data on:
- Ride volume
- Vehicle utilization
- Remote-support costs
- Insurance expenses
- Fleet depreciation
- Charging costs
- Cleaning and maintenance expenses
- Empty miles between passengers
What Robotaxi Metrics Should Investors Demand?
| Robotaxi metric | What it would reveal |
|---|---|
| Paid rides per week | Actual consumer adoption and network scale |
| Active fleet size | Capital required to expand each city |
| Rides per vehicle per day | Asset utilization and revenue efficiency |
| Revenue per paid mile | Pricing power and local market competitiveness |
| Empty miles between trips | Network efficiency and operating cost |
| Remote-assistance rate | Remaining dependence on human intervention |
| Insurance cost per mile | Real-world safety and liability economics |
| Contribution margin per ride | Whether scaling creates or consumes cash |
Robotaxi could eventually carry structurally higher margins than vehicle manufacturing because software-driven revenue can be earned repeatedly from the same vehicle.
The theoretical model is attractive:
Robotaxi contribution profit = ride revenue − energy − cleaning − insurance − maintenance − fleet depreciation − remote support
The challenge is that nearly every input remains uncertain.
A rapidly expanding Robotaxi fleet could initially reduce consolidated free cash flow because Tesla must manufacture or acquire fleet vehicles, build charging and cleaning infrastructure, fund insurance reserves, and maintain remote-support operations.
Robotaxi may support Tesla’s long-term valuation before it materially supports quarterly earnings.
For Q2, Robotaxi is more likely to influence expectations than reported profit.
A credible bullish update would include measurable service growth, a clear expansion schedule, improving intervention data, and evidence that each deployed vehicle can produce attractive revenue relative to its cost.
A vague statement about future geographic coverage would be less valuable than a small set of auditable operating metrics.
Are Tesla’s EV Margins Actually Falling?
The answer depends on which comparison investors use.
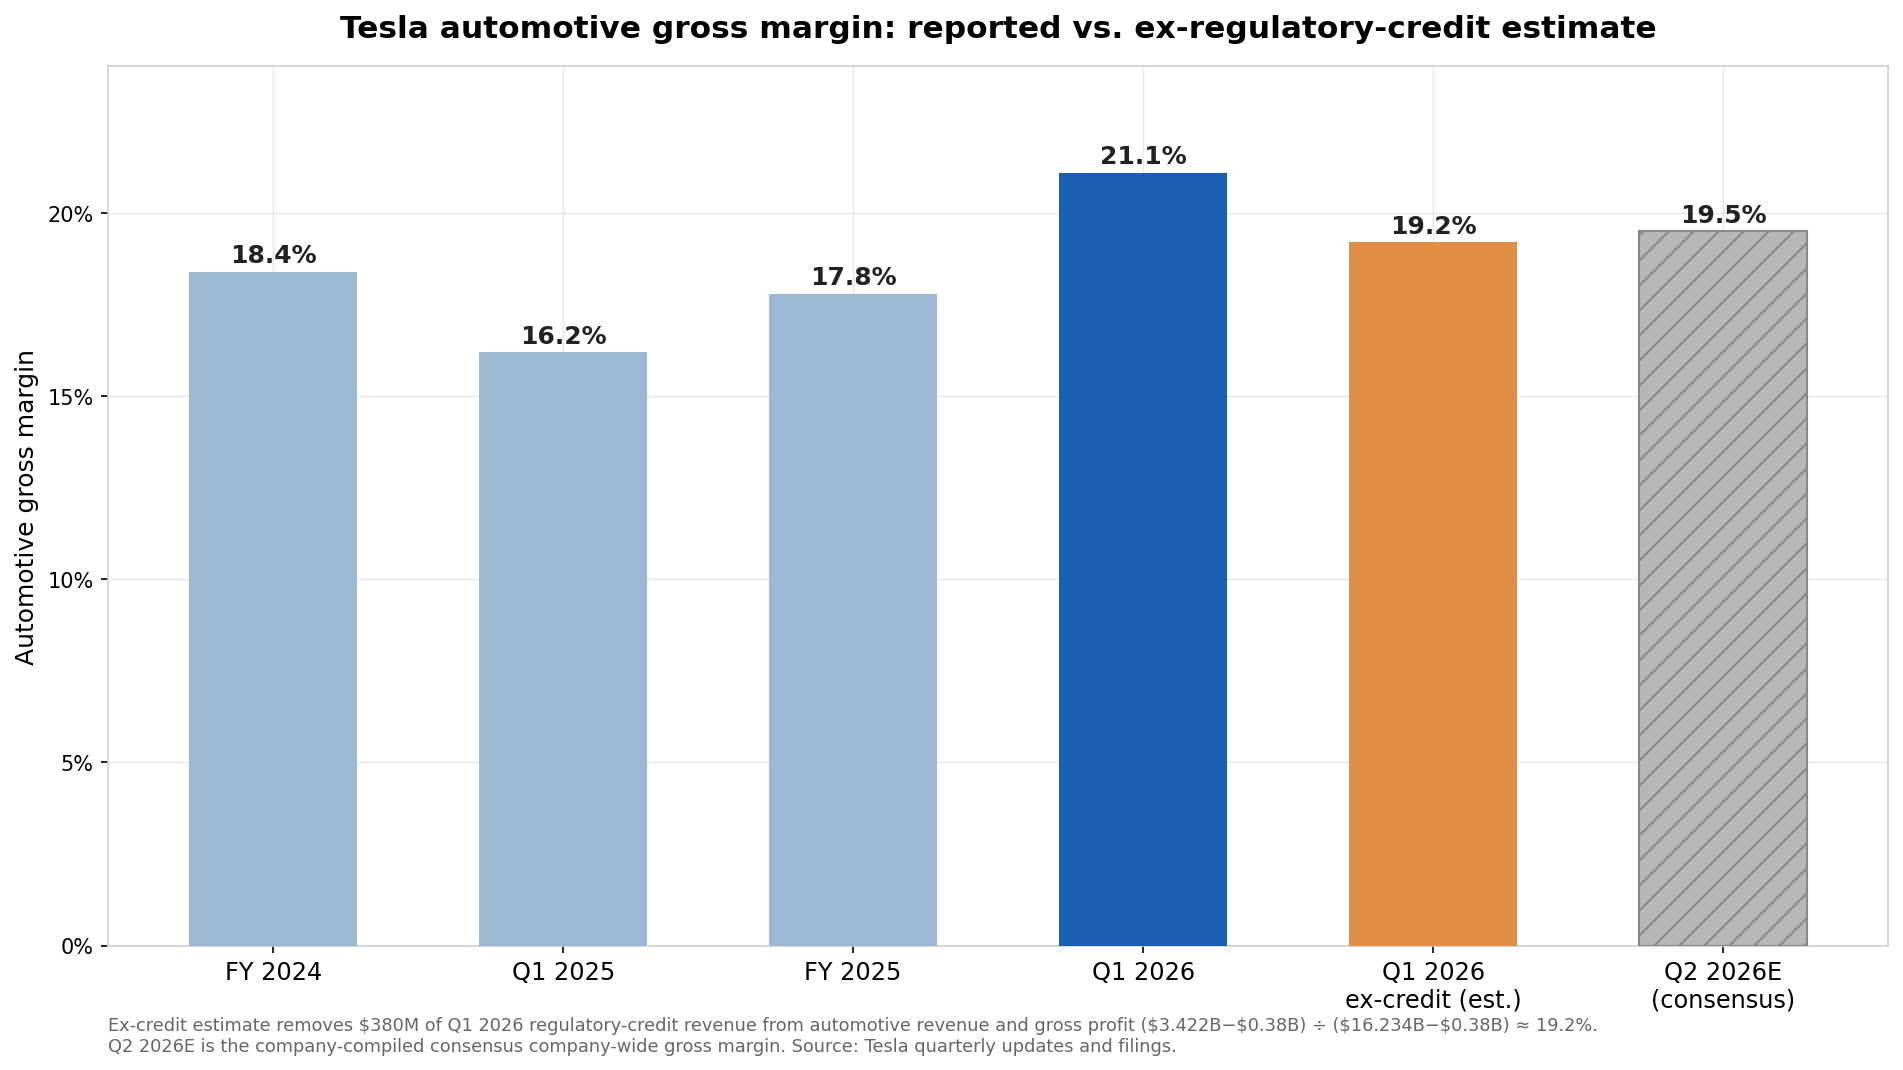
Tesla reported a 21.1% total automotive gross margin in Q1 2026, up from 16.2% in Q1 2025. Total company gross margin was also 21.1%.
Automotive regulatory-credit revenue fell 36% year over year to $380 million, meaning the margin improvement was not simply the result of higher credit sales.
An approximate Q1 automotive margin excluding regulatory credits can be calculated by removing the $380 million of credit revenue from automotive revenue and gross profit:
Estimated ex-credit margin ≈ ($3.422B − $0.380B) ÷ ($16.234B − $0.380B)
That produces an approximate margin of 19.2%.
This is not an officially reported Tesla metric, but it illustrates that Q1 vehicle profitability was stronger than the headline concerns surrounding the company suggested.
The risk in Q2 is sequential compression.
Wall Street’s expected company-wide gross margin of 19.5% is approximately 160 basis points below Q1’s 21.1%.
Tesla does not publish a consensus automotive margin in its earnings-consensus table, so the actual EV-margin outcome will only become clear when the shareholder update and filing are released.
Several factors could pressure the Q2 result:
- Lower revenue per vehicle caused by pricing or financing incentives
- A heavier mix of lower-priced Model 3 and Model Y vehicles
- Lower regulatory-credit revenue
- Higher commodity, tariff, or electronics costs
- Robotaxi fleet expenses recorded before substantial ride revenue
- Depreciation from new AI and manufacturing infrastructure
- Warranty reserves or vehicle-service costs
- Continued investment in new products and production lines
Several factors could support margins:
- Higher factory utilization following the Q1 delivery slowdown
- The 28,368-unit gap between deliveries and production
- Lower battery-material costs
- Software and Full Self-Driving revenue recognition
- Manufacturing efficiency improvements
- Better energy-storage margins
- A more favorable geographic or trim mix
Tesla’s 2025 filings show why regulatory credits deserve separate attention.
Total automotive gross margin declined to 17.8% for full-year 2025 from 18.4% in 2024, with lower regulatory-credit revenue identified as one contributor.
In Q1 2026, credit revenue declined again as governmental and regulatory changes restricted some credit programs.

Energy Storage Could Be Tesla’s Most Important Earnings Buffer
The strongest underappreciated part of Tesla’s Q2 operating update may be energy storage.
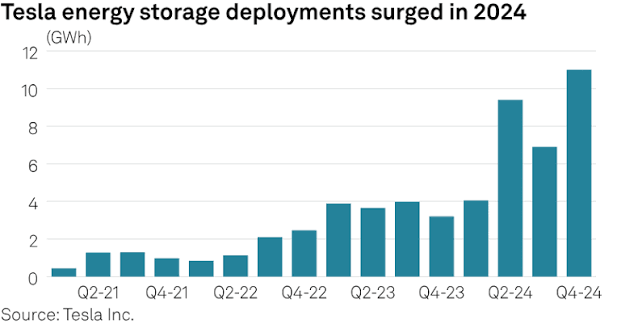
Tesla deployed 13.5 GWh of energy-storage products during the second quarter, compared with 8.8 GWh in Q1 2026 and 9.6 GWh in Q2 2025.
That represents growth of approximately 53% sequentially and 41% year over year.
Energy matters because it provides diversification away from consumer EV demand and may carry favorable margins when factories operate efficiently.
In Q1 2026, Tesla’s energy-generation and storage segment produced a 39.5% gross margin, up from 28.8% one year earlier, supported by lower average Megapack and Powerwall costs and temporary tariff-related benefits.
The Q2 consensus calls for $3.77 billion in energy revenue.
Investors should compare deployment growth with revenue and gross-profit growth:
- Deployments up, revenue up, margins stable: Strong underlying result
- Deployments up faster than revenue: Possible pricing or mix pressure
- Revenue and margins both accelerate: Major positive earnings offset
- Margins fall sharply: Q1 profitability may have included temporary benefits
A strong energy quarter would not eliminate weakness in the automotive segment, but it could demonstrate that Tesla is becoming a broader electrification and infrastructure company.

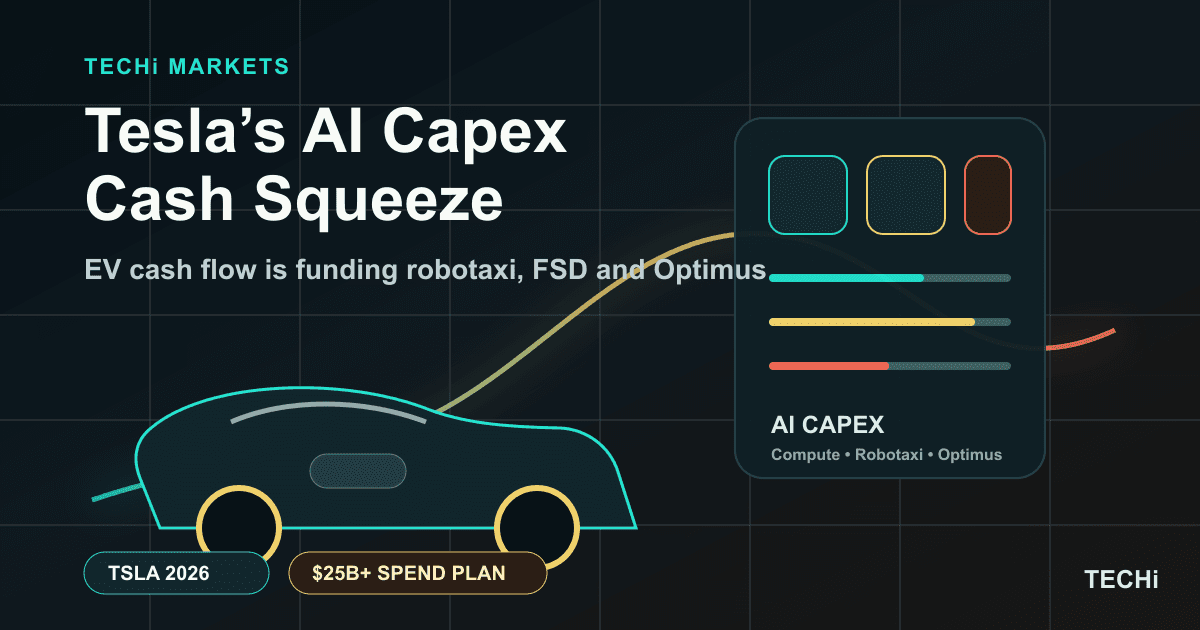
Tesla’s $25 Billion Spending Plan Raises the Stakes
Tesla’s Q1 filing stated that the company expects more than $25 billion of capital expenditure in 2026.
Planned spending includes:
- AI computing infrastructure
- Data centers
- Manufacturing facilities
- Research facilities
- Company-operated AI-enabled assets
- Service locations
- Charging infrastructure
- Robotaxi fleet expansion
The Q2 analyst consensus includes:
- Approximately $3.45 billion of operating cash flow
- Approximately $6.70 billion of capital expenditure
- Approximately negative $3.25 billion of free cash flow
This means Tesla could report respectable accounting earnings while consuming a substantial amount of cash.
The company has the balance-sheet capacity to invest. Tesla ended Q1 with approximately $44.74 billion in cash, cash equivalents, and short-term investments.
However, a large cash balance does not make investment returns irrelevant.
Investors need to see that the spending is creating measurable operating assets rather than continuously extending product timelines.
Tesla’s R&D expense rose 38% year over year in Q1 to $1.95 billion, primarily because of spending on AI and other product programs.
Capital expenditure reached $2.49 billion in Q1, but the Q2 consensus implies a dramatic acceleration to approximately $6.70 billion.
How Should Investors Evaluate Tesla’s AI Spending?
Investors can apply a three-stage framework:
- Infrastructure stage: Tesla buys computing hardware, builds facilities, and deploys fleet vehicles.
- Utilization stage: Robotaxi rides, AI training workloads, and manufacturing assets begin operating at higher capacity.
- Monetization stage: Revenue and contribution profit grow faster than ongoing capital requirements.
Tesla appears to be moving from the infrastructure stage toward the utilization stage.
Q2 commentary must show how quickly the company can reach monetization.

Tesla Q2 Earnings Bull, Base, and Bear Scenarios
| Scenario | Possible Q2 outcome | Likely interpretation |
|---|---|---|
| Bull case | Revenue above $28 billion, gross margin above 20.5%, positive automotive margin surprise, measurable Robotaxi operating metrics, and controlled cash burn | Delivery rebound is profitable and autonomy spending is becoming measurable |
| Base case | Revenue of $27–28 billion, gross margin of 19–20%, negative free cash flow near consensus, and mostly qualitative Robotaxi updates | Core business stabilizes, but Robotaxi remains primarily a valuation narrative |
| Bear case | Revenue below $26.5 billion, gross margin below 18.5%, weak ex-credit automotive margin, capex above expectations, and limited Robotaxi detail | Strong deliveries may have been achieved at an expensive economic cost |
These ranges are analytical scenarios rather than company guidance.
Tesla could beat EPS while falling into the base or bear case if the improvement comes from credits, accounting items, or temporary cost benefits.
Conversely, a modest EPS miss could be overlooked if automotive margins remain resilient and Robotaxi data show improving economics.
Seven Questions Investors Should Ask After the Report
A disciplined earnings review should proceed in the following order:
- Did automotive revenue grow as quickly as deliveries?
A large gap could indicate lower revenue per vehicle.
- What was automotive gross margin excluding regulatory credits?
This remains the cleanest measure of the core vehicle business.
- How much regulatory-credit revenue was recognized?
Credits can materially affect automotive gross profit despite having limited associated cost.
- Why did capital expenditure increase?
Separate spending on revenue-producing Robotaxi vehicles from longer-duration infrastructure projects.
- How many paid Robotaxi rides were completed?
Geographic expansion is less informative without actual service volume.
- Is the company-operated fleet producing attractive utilization?
Fleet size, rides per vehicle, and empty miles determine capital efficiency.
- What does management expect for the second half of 2026?
Guidance on vehicle demand, AI spending, Cybercab development, and energy deployments could matter more than Q2 EPS.
Investors can use SimianX AI to monitor the earnings release, management commentary, news sentiment, and post-report price action together rather than relying on a single headline number.
SimianX AI’s research approach emphasizes earnings frameworks, AI-capex risk, and real-time stock analysis, making a multi-metric approach especially useful for a company as complex as Tesla.
Key Risks to the Tesla Investment Thesis
Robotaxi Execution Risk
Operating in four cities does not automatically prove that the service can scale nationally.
Local mapping, safety validation, insurance rules, fleet support, and regulatory approvals may create city-by-city bottlenecks.
EV Demand and Pricing Risk
Q2 deliveries were strong, but Tesla must show that demand did not depend on unsustainably expensive incentives.
Revenue per delivery and the ex-credit automotive margin will provide the clearest evidence.
Capital-Intensity Risk
A company-operated Robotaxi network may require Tesla to retain vehicles on its own balance sheet rather than receiving cash from customers at delivery.
This could change the company’s working-capital and depreciation profile.
Regulatory-Credit Risk
Tesla acknowledged in its Q1 filing that recent governmental actions have restricted certain automotive-credit programs.
Continued declines would remove a high-margin revenue source.
Valuation Risk
Tesla is increasingly valued on future autonomy and robotics cash flows rather than present automotive earnings.
When expectations are high, even genuine operating progress may be insufficient if it falls below the market’s assumed timeline.
FAQ About Tesla Q2 Earnings 2026
When Will Tesla Report Q2 2026 Earnings?
Tesla is scheduled to release Q2 2026 financial results after the market closes on July 22, 2026.
Management’s question-and-answer webcast is scheduled for 5:30 p.m. Eastern Time.
What Is the Most Important Metric in Tesla’s Q2 Earnings?
The most important financial metric is likely automotive gross margin excluding regulatory credits.
It will show whether Tesla’s strong delivery growth translated into profitable vehicle sales or required costly pricing and financing support.
Will Tesla Robotaxi Revenue Materially Affect Q2 Earnings?
Robotaxi is more likely to affect forward expectations than Q2 profit.
Tesla has a real consumer service operating in limited parts of four cities, but the company has not yet published enough ride-volume and unit-economics data to establish a material earnings contribution.
Can Tesla’s Energy Business Offset Weaker EV Margins?
Energy storage can provide a meaningful partial offset.
Tesla deployed 13.5 GWh during Q2, up strongly both sequentially and year over year, but investors must determine whether Q1’s unusually strong energy margin continued.
What Could Cause Tesla Stock to Fall After an Earnings Beat?
Tesla shares could decline despite an EPS beat if automotive margins miss expectations, free cash flow is worse than forecast, capital expenditure rises without clear returns, or management provides limited evidence of Robotaxi commercialization.
Conclusion
The Tesla Q2 earnings 2026 report is not a simple vehicle-delivery story.
Tesla’s 480,126 deliveries create a strong starting point, while 13.5 GWh of energy deployments and a four-city Robotaxi footprint demonstrate substantial operating momentum.
The decisive issue is economic quality.
Investors need to determine whether vehicle growth protected automotive margins, whether energy profitability remained strong, and whether Robotaxi is advancing from technical validation toward scalable unit economics.
They must also judge whether more than $25 billion of planned 2026 capital expenditure is building future high-margin revenue or placing increasing pressure on free cash flow.
A strong report would combine:
- Resilient automotive margins
- Disciplined capital spending
- Strong energy-storage profitability
- Measurable Robotaxi adoption
- Improving autonomous-fleet economics
A weak report would reveal that delivery growth required margin sacrifices while autonomy remained expensive and difficult to quantify.
Rather than reacting only to headline EPS, use SimianX AI to evaluate Tesla’s filings, earnings-call signals, market sentiment, and post-earnings price behavior as one connected investment picture.
Related Reading
- Alphabet Q2 Earnings 2026: Can Gemini, Cloud Justify Capex?
- Meta Compute 2026: Can Excess AI Capacity Drive Revenue?
- AI Momentum Unwind 2026: Why Semiconductor Stocks Fall