
What the August 2026 CPI Report Could Mean for Markets
The August 2026 CPI report lands on Friday, September 11, at 8:30 a.m. ET, and it may be the most consequential inflation print of the year. Five days later the Federal Reserve decides whether to raise rates for the first time in this cycle. Futures price that hike at roughly two-in-three odds. Brent crude closed above $105 on Thursday. The 10-year Treasury yield sits at 4.91%, its highest since 2023. The S&P 500 has fallen four sessions in a row.
This preview sets out what the Street expects and why the headline and core numbers will diverge. It then maps, scenario by scenario, how stocks, bonds, the dollar, gold and crypto are likely to react. Every figure below is sourced and dated so the page stays useful as a reference after the print.
August 2026 CPI forecast: the consensus numbers
| Measure | Consensus (Aug 2026) | July 2026 actual | June 2026 actual |
|---|---|---|---|
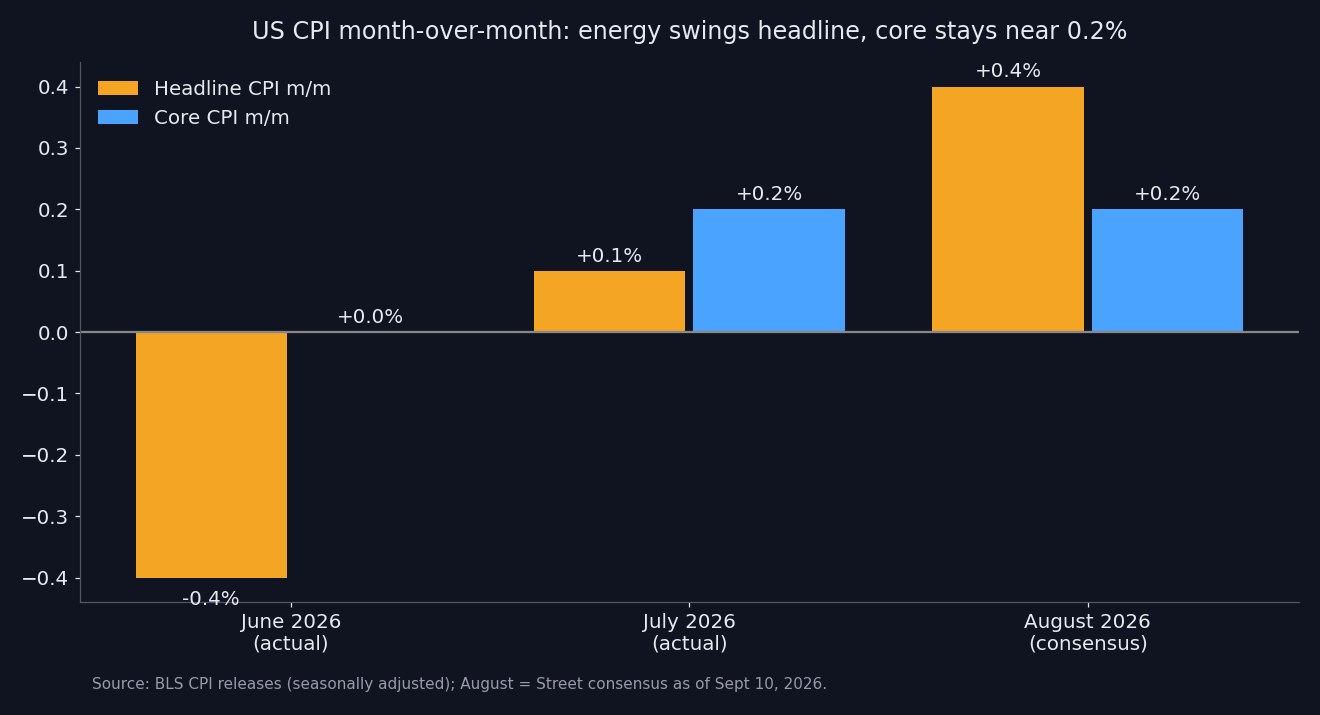
| Headline CPI, m/m | +0.4% | +0.1% | −0.4% |
| Headline CPI, y/y | 3.4% | 3.4% | — |
| Core CPI, m/m | +0.2% | +0.2% | 0.0% |
| Core CPI, y/y | 2.4% | 2.5% | 2.6% |
Sources: BLS July 2026 CPI release, Street consensus as compiled on September 10, 2026.
The independent trackers cluster tightly around that consensus. The Cleveland Fed inflation nowcast puts headline at 3.38% year over year and core at 2.38%. Kalshi's market-implied readings are 3.39% and 2.38%. When the Street, a Fed nowcast and a prediction market agree to within five hundredths of a point, the informational value of the release shifts to the detail. Specifically, it shifts to whether core rounds to 0.2% or 0.3%.
Why headline CPI jumps while core CPI cools
The two numbers are moving in opposite directions for different reasons.
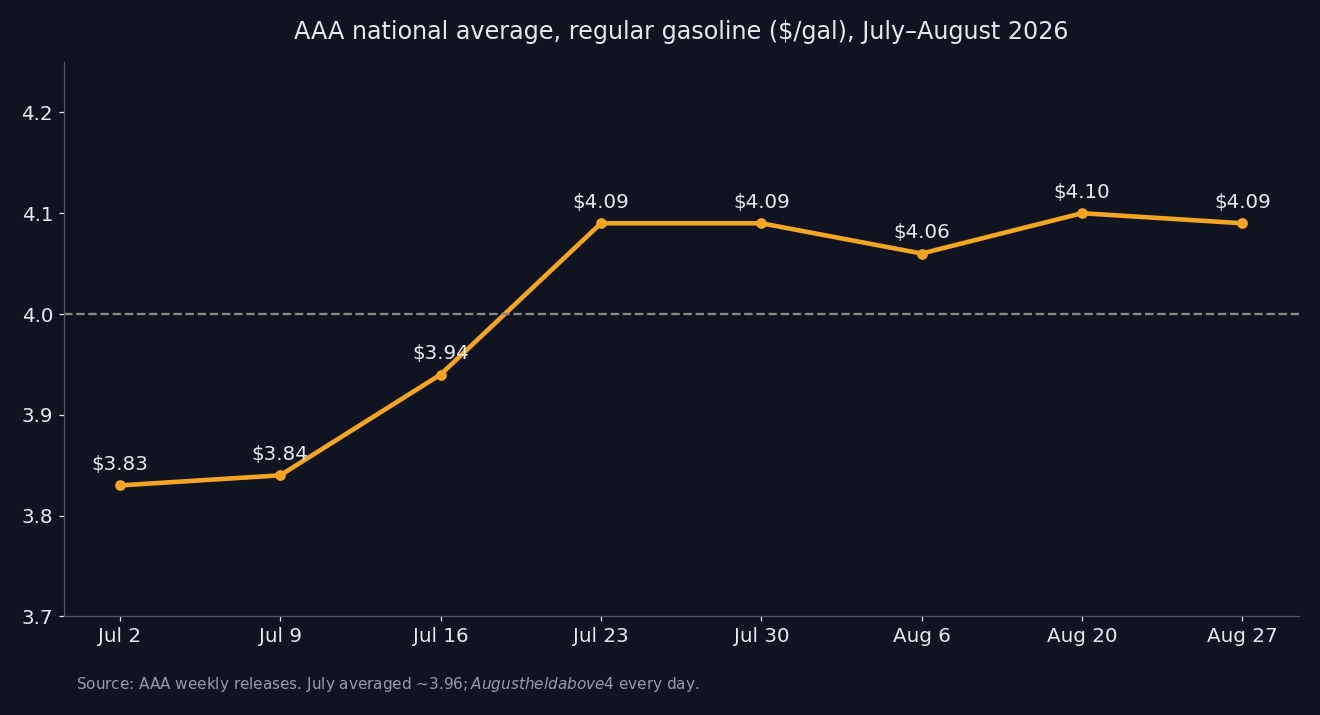
Headline is an energy story. The conflict around the Strait of Hormuz has cut tanker throughput to about 4.9 million barrels a day from 21.6 million before the war. According to AAA, the national average for regular gasoline stayed above $4 a gallon every single day in August, a first for the month and a record August overall. July averaged roughly $3.96 across AAA's weekly readings. August averaged just under $4.09. That is about 3% higher at the pump before seasonal adjustment, a sharp turn from July, when the CPI gasoline index fell 2.9%. Energy is already up 14.7% year over year in the CPI, and gasoline alone is up 24.6%.
Core is a base-effect and shelter story. In August 2025, core CPI rose 0.3% month over month. That month now drops out of the 12-month window. If August 2026 core prints 0.2%, the annual rate slips from 2.5% to 2.4% even though nothing has really cooled. Shelter, the biggest core component, has been soft: the shelter index rose only 0.1% in July, with owners' equivalent rent and rent each up 0.3%.
The components that decide the rounding
A 0.2% versus 0.3% core print often comes down to a handful of volatile lines. These are the ones to watch at 8:30 a.m.:
- Airline fares. Up 2.2% in July and 25.5% year over year, as jet fuel costs flow straight through. Another jump would add a few hundredths to core by itself.
- Medical care services. Rose 0.6% in July after a −0.1% June. A second hot month would suggest a trend rather than noise.
- Used cars and trucks. +0.4% in July. Wholesale auction prices usually lead CPI used-car prices by one to two months.
- Motor vehicle insurance. −0.3% in July after −2.0% in June. The disinflation here has been doing a lot of quiet work for core.
- Apparel and household goods. The July FOMC minutes note that several officials believe tariff pass-through into prices is "largely complete". A goods surprise would challenge that view directly.
The PPI already hinted at the mix
Thursday's producer price index offered a preview of the same split. Final-demand PPI rose 0.4% in August, exactly as expected, and is up 5.4% year over year. More than three-quarters of the gain came from energy, which jumped 4.2%, with diesel up 24.1%. Core PPI, however, rose only 0.2% against a 0.3% forecast. Services were up just 0.1%.
Economists translate several PPI inputs, notably airfares, medical services and portfolio-management fees, into forecasts for the Fed's preferred PCE gauge. A soft services PPI slightly lowers the risk of a hot core CPI. It does not remove it. Much of the energy shock also reaches consumer prices with a lag, through freight, delivery fees and airfares.
What the Fed is weighing before September 16
The context is unusual. The Fed has not been debating when to cut. It has been debating whether to hike.
- Policy rate: 3.50%–3.75%, unchanged at the July 28–29 meeting.
- The vote: 9–3. Beth Hammack, Neel Kashkari and Lorie Logan dissented in favor of a 25 bp hike. Under Chair Kevin Warsh, three hawkish dissents is a strong signal.
- The minutes: several participants argued that "financial conditions might not currently be sufficiently restrictive". Staff still projected that inflation would decline over the second half of the year.
- The labor market: August payrolls rose 162,000, triple the 53,000 forecast, with unemployment steady at 4.1%. That removed the "the labor market is cracking" argument for staying on hold.
- Market pricing: CME FedWatch showed about 69% odds of a September hike on Thursday. Polymarket showed about 63%, up from roughly 52% before the jobs report.
The Fed's dilemma is textbook supply-shock economics. An oil shock raises prices but also taxes consumers, which eventually slows demand. Central banks are taught to "look through" energy, as long as it stays out of core and out of expectations. Tomorrow's core number is the cleanest test of whether it has leaked. That is why a 0.1-point difference in core matters more than a 0.3-point difference in headline.
Scenario map: how markets could react to each print
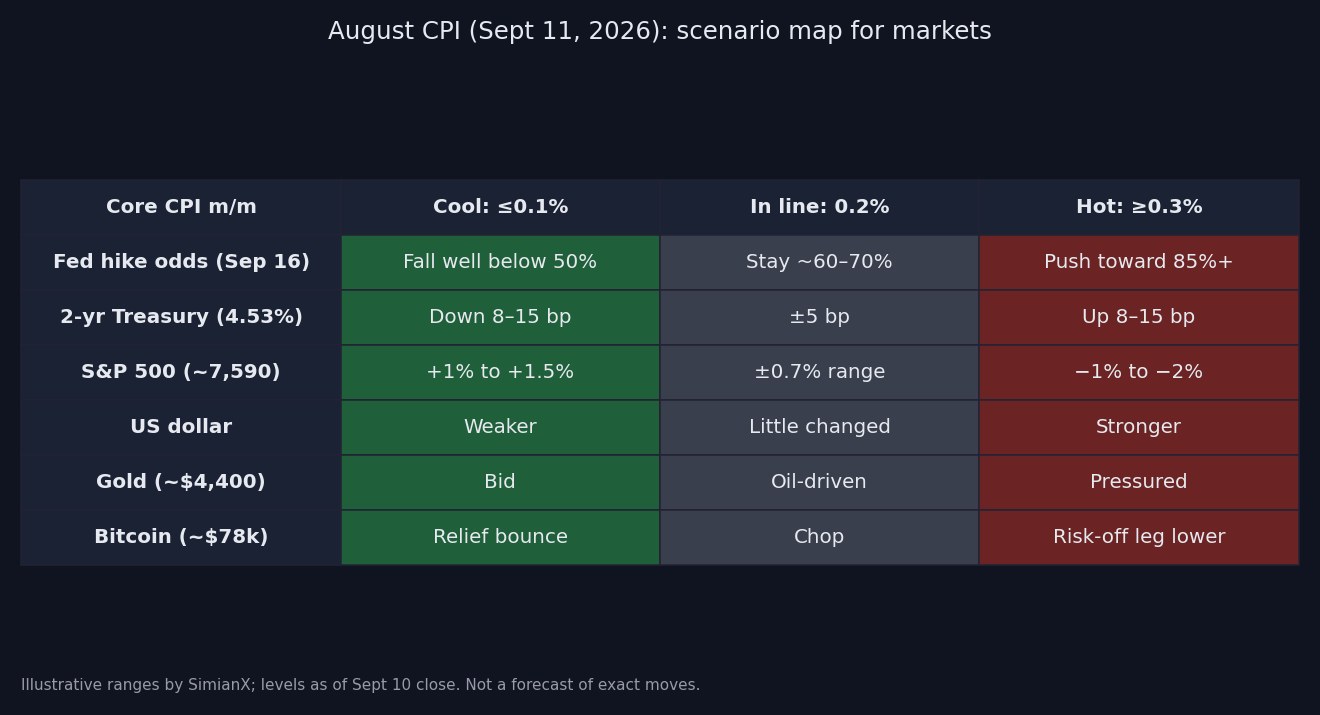
Options markets price an S&P 500 move of roughly ±66 points, about 0.9%, for Friday. That is a little above the ±0.6%–0.7% the index has averaged on CPI days over the past year. Positioning data point to support near 7,600 and resistance near 7,680, then 7,750.
Scenario 1 — Hot: core CPI at 0.3% or higher
This is the market's biggest fear, because it would confirm that energy is spreading into everything else.
- Fed: hike odds would likely push toward near-certainty for September 16. Traders would also start pricing a second move.
- Treasuries: the 2-year yield, the most policy-sensitive point on the curve, could climb 8–15 bp from 4.53%. The 10-year would test 5%, a level not seen since 2007.
- Stocks: long-duration growth names would take the hardest hit. Mega-cap tech such as NVIDIA, Apple and Microsoft trade on discounted future cash flows. Small caps would also be at risk, given their heavier reliance on floating-rate debt. A 1%–2% S&P 500 decline would be consistent with past hot surprises.
- Dollar: stronger, as rate differentials widen in its favor.
- Gold: under pressure from higher real yields. Traders flag $4,300 and then $4,200 as support.
- Crypto: Bitcoin has been trading below $80,000 and behaves like a high-beta liquidity asset around CPI. A hot print would likely extend its slide, with Ethereum and smaller tokens falling further.
Scenario 2 — In line: headline 0.4%, core 0.2%
This is the most likely outcome and, paradoxically, the least resolving.
- Fed: hike odds would stay in the 60%–70% range, and the decision would effectively pass to the September 16 statement and dot plot.
- Markets: expect a knee-jerk relief move, because a hot core print was the priced-in tail risk. It would then fade back into the range as traders refocus on oil. The July CPI followed a similar pattern: an in-line print lifted stock futures and pulled yields lower.
- Sectors: energy producers such as ExxonMobil and Chevron would keep trading on crude rather than on CPI.
Scenario 3 — Cool: core CPI at 0.1% or lower
This is the least likely outcome and potentially the most explosive, because positioning is leaning hawkish.
- Fed: hike odds could drop well below 50%. That would give the doves a data-backed case to wait for the oil shock to fade.
- Treasuries: a sharp rally at the front end, with the 2-year down 8–15 bp.
- Stocks: short covering in rate-sensitive growth names and small caps, with a 1%–1.5% S&P 500 gain possible.
- Gold and bitcoin: both would likely rally as real yields and the dollar ease. Traders see $4,500 and then $4,700 as gold's upside tests.
History: the biggest S&P 500 moves on CPI day
Surprises in core, not headline, have historically produced the largest reactions. A reference table of notable releases:
| Release date | Month covered | The surprise | S&P 500 that day |
|---|---|---|---|
| Sept 13, 2022 | Aug 2022 | Core +0.6% vs +0.3% expected | −4.32% |
| Nov 10, 2022 | Oct 2022 | Core +0.3% vs +0.5% expected | +5.54% |
| Nov 14, 2023 | Oct 2023 | Core +0.2% vs +0.3%, headline flat | +1.91% |
| July 11, 2024 | June 2024 | Headline −0.1%, core +0.1% (both soft) | −0.88% (rotation into small caps) |
| Aug 12, 2026 | July 2026 | In line: headline +0.1%, core +0.2% | Futures up, yields lower |
Three lessons stand out:
- A one-tenth core miss can be worth several percent in the index when the Fed's next move is genuinely in play. That was the situation in 2022, and it is the situation now.
- A good number does not guarantee an up day. In July 2024 a soft print triggered a violent rotation out of mega-cap tech into small caps. The index fell even as the equal-weighted market rallied.
- The first five minutes are not the verdict. Algorithms trade the headline. Humans trade the core and the three-month annualized trend, often reversing the first move within the hour.
For a deeper look at how this plays out in digital assets, see our CPI and crypto price-swing playbook. Our July CPI preview and July CPI report analysis show how last month's setup resolved.
A practical CPI-day checklist
- Read core m/m to two decimals. A 0.24% core rounds to 0.2%, but the market will treat it as close to 0.3%. BLS publishes unrounded index levels, so compute the change yourself.
- Check the three-month annualized core rate. This is the trend the Fed actually talks about. A single 0.3% after two soft months reads very differently from a third consecutive firm print.
- Separate energy-sensitive services from the rest. Airfares, delivery and transportation services show pass-through. Shelter and medical show underlying demand.
- Watch the 2-year yield, not the Dow. It reprices Fed expectations instantly and is the best real-time gauge of how the print is being read.
- Size positions for the implied move. With roughly ±0.9% priced for the S&P 500 and bitcoin historically swinging several times that on CPI, stops placed inside the expected range are likely to be run.
If you want an AI second opinion as the numbers hit, SimianX runs multi-agent analysis live. Open a live analysis session on SPY, a mega-cap or BTC and watch technical, sentiment and macro agents reassess the chart in real time. Or let an autopilot apply your risk rules through the volatility. Our Market Pulse feed flags unusual moves across stocks and crypto the moment they happen.
Frequently asked questions
When is the August 2026 CPI report released?
Friday, September 11, 2026, at 8:30 a.m. Eastern Time, published by the U.S. Bureau of Labor Statistics. The next report, for September, follows in mid-October.
What is the consensus forecast for August CPI?
Headline CPI +0.4% month over month and 3.4% year over year. Core CPI, which excludes food and energy, +0.2% month over month and 2.4% year over year.
Why would headline inflation rise while core falls?
Gasoline prices rose in August because of the Strait of Hormuz disruption, which lifts headline CPI. Core falls on a year-over-year basis mainly because a stronger August 2025 reading (+0.3%) drops out of the calculation.
Could the CPI report cause the Fed to raise rates?
Yes. Three FOMC members already voted for a hike in July, and futures price about a two-in-three chance of a 25 bp increase on September 16. A core reading of 0.3% or higher would make a hike very likely. A 0.1% reading would make holding far easier to justify.
How does CPI affect bitcoin and crypto?
Crypto trades as a liquidity-sensitive risk asset. Hotter inflation means higher expected rates and a stronger dollar, which usually push bitcoin lower. Softer inflation tends to do the reverse. CPI-day swings in BTC are typically several times larger than in the S&P 500.
What would a "hot" CPI mean for mortgage rates?
Mortgage rates track the 10-year Treasury, currently 4.91%. A hot core print pushing the 10-year toward 5% would likely lift 30-year mortgage rates further. That would add pressure to a housing market already dealing with high costs.
The bottom line
The consensus is an energy-driven 0.4% jump in headline CPI and a steady 0.2% in core, and on paper that is a manageable outcome. But with a Fed openly debating a hike, the 10-year at multiyear highs and oil above $100, the market's reaction function is asymmetric: a one-tenth miss to the upside in core probably matters more than any other outcome tomorrow. Read the core number to two decimals, watch the 2-year yield, and give the first five minutes time to settle.
This article is for informational purposes only and is not investment advice. Market levels are as of the September 10, 2026 close.