
Hot Core, Rising Stocks: Grading Our August CPI Preview
The August 2026 CPI report is out, and it did the one thing the market feared most. Core inflation came in a tenth hotter than forecast. The market then did the one thing we said it probably would not: it rallied. The S&P 500 closed up 0.86% at 7,656.98, ending a four-day losing streak, even as odds of a Federal Reserve rate hike next week jumped to about 90%.
On September 10 we published a detailed preview of the August CPI, with numeric forecasts, a scenario map and a checklist. This follow-up grades that preview line by line. We show what we got right and what we got wrong, and, more usefully, why the wrong calls were wrong. A forecast that isn't graded afterward is only an opinion.
August 2026 CPI report: the numbers
| Measure | Consensus | Actual (Aug 2026) | July 2026 |
|---|---|---|---|
| Headline CPI, m/m | +0.4% | +0.4% | +0.1% |
| Headline CPI, y/y | 3.4% | 3.4% | 3.4% |
| Core CPI, m/m | +0.2% | +0.3% | +0.2% |
| Core CPI, y/y | 2.4% | 2.4% | 2.5% |
Source: U.S. Bureau of Labor Statistics, CPI release of September 11, 2026.
The headline and year-over-year numbers landed exactly on consensus. The miss was in one place: core rose 0.3% month over month, not 0.2%. At 2.4%, the annual core rate is still the lowest since March 2021. That shows how much of this year's disinflation is a base effect rather than genuine cooling.
Behind the headline number:
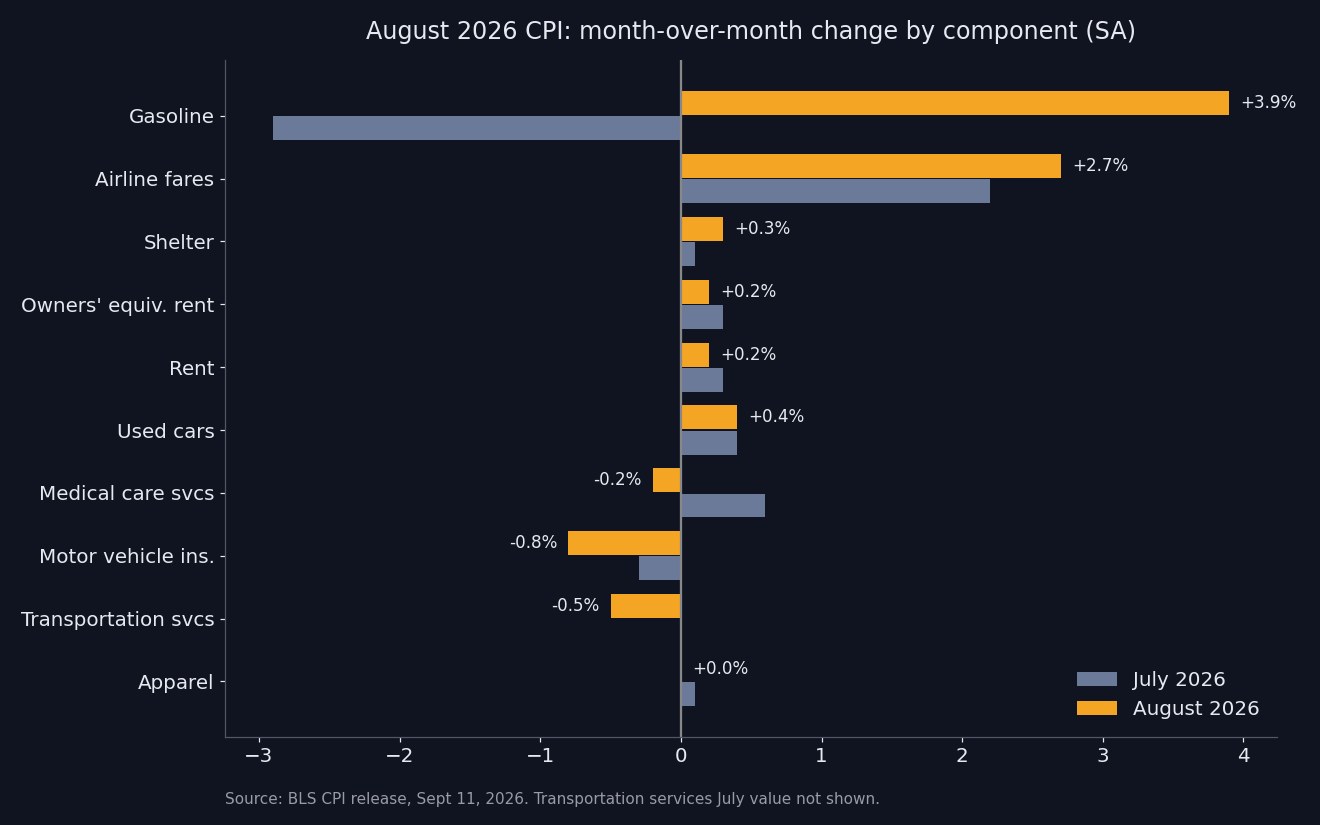
- Energy +2.1% on the month (+16.3% y/y). Gasoline +3.9% (+27.4% y/y), which BLS says accounted for "over one third of the monthly all items increase".
- Shelter +0.3%, after two straight 0.1% readings. Owners' equivalent rent and rent each rose only 0.2%, so the rest of the jump came from the smaller shelter lines, including lodging away from home.
- Airline fares +2.7% (+23.4% y/y), a second hot month after July's 2.2%.
- Used cars +0.4%, new vehicles +0.3%, apparel flat.
- Medical care services −0.2%, motor vehicle insurance −0.8%, transportation services −0.5%.
- Food +0.1%, with food inflation now 2.7% a year.
Scorecard: what our CPI preview got right and wrong
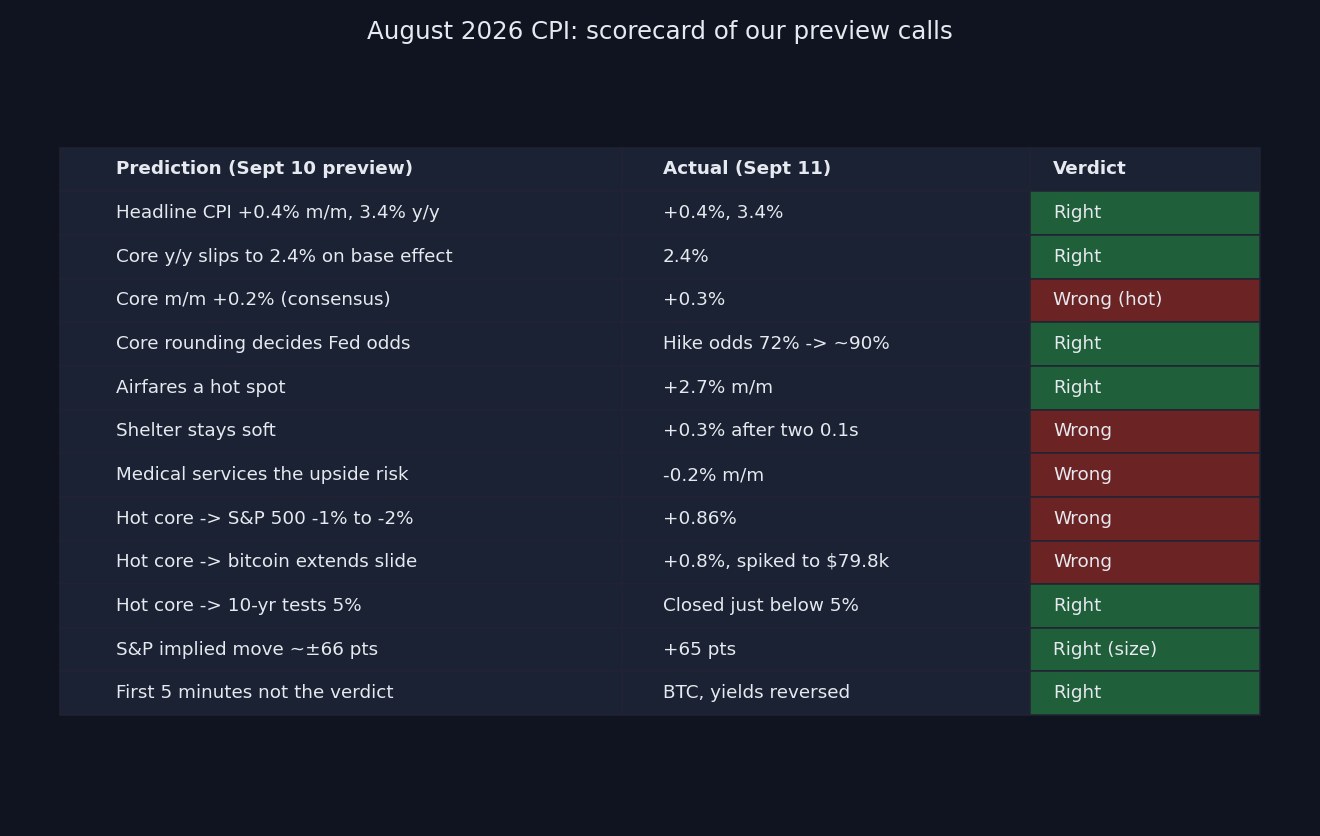
| Our call on September 10 | What happened on September 11 | Verdict |
|---|---|---|
| Headline +0.4% m/m, 3.4% y/y | +0.4%, 3.4% | ✅ Right |
| Core y/y falls to 2.4% on the base effect | 2.4% | ✅ Right |
| Core m/m +0.2% (in line with consensus) | +0.3% | ❌ Wrong |
| The core rounding decides the Fed debate | Hike odds 72% → ~90% | ✅ Right |
| Airfares are the component to watch | +2.7% | ✅ Right |
| Shelter stays soft | +0.3% after two 0.1s | ❌ Wrong |
| Medical services are the upside risk | −0.2% | ❌ Wrong |
| Hot core → S&P 500 falls 1%–2% | +0.86% | ❌ Wrong |
| Hot core → bitcoin extends its slide | +0.8%, briefly $79,837 | ❌ Wrong |
| Hot core → 10-year tests 5% | Closed just below 5% | ✅ Right |
| S&P 500 implied move about ±66 points | +65 points | ✅ Right on size, wrong on sign |
| "The first five minutes are not the verdict" | Bitcoin and yields reversed intraday | ✅ Right |
Six clean hits, five clean misses and one split. The pattern matters more than the count. We got the data mostly right and the market reaction mostly wrong. Those are two different skills, and the gap between them is the real lesson of this release.
What we got right
1. The headline and the base effect
The call that headline CPI would jump to 0.4% on gasoline while the annual rate held at 3.4% was straightforward arithmetic. August 2025's 0.4% headline dropped out and August 2026's 0.4% replaced it. The same logic explained why core would slip to 2.4% year over year even though nothing had cooled: last August's 0.3% core fell out of the 12-month window. Both held exactly.
The gasoline estimate was directionally right but too timid. We estimated pump prices rose about 3% before seasonal adjustment, based on AAA's weekly averages. The seasonally adjusted CPI gasoline index rose 3.9%. August seasonal factors normally subtract from gasoline; this year the pump spike was large enough to overwhelm them.
2. Core rounding was the whole game
We argued that a 0.1-point difference in core mattered more than a 0.3-point difference in headline, because the Fed would treat energy as a supply shock unless it leaked into core. That is exactly how the market read it. CME FedWatch-style pricing moved from about 72% on Thursday to roughly 87%–90% after the print, according to the CME FedWatch tool and market coverage. A week earlier it had been about 50%. Those odds rose on a single tenth of core, while the headline matched consensus.
3. Airfares as the tell
We flagged airline fares as the line that "would add a few hundredths to core by itself". They rose 2.7% on top of July's 2.2%. This is the most direct channel from the Hormuz oil shock into core services: jet fuel feeds straight into ticket prices. Two consecutive hot months is a trend, not noise.
4. The first five minutes really were not the verdict
This was the most useful practical advice in the preview, and it played out almost as a textbook example:
- Bitcoin traded near $77,057 before 8:30 a.m. ET, dropped to $76,700 on the print with wicks into $76,000–$76,300, then reversed to $77,410 by 8:38 and briefly spiked to $79,837.
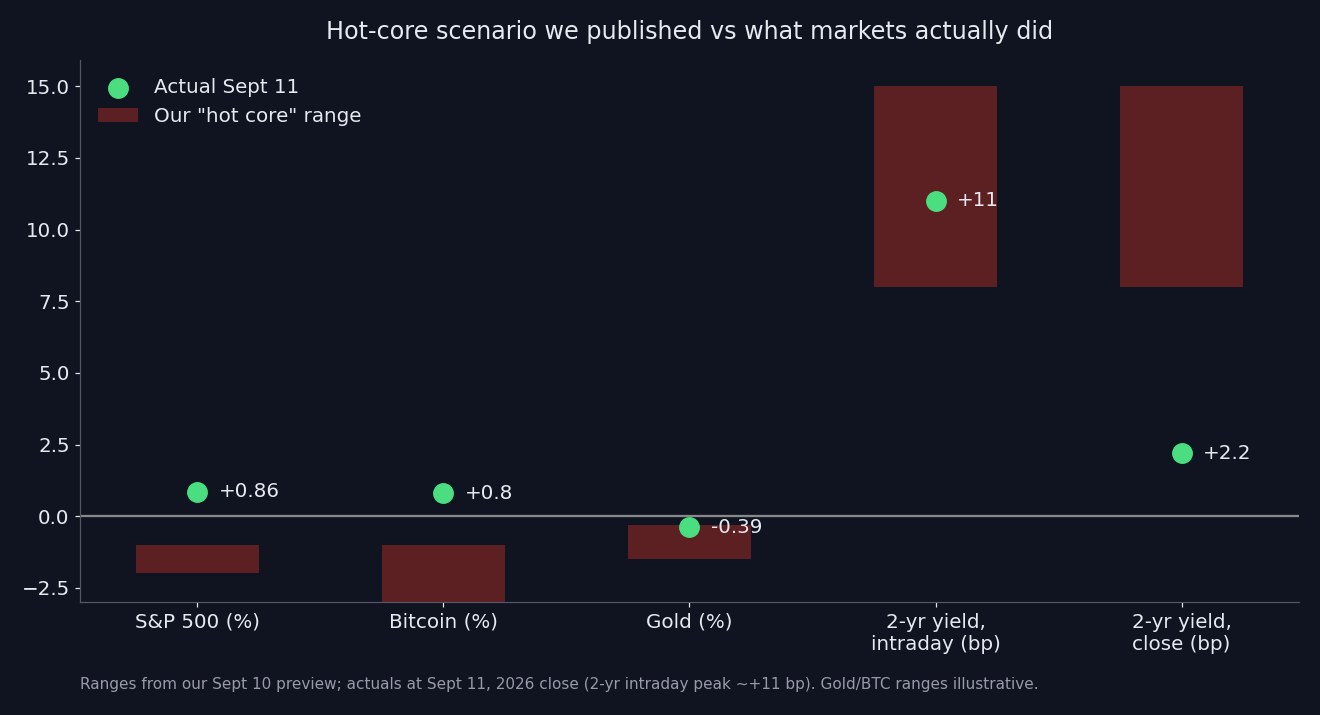
- The 2-year Treasury yield rose almost 11 bp intraday, within our 8–15 bp hot-scenario range, but closed only 2.2 bp higher at 4.572%.
- Stock futures wobbled, then the S&P 500 finished near the day's highs.
Anyone who traded the first candle was on the wrong side of every one of those moves.
5. The size of the move
Options priced a move of about ±66 points in the S&P 500. The index closed up 65.28 points. The market's volatility estimate was almost perfect. We just had the sign wrong, and it was the options market's number, not ours. The VIX then fell 11% to 15.84 as the event risk passed.
What we got wrong, and why
Miss 1: we followed the consensus on core
Our core call was simply the Street's 0.2%, the same number the Cleveland Fed nowcast (2.38% y/y) and Kalshi (2.38%) pointed to. Everyone missed, and following consensus is a defensible choice. But we also listed the risks, and we listed the wrong ones. That leads to the second miss.
Miss 2: we expected the heat from medical care; it came from shelter
We named medical services, up 0.6% in July, as the line most likely to push core to 0.3%. It fell 0.2%. Motor insurance fell again (−0.8%), and transportation services overall fell 0.5% despite the airfare spike.
The component we treated as a reliable brake, shelter, did the damage instead. After two months at 0.1%, shelter rose 0.3%. OER and rent rose only 0.2% each, so the swing came from the more volatile corners, such as hotels and lodging away from home.
The lesson: a single soft month in a component with a long trend is not a new regime. Shelter had run at 0.3%–0.4% for years before its summer lull. We treated a two-month dip as information when it was more likely noise. Mean reversion in the largest core component is a risk we should have listed first.
Miss 3: the "hot core means stocks fall" rule ignored oil
This was the biggest miss. Our scenario map said a hot core print would push the S&P 500 down 1%–2%, lift yields and extend bitcoin's slide. We got a hot core, and stocks rallied almost 1%.
Three things our map ignored:
- Oil moved in the other direction on the same morning. Iranian state media said Tehran would meet Gulf states in Oman to discuss the Strait of Hormuz. Brent fell 2.8% to $104.61 and WTI fell 2.4% to $100.05, retreating from Thursday highs near $108 and above $104. In a market whose entire inflation problem is energy, a credible diplomatic headline on Hormuz is worth more than a tenth of core CPI. Our scenario map treated CPI as the only variable that changed. It was not.
- The hike was already mostly priced. Odds had climbed from about 50% a week earlier to 72% before the release, and four straight down days had already marked stocks lower. A hot print that confirms what is priced removes uncertainty rather than adding it. That is why the VIX fell 11% on a "bad" number.
- Positioning cut the other way. We wrote that the cool scenario was the explosive one because positioning leaned hawkish. The same logic applied to the hot scenario: with everyone already hedged for a hike, a hot print had few new sellers left. We correctly identified the crowded trade but then drew the conclusion only for one branch of the tree.
Miss 4: bitcoin was not a pure rate trade
We described bitcoin as a high-beta liquidity asset that would slide on a hot print. It closed up about 0.8% at $77,146 after its $79,837 spike. For the same reason as stocks, lower oil and resolved event risk outweighed the rate impulse. With the dollar index barely changed near 99.1, the "strong dollar crushes crypto" channel never engaged. Gold was the one hot-scenario call that roughly held, slipping 0.39% to about $4,390. Even there, it bounced from an intraday low near $4,317 as the release passed.
Miss 5: soft PPI services meant less than we said
We wrote that Thursday's soft services PPI "slightly lowers the risk of a hot core CPI". It didn't. The services lines that PPI feeds into, such as airfares, went the other way, and shelter is not in the PPI at all. For core CPI, PPI is a much weaker signal than we implied.
The deeper lesson: data forecasts and market forecasts are different tasks
It is tempting to say the preview was "mostly right" because the data calls held. That would miss the point. Readers do not use a CPI preview to learn the headline number; they use it to decide what to do with their risk. On that test, the scenario map was the weakest part of the piece.
The core error was structural. A scenario map conditioned on a single variable, here the core CPI print, implicitly assumes every other variable holds still. On a day when the central bank's problem is an oil shock and the oil market is reacting to live diplomatic news, that assumption is fragile. A better framework does three things:
- Maps the joint outcome, not one variable. "Hot core plus oil down" and "hot core plus oil up" are different scenarios and deserve different rows.
- Grades the surprise against what is priced. A hot print that moves hike odds from 72% to 90% is a smaller shock than one that moves them from 30% to 70%, even if the CPI numbers are identical.
- Accounts for positioning on both branches. If the crowd is braced for bad news, bad news is often a relief.
We will build all three into our next preview.
What happens next: the September 16 FOMC
Markets now price about a 90% chance of a 25 bp hike on September 16. The target range would rise from 3.50%–3.75% to 3.75%–4.00%. At the July meeting, three officials dissented in favor of a hike, and August's hot core gives them the data they wanted. With a hike largely priced, the market-moving variables shift to:
- The dot plot. Does the median show one hike, or the start of a sequence?
- Chair Kevin Warsh's framing. Does the Committee describe this as insurance against energy pass-through or as the start of a tightening cycle?
- Oil. The Oman talks on Hormuz matter more for the path of inflation than any single CPI print. A lasting de-escalation could make September's hike the last. A breakdown would put a second hike in play.
- The September CPI in mid-October. A second 0.3% core would be much harder to dismiss, especially with shelter no longer providing cover.
For live coverage around the decision, open a SimianX live analysis session on SPY, a mega-cap such as NVIDIA or Apple, or Bitcoin. Multi-agent AI reassesses the chart as the statement and press conference hit. Set an autopilot to enforce your risk rules through the volatility, and follow Market Pulse for unusual moves as they happen. Energy names such as ExxonMobil and Chevron will keep taking their cue from the Hormuz headlines.
For background, our July CPI preview, July CPI report analysis and CPI and crypto playbook cover the earlier chapters of this inflation cycle.
Frequently asked questions
What did the August 2026 CPI report show?
Headline CPI rose 0.4% in August and 3.4% from a year earlier, both in line with forecasts. Core CPI, which excludes food and energy, rose 0.3%, a tenth above the 0.2% forecast, and 2.4% year over year.
Why did stocks rise if inflation was hotter than expected?
Oil fell nearly 3% after reports of Iran–Gulf talks in Oman on the Strait of Hormuz, which eased the energy fears behind the inflation problem. The Fed hike was also largely priced beforehand, so the report removed uncertainty rather than adding it. The S&P 500 gained 0.86% and the VIX fell 11%.
Will the Fed raise rates on September 16, 2026?
Markets price about a 90% chance of a 25 bp hike to 3.75%–4.00%, up from 72% the day before the CPI and about 50% a week earlier. Three FOMC members already voted for a hike in July.
What drove core inflation higher in August?
Mainly shelter, which rose 0.3% after two months at 0.1%, and airline fares, which rose 2.7% as jet fuel costs passed through. Medical services, car insurance and transportation services overall fell, which kept core from running even hotter.
How did bitcoin react to the August CPI?
Bitcoin dipped to about $76,000–$76,700 right after the release, then reversed and briefly spiked to $79,837 before closing near $77,146, up about 0.8%. Lower oil and resolved event risk mattered more than the higher hike odds.
What was the most useful lesson from the preview?
Separate the data forecast from the market forecast. We got most of the numbers right but misjudged the market reaction, because the scenario map treated CPI as the only thing that changed on the day. Oil, pre-positioning and priced-in Fed odds turned out to matter more.
The bottom line
Our August CPI preview called the numbers well: headline, the core base effect, the airfare pass-through and the market's fixation on core rounding all played out as described. It called the market poorly, because it asked "what if CPI is hot?" without asking "what else will move that morning?" Core did run hot, but a hike already mostly priced, crowded hawkish hedges and a sharp drop in oil overwhelmed it.
The honest summary is the one we would want from anyone else: right on inflation, wrong on the reaction. The next preview will map joint outcomes, not single-variable ones.
This article is for informational purposes only and is not investment advice. Market data are as of the September 11, 2026 close.