July CPI Report 2026: Inflation Falls to 3.5% as Gas Prices Crash
Latest: For the newest CPI figures, the next release date and the last 24 inflation reports, see our always-updated page: US CPI Report: Latest Inflation Data and Release Schedule.
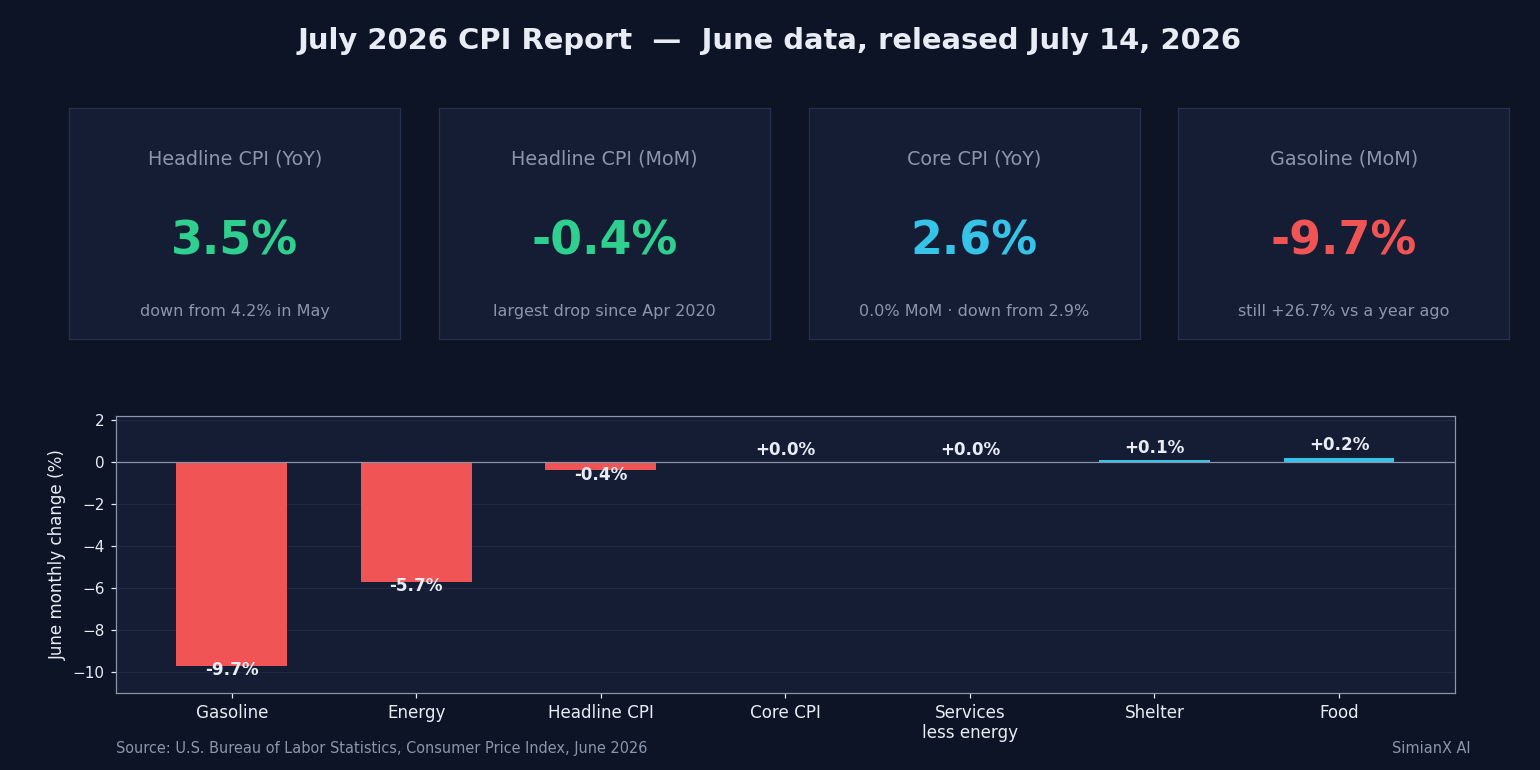
The July CPI Report 2026 delivered the clearest inflation relief the United States has seen in months. Headline inflation slowed to 3.5% year over year, the monthly Consumer Price Index fell 0.4%, and gasoline prices plunged 9.7% from May.
For investors, however, the report creates a more complicated question than the headline suggests: Is inflation genuinely returning toward the Federal Reserve’s target, or did volatile energy prices temporarily hide persistent underlying pressure?
That distinction matters for Treasury yields, technology stocks, the U.S. dollar, gold, and Bitcoin. At SimianX AI, the practical objective is not simply to label one CPI report “bullish” or “bearish.” It is to identify which components changed, determine whether the changes are sustainable, and map the data into possible Federal Reserve and market scenarios.
A naming clarification is also important. The figures published on July 14, 2026, measure prices during June 2026. The official CPI report covering July prices is scheduled for release on August 12, 2026.
July CPI Report 2026: The Main Numbers
The Bureau of Labor Statistics reported that the Consumer Price Index for All Urban Consumers declined 0.4% month over month after rising 0.5% in May. It was the largest monthly decrease since April 2020.
Annual headline inflation slowed from 4.2% in May to 3.5% in June. Core CPI, which excludes food and energy, was unchanged during the month and slowed from 2.9% to 2.6% year over year.
| CPI component | June monthly change | 12-month change | Why it matters |
|---|---|---|---|
| Headline CPI | -0.4% | 3.5% | Large downside surprise driven by energy |
| Core CPI | 0.0% | 2.6% | Suggests underlying inflation also moderated |
| Energy | -5.7% | 15.7% | Main contributor to the monthly CPI decline |
| Gasoline | -9.7% | 26.7% | Biggest source of immediate consumer relief |
| Shelter | +0.1% | 3.3% | Smallest monthly shelter increase since January 2021 |
| Food | +0.2% | 3.0% | Grocery and restaurant prices continued rising |
| Services less energy | 0.0% | 3.2% | Important signal of softer service-sector pressure |
The most encouraging development was not simply cheaper gasoline. Core CPI did not rise at all during June, while shelter inflation increased only 0.1%—its smallest monthly move in more than five years. Services excluding energy services were also unchanged.
Several categories declined:
- Motor vehicle insurance fell 2.0%
- Communication prices fell 1.5%
- Apparel prices declined 0.6%
- Used-car prices fell 0.2%
- Medical-care prices declined 0.1%
These decreases were partially offset by higher recreation, personal-care, and household-furnishing prices. Food prices rose 0.2%, including a 4.3% increase in egg prices and a 1.2% increase in dairy products.
The report was softer beneath the surface than a purely energy-driven headline decline would imply—but energy still produced most of the monthly drop.
Why the Gasoline Price Crash Changed Headline Inflation
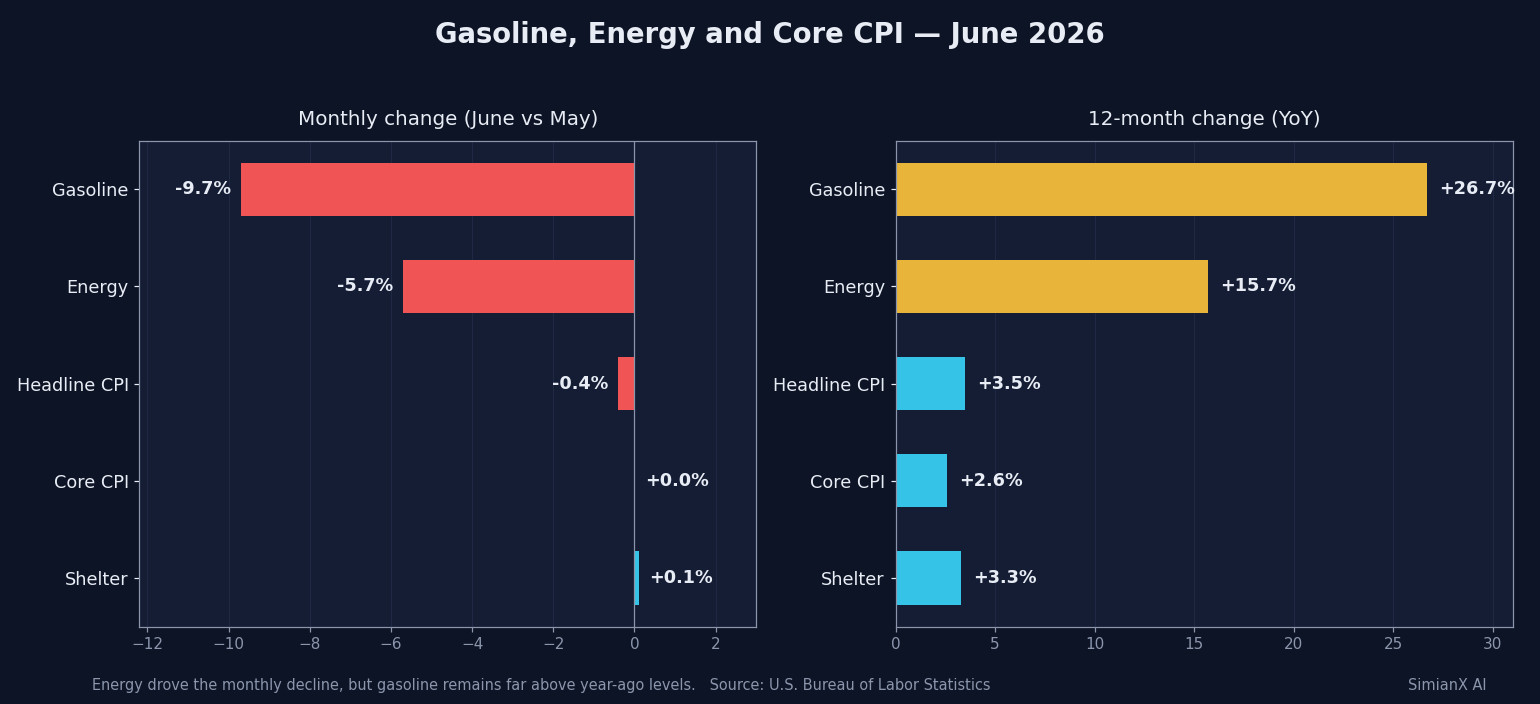
The gasoline index fell 9.7% in one month, while the broader energy index dropped 5.7%. Because energy is included in headline CPI, a movement of that size can quickly change the national inflation rate even when other household expenses remain relatively stable.
This creates two very different interpretations.
The Bullish Inflation Interpretation
Cheaper gasoline reduces household transportation costs and can indirectly lower expenses for logistics, airlines, and businesses that consume large amounts of fuel.
Lower energy costs may:
- Improve consumers’ real purchasing power
- Reduce shipping and delivery expenses
- Lower short-term inflation expectations
- Ease pressure on profit margins
- Reduce the need for immediate monetary tightening
The CPI report also contained genuine improvement outside energy. Core CPI was flat, shelter inflation slowed sharply, and multiple service categories declined.
The Cautious Interpretation
Gasoline remained 26.7% more expensive than a year earlier, even after June’s decline. The annual energy index was still 15.7% higher.
This means the cost-of-living problem has moderated, but it has not disappeared.
Energy prices are also highly volatile. A monthly gasoline decline may reverse much faster than shelter, insurance, or wage-related service inflation. Investors therefore need to separate:
- Temporary energy disinflation
- Sustainable core-goods disinflation
- Persistent shelter and service inflation
- Changes caused by annual base effects
A lower annual CPI rate can partly reflect comparison with a particularly expensive month one year earlier. That does not necessarily mean the current price level is falling.
Was the July CPI Report 2026 Really as Soft as It Looked?
The report was legitimately soft, but the quality of the disinflation was mixed.
Gasoline caused most of the headline decline. However, three underlying developments strengthened the dovish interpretation.
First, core CPI was unchanged. That is more important for monetary policy than a one-month fall in volatile fuel prices.
Second, shelter increased only 0.1%. Shelter has a large weight in CPI and historically adjusts more slowly than real-time housing-market indicators. A sustained shelter slowdown would materially improve the medium-term inflation outlook.
Third, services excluding energy were flat. Persistent service inflation is often linked to labor costs, rent, insurance, and demand. A broader slowdown across services would give the Federal Reserve more confidence that inflation is not merely moving between categories.
Nevertheless, one report does not establish a trend. The Federal Reserve will want to know whether:
- Core CPI stays near 0.1%–0.2% per month
- Shelter continues slowing
- Insurance prices remain under control
- Goods inflation stays contained
- Energy prices stabilize rather than rebound
- Consumer inflation expectations move lower
The next official CPI release on August 12, 2026, will be particularly important because it will show whether June’s gasoline decline was repeated, stabilized, or reversed.
A soft headline number can delay a rate hike. A sustained slowdown in core inflation can remove the need for one.
Will the Fed Still Hike After the July CPI Report 2026?
An immediate rate increase is now harder to justify, but a later 2026 hike remains possible.
At its June meeting, the Federal Open Market Committee held the federal funds target range at 3.50%–3.75%. However, the updated median projection placed the policy rate at 3.8% at the end of 2026, above the current midpoint and therefore consistent with approximately one additional quarter-point increase.
The June projections were notably hawkish:
| Federal Reserve projection | 2026 median |
|---|---|
| Real GDP growth | 2.2% |
| Unemployment rate | 4.3% |
| Headline PCE inflation | 3.6% |
| Core PCE inflation | 3.3% |
| Federal funds rate | 3.8% |
The Fed had raised its 2026 PCE inflation projection from 2.7% in March to 3.6% in June, while the core PCE estimate rose from 2.7% to 3.3%.
Those projections were made before the latest CPI report, but they demonstrate why policymakers entered July with a tightening bias.
The next FOMC meeting is scheduled for July 28–29, 2026. It will not include a new Summary of Economic Projections, which means investors will focus heavily on the policy statement and the Federal Reserve chair’s press conference.
Why the Fed May Hold Rates in July
The case for holding includes:
- Headline CPI fell 0.4%
- Core CPI was unchanged
- Shelter inflation slowed substantially
- Service-sector inflation showed broader moderation
- A rate hike shortly after one soft report could appear unnecessarily aggressive
Why the Fed May Remain Hawkish
The case for retaining a tightening bias includes:
- Headline CPI remains well above 2%
- The Fed targets PCE inflation, not CPI
- Energy prices remain much higher than a year earlier
- The June projections still point toward a higher year-end rate
- Growth and employment have not weakened enough to force immediate easing
- One month of favorable data can be reversed
The most likely distinction is therefore between action and guidance. The Fed can hold rates in July while continuing to warn that a future hike is possible.
The CPI–Fed Decision Framework
Investors can evaluate the next several inflation reports through four scenarios.
| Scenario | Inflation pattern | Likely Fed response | Possible market interpretation |
|---|---|---|---|
| Durable disinflation | Core CPI remains at 0.1%–0.2%; shelter slows | Hold; hike projections move lower | Supportive for bonds and growth stocks |
| Energy rebound only | Headline CPI rises but core stays contained | Hold and look through energy | Initial volatility, limited policy repricing |
| Broad reacceleration | Core CPI reaches 0.3%–0.4%; services strengthen | Hike remains firmly on the table | Higher yields, stronger dollar, pressure on valuations |
| Stagflation risk | Energy rises while growth slows | Difficult policy trade-off | Volatility across stocks, bonds, and commodities |
The Fed is unlikely to react mechanically to one headline CPI number. Policymakers will assess inflation breadth, labor-market conditions, consumer demand, financial conditions, and inflation expectations together.
For investors, this means the relevant question is not simply, “Was CPI 3.5%?” The better questions are:
- Was the surprise concentrated in gasoline?
- Did core services decelerate?
- Are short-term annualized inflation rates improving?
- Did Treasury yields confirm the market’s interpretation?
- Did the dollar, oil, and inflation expectations move in the same direction?
How Markets Reacted to the 3.5% Inflation Report
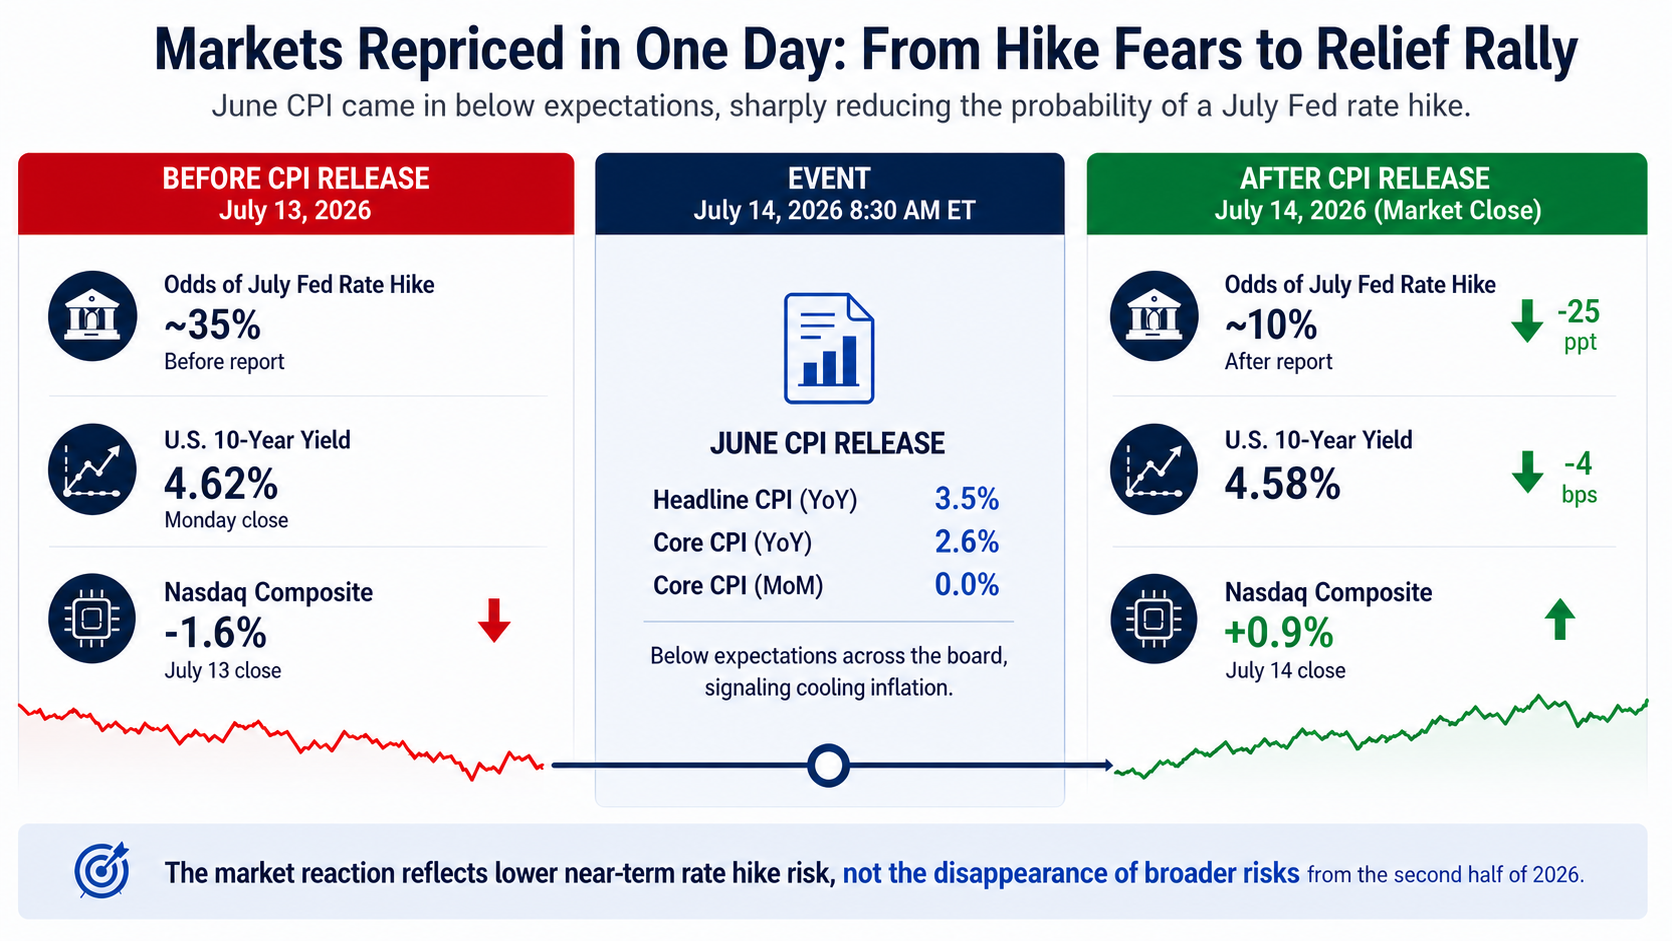
The initial market response was positive. The S&P 500 and Nasdaq advanced, while Treasury yields declined as investors reduced expectations for an immediate Federal Reserve hike.
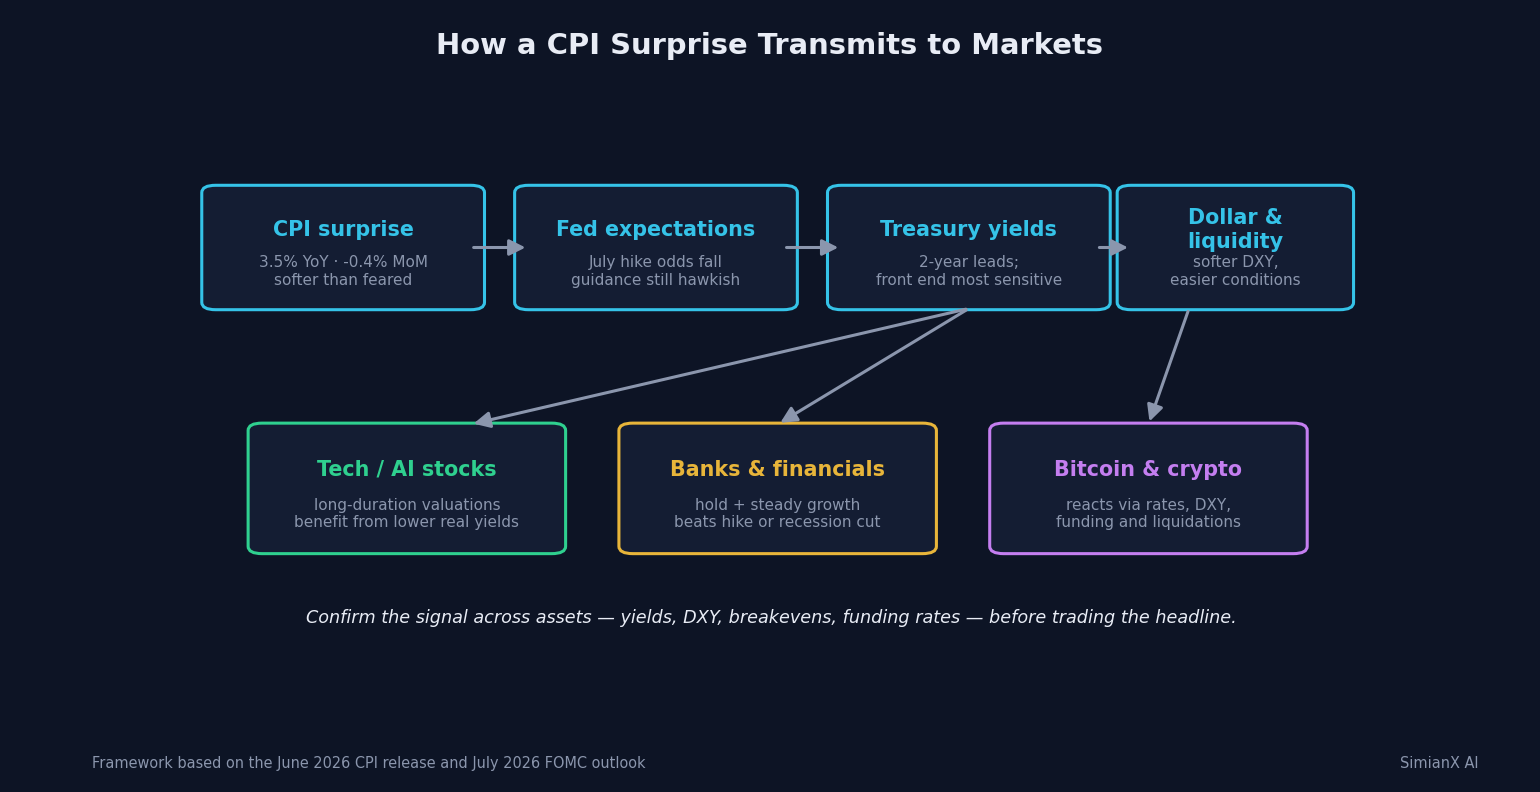
The reaction followed a familiar transmission mechanism:
- CPI came in softer than feared.
- Traders reduced the probability of near-term tightening.
- Short-term Treasury yields declined.
- Lower yields supported equity valuations.
- Growth and technology shares outperformed.
However, the first market move after CPI is not always durable. Investors initially trade the headline and consensus surprise, then examine shelter, services, energy, and revisions.
Treasury Bonds
A durable core-inflation slowdown would generally support shorter-duration Treasuries because the front end of the yield curve is highly sensitive to Fed expectations.
Watch the US2Y yield. If the two-year yield continues falling after the initial CPI reaction, the rates market is treating the report as meaningful policy information rather than temporary noise.
Technology and AI Stocks
Lower expected rates can support high-duration assets, including AI and semiconductor companies whose valuations depend heavily on future cash flows.
The positive setup is:
- Softer core inflation
- Falling real yields
- Stable economic growth
- No major deterioration in earnings
The negative setup would be an energy-driven CPI rebound that pushes yields higher without improving corporate revenue.
Banks and Financial Stocks
Banks face a mixed environment. Higher rates can increase yields on loans, but they may also reduce credit demand and create mark-to-market pressure on securities portfolios.
A Fed hold combined with steady growth may be more constructive for financial stocks than either an aggressive hike or a recession-driven rate cut.
Bitcoin and Crypto
Crypto often reacts to the rates market rather than CPI in isolation. Softer inflation can reduce expected policy rates, weaken the dollar, and improve liquidity conditions, which may support BTC and other high-beta assets.
The transmission chain is:
CPI surprise → Fed expectations → Treasury yields → dollar and liquidity → crypto prices
SimianX previously examined this mechanism in its research on US CPI and crypto price swings.
The central lesson is that traders should confirm the CPI signal through yields, the DXY, funding rates, and liquidations rather than treating the headline as a standalone trading instruction.
A Practical Post-CPI Market Checklist
The following framework can help investors evaluate whether the inflation signal is strengthening or fading.
Step 1: Separate Headline and Core Inflation
Headline CPI can move sharply because of gasoline. Core CPI provides a cleaner—although still imperfect—view of underlying inflation.
Step 2: Examine Shelter and Core Services
Look beyond the top-line print and identify whether rent, owners’ equivalent rent, medical services, insurance, and transportation services are slowing.
Step 3: Monitor Energy After the Data Window
CPI is backward-looking. Oil and gasoline prices can change materially between the survey period and the release date.
Step 4: Confirm the Signal in Rates
Monitor:
- Two-year Treasury yield
- Ten-year Treasury yield
- Inflation breakevens
- Fed-funds futures
- Real yields
Step 5: Track Cross-Asset Confirmation
A consistent dovish response would usually involve some combination of:
- Lower short-term yields
- A softer
DXY - Stronger growth stocks
- Better crypto risk appetite
- Stable or lower inflation expectations
Step 6: Prepare for the Next Catalysts
The CPI report is only one part of the policy process. Investors should also follow:
- PCE inflation
- Producer prices
- Employment data
- Retail sales
- Wage growth
- Consumer inflation expectations
- Oil and gasoline prices
For practical monitoring, SimianX AI can help combine technical indicators, financial news, fundamental context, and multi-agent decision analysis rather than requiring investors to interpret every signal in isolation.
The existing July CPI Preview 2026 also provides scenario ranges for the next inflation release.
What Could Reverse the Disinflation Story?
The greatest risk is that June represents a temporary energy correction rather than the beginning of a sustained inflation slowdown.
Three developments would challenge the favorable interpretation.
1. Gasoline Prices Rebound
Because energy was the largest contributor to the monthly CPI decline, a reversal could push headline inflation higher even if core categories remain stable.
2. Shelter Inflation Accelerates Again
June’s 0.1% shelter increase was unusually soft. A return toward 0.3%–0.5% monthly readings would make it difficult for core inflation to continue falling.
3. Core Services Broaden
Higher prices across medical services, recreation, insurance, transportation, and personal services would be more concerning than a narrow energy shock.
By contrast, another month of soft shelter, flat core services, and contained goods prices would strengthen the argument that inflation is moving lower across the economy.
FAQ About the July CPI Report 2026
What Did the July CPI Report 2026 Show?
The report released in July showed that headline CPI fell 0.4% from the previous month and rose 3.5% from a year earlier. Core CPI was unchanged monthly and increased 2.6% annually, while gasoline prices fell 9.7%.
Why Did US Inflation Fall to 3.5%?
The largest driver was a 5.7% monthly decline in energy prices, including the 9.7% gasoline drop. Slower shelter inflation and declines in insurance, apparel, communication, and medical care also helped reduce the core reading.
Will the Federal Reserve Raise Rates in July 2026?
The softer CPI data weakened the immediate case for a July hike, but the decision has not been predetermined. The FOMC meets on July 28–29, and its June projections still indicated the possibility of another rate increase before the end of 2026.
Does 3.5% CPI Mean Inflation Is Under Control?
It represents meaningful progress from the previous month, but inflation remains elevated relative to the Fed’s longer-run 2% objective. Investors also need to determine whether the energy decline and shelter slowdown will persist.
When Will the Next US CPI Report Be Released?
The CPI report covering July 2026 prices is scheduled for August 12, 2026, at 8:30 a.m. Eastern Time.
Conclusion
The July CPI Report 2026 delivered substantial inflation relief. Headline CPI slowed to 3.5%, monthly prices fell 0.4%, gasoline dropped 9.7%, core CPI was flat, and shelter recorded its smallest monthly increase in several years.
Those details reduce the case for an immediate Federal Reserve rate hike. They do not eliminate tightening risk, because headline inflation remains elevated, energy prices are volatile, and the Fed’s June projections still implied the possibility of a higher policy rate by year-end.
The decisive question is whether the slowdown broadens and persists. Another soft core reading, continued shelter moderation, and stable energy prices would make a 2026 hike increasingly difficult to justify. A rebound in gasoline combined with stronger core services would return inflation risk to the center of the market narrative.
Investors can use SimianX AI to monitor the interaction among inflation data, Treasury yields, market news, technical signals, and asset-specific fundamentals—turning each macro release into a structured scenario rather than a one-number bet.