 โดย Muke
หกสัญญาณที่จะชี้ทิศทางหุ้น MSFT หลังรายงานวันที่ 29 กรกฎาคม
รายงานผลประกอบการ Q4 ของ Microsoft ปี 2026 จะทดสอบว่าความต้องการ Azure และปัญญาประดิษฐ์ที่แข็งแกร่งอย่างยิ่งสามารถพิสูจน์ได้หรือไม่ว่าการลงทุนในโครงสร้างพื้นฐานที่ใหญ่ที่สุดในประวัติศาสตร์ของบริษัทนั้นคุ้มค่า
Microsoft จะประกาศผลสำหรับไตรมาสการเงินที่สี่ซึ่งสิ้นสุดในวันที่ 30 มิถุนายน 2026 หลังจากที่ตลาดสหรัฐปิดในวัน พุธที่ 29 กรกฎาคม 2026 การประชุมโทรศัพท์เกี่ยวกับผลประกอบการจะเริ่มขึ้นในเวลา 14:30 น. ตามเวลามหาสมุทรแปซิฟิก ซึ่งเท่ากับประมาณ 05:30 น. ตามเวลาในสิงคโปร์ในวันพฤหัสบดีที่ 30 กรกฎาคม
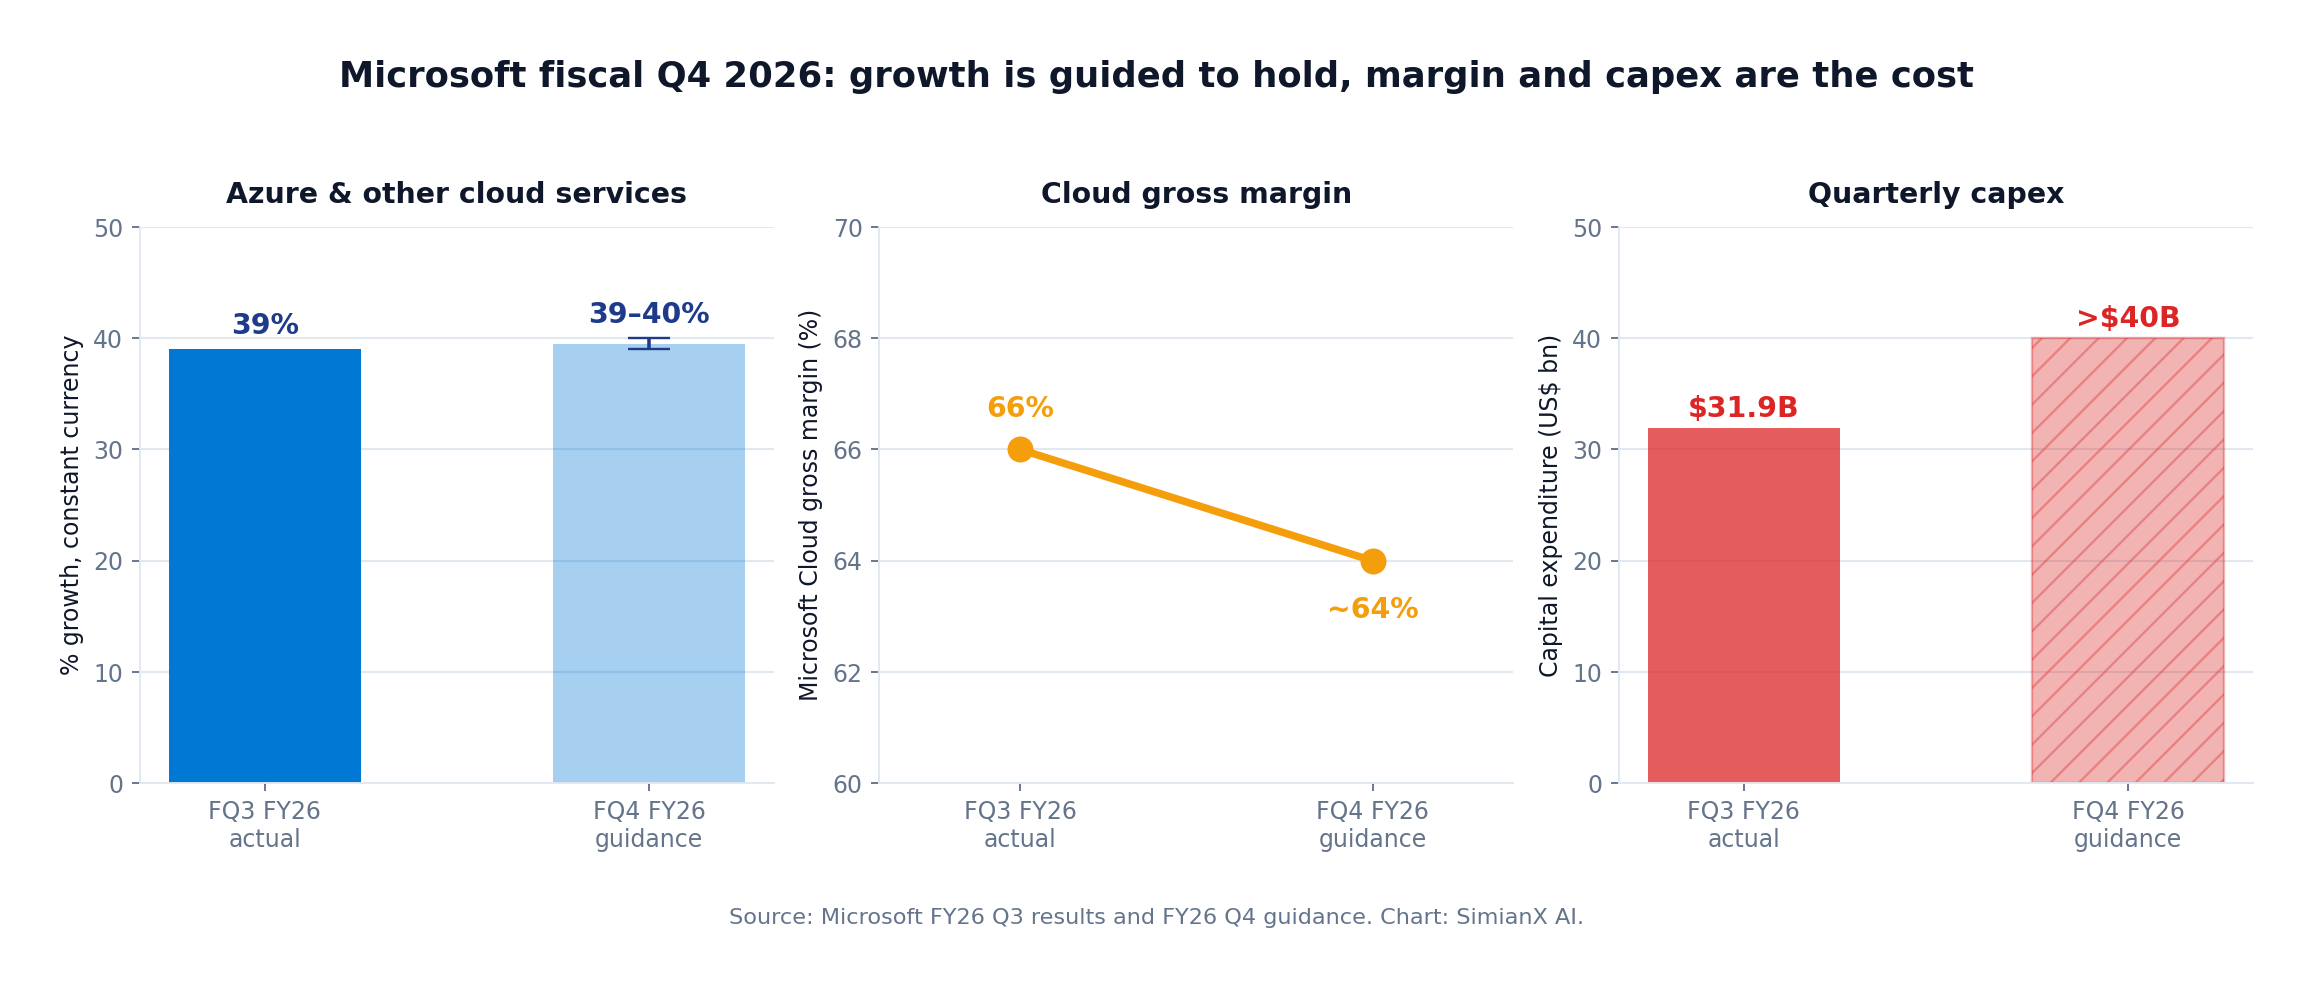
คำถามหลักไม่ใช่ว่าสินค้าของ AI ของ Microsoft กำลังเติบโตหรือไม่ ความต้องการ Azure เกินความสามารถที่มีอยู่ รายได้จาก AI ของ Microsoft มีอัตราการเติบโตเกิน 37,000 ล้านดอลลาร์ และ Microsoft 365 Copilot มีที่นั่งที่ชำระเงินมากกว่า 20 ล้านที่นั่ง คำถามที่แท้จริงคือการเติบโตนั้นมาถึงอย่างรวดเร็วและมีกำไรเพียงพอที่จะชดเชยการเสื่อมราคา การลดลงของอัตรากำไรจากคลาวด์ และการใช้จ่ายด้านทุนรายไตรมาสที่มากกว่า 40,000 ล้านดอลลาร์หรือไม่
สำหรับนักลงทุนที่ใช้ SimianX AI ในการประเมินเหตุการณ์ผลประกอบการ สัญญาณที่สำคัญที่สุดจะเป็น การเติบโตของ Azure, อัตรากำไรขั้นต้นของ Microsoft Cloud, แนวทางการใช้จ่ายด้านทุน, การสร้างรายได้จาก Copilot, คุณภาพของงานค้างส่งมอบ, และกระแสเงินสดฟรี—ไม่ใช่แค่การที่รายได้หลักจะเกินฉันทามติ
สิ่งที่ Microsoft Q4 ผลประกอบการปี 2026 ต้องพิสูจน์?
Microsoft เข้าสู่รายงานด้วยโมเมนตัมการดำเนินงานที่แข็งแกร่งและภาระการพิสูจน์ที่สูงผิดปกติ
ในไตรมาสการเงินที่ 3 รายได้เพิ่มขึ้น 18% เป็น 82.9 พันล้านดอลลาร์ รายได้จากการดำเนินงานเพิ่มขึ้น 20% เป็น 38.4 พันล้านดอลลาร์ และกำไรต่อหุ้นที่ปรับแล้วอยู่ที่ 4.27 ดอลลาร์ รายได้จาก Microsoft Cloud ขยายตัว 29% เป็น 54.5 พันล้านดอลลาร์ ขณะที่ Azure และบริการคลาวด์อื่น ๆ เติบโต 39% ในสกุลเงินคงที่
ตัวเลขเหล่านั้นโดยปกติจะเป็นตัวแทนของการตั้งค่าที่เป็นบวกอย่างชัดเจน อย่างไรก็ตาม Microsoft ยังเตือนว่าการใช้จ่ายด้านทุนในไตรมาสที่ 4 จะเกิน 40,000 ล้านดอลลาร์ เมื่อเปรียบเทียบกับ 31.9 พันล้านดอลลาร์ในไตรมาสที่ 3 กำไรขั้นต้นของ Microsoft Cloud คาดว่าจะลดลงเหลือประมาณ 64% ซึ่งสะท้อนถึงการลงทุนในโครงสร้างพื้นฐาน AI และการใช้งาน GitHub Copilot ที่เพิ่มขึ้น
ดังนั้นรายงานจึงต้องตอบคำถามสี่ข้อ:
- Azure สามารถรักษาการเติบโตประมาณ 40% ได้หรือไม่เมื่อเปรียบเทียบกับสิ่งที่ยากลำบาก?
- ความจุของศูนย์ข้อมูลใหม่กำลังเปลี่ยนเป็นการบริโภคของลูกค้าที่เรียกเก็บเงินได้หรือไม่?
- Copilot และผลิตภัณฑ์ AI อื่น ๆ สามารถเติบโตได้เร็วกว่าต้นทุนโครงสร้างพื้นฐานของพวกเขาหรือไม่?
- ฝ่ายบริหารจะเพิ่ม รักษา หรือปรับลดความคาดหวังการใช้จ่ายด้านทุนในอนาคตหรือไม่?
การทำรายได้เกินคาดอาจไม่เพียงพอ นักลงทุนต้องการหลักฐานว่า Microsoft กำลังเปลี่ยนโครงสร้างพื้นฐาน AI ให้เป็นรายได้ที่เกิดขึ้นซ้ำ กำไรที่ยั่งยืน และในที่สุดกระแสเงินสดที่แข็งแกร่งขึ้น
ความคาดหวังของ Microsoft Q4 FY2026
| เมตริก Q4 | ความคาดหวังหรือแนวทางปัจจุบัน | ทำไมมันถึงสำคัญ |
|---|---|---|
| รายได้รวม | ประมาณ 87.6 พันล้านดอลลาร์ตามฉันทามติ | ทดสอบว่าความแข็งแกร่งของคลาวด์เชิงพาณิชย์สามารถชดเชยจุดอ่อนของผู้บริโภคได้หรือไม่ |
| EPS ที่ปรับแล้ว | ประมาณ 4.21–4.24 ดอลลาร์ตามฉันทามติ | วัดการเติบโตของกำไรหลังจากต้นทุนโครงสร้างพื้นฐานและต้นทุนการดำเนินงานที่สูงขึ้น |
| แนวทางของ Microsoft | รายได้ 86.7–87.8 พันล้านดอลลาร์ | กำหนดช่วงทางการที่ Microsoft ต้องเกิน |
| การเติบโตของ Azure | 39%–40% ในสกุลเงินคงที่ | ตัวบ่งชี้ที่ชัดเจนที่สุดของการสร้างรายได้จาก AI และโครงสร้างพื้นฐานคลาวด์ |
| รายได้ Intelligent Cloud | 37.95–38.25 พันล้านดอลลาร์ | แสดงว่าการเติบโตของ Azure แปลเป็นรายได้ในกลุ่มหรือไม่ |
| กำไรขั้นต้นของ Microsoft Cloud | ประมาณ 64% | เปิดเผยต้นทุนความสามารถในการทำกำไรในการขยาย AI |
| การใช้จ่ายด้านทุน | มากกว่า 40,000 ล้านดอลลาร์ | กำหนดแรงกดดันต่อกระแสเงินสดและการเสื่อมราคาในอนาคต |
ปฏิทินรายได้สาธารณะในปัจจุบันคาดการณ์รายได้รวมอยู่ที่ประมาณ 87.6 พันล้านดอลลาร์ และ EPS ที่ปรับแล้วอยู่ที่ประมาณ 4.24 ดอลลาร์ แม้ว่าการประมาณการอาจเปลี่ยนแปลงก่อนการประกาศ
แนวทางรายได้ของ Microsoft เองอยู่ที่ประมาณ 87.25 พันล้านดอลลาร์ เมื่อเปรียบเทียบกับรายได้ 76.4 พันล้านดอลลาร์ในไตรมาสที่ 4 ของปีงบประมาณ 2025 นั่นจะหมายถึงการเติบโตประมาณ 14% EPS ที่ปรับแล้วในไตรมาสที่สี่ของปีที่แล้วอยู่ที่ 3.65 ดอลลาร์
ฐานเปรียบเทียบไตรมาส 3: เติบโตแรง ใช้จ่ายสูงขึ้น
ไตรมาสที่ 3 ของปีงบประมาณได้กำหนดฐานการดำเนินงานที่สูงสำหรับรายได้ของ Microsoft ในไตรมาสที่ 4 ปี 2026
Azure เติบโต 39% ในสกุลเงินคงที่ ซึ่งสูงกว่าระดับในไตรมาสก่อนหน้า 1 จุดเปอร์เซ็นต์ ผู้บริหารกล่าวว่าผลลัพธ์เกินความคาดหมายเพราะ Microsoft นำความสามารถออนไลน์เร็วกว่าที่วางแผนไว้ ทำให้สามารถบริโภคได้มากขึ้นทั้งในงาน AI และไม่ใช่ AI ความต้องการยังคงสูงกว่าซัพพลายที่มีอยู่ในประเภทลูกค้า งาน และภูมิภาคทางภูมิศาสตร์
ไฮไลท์อื่น ๆ ในไตรมาสที่ 3 ได้แก่:
- รายได้จาก Microsoft Cloud: 54.5 พันล้านดอลลาร์ เพิ่มขึ้น 29%
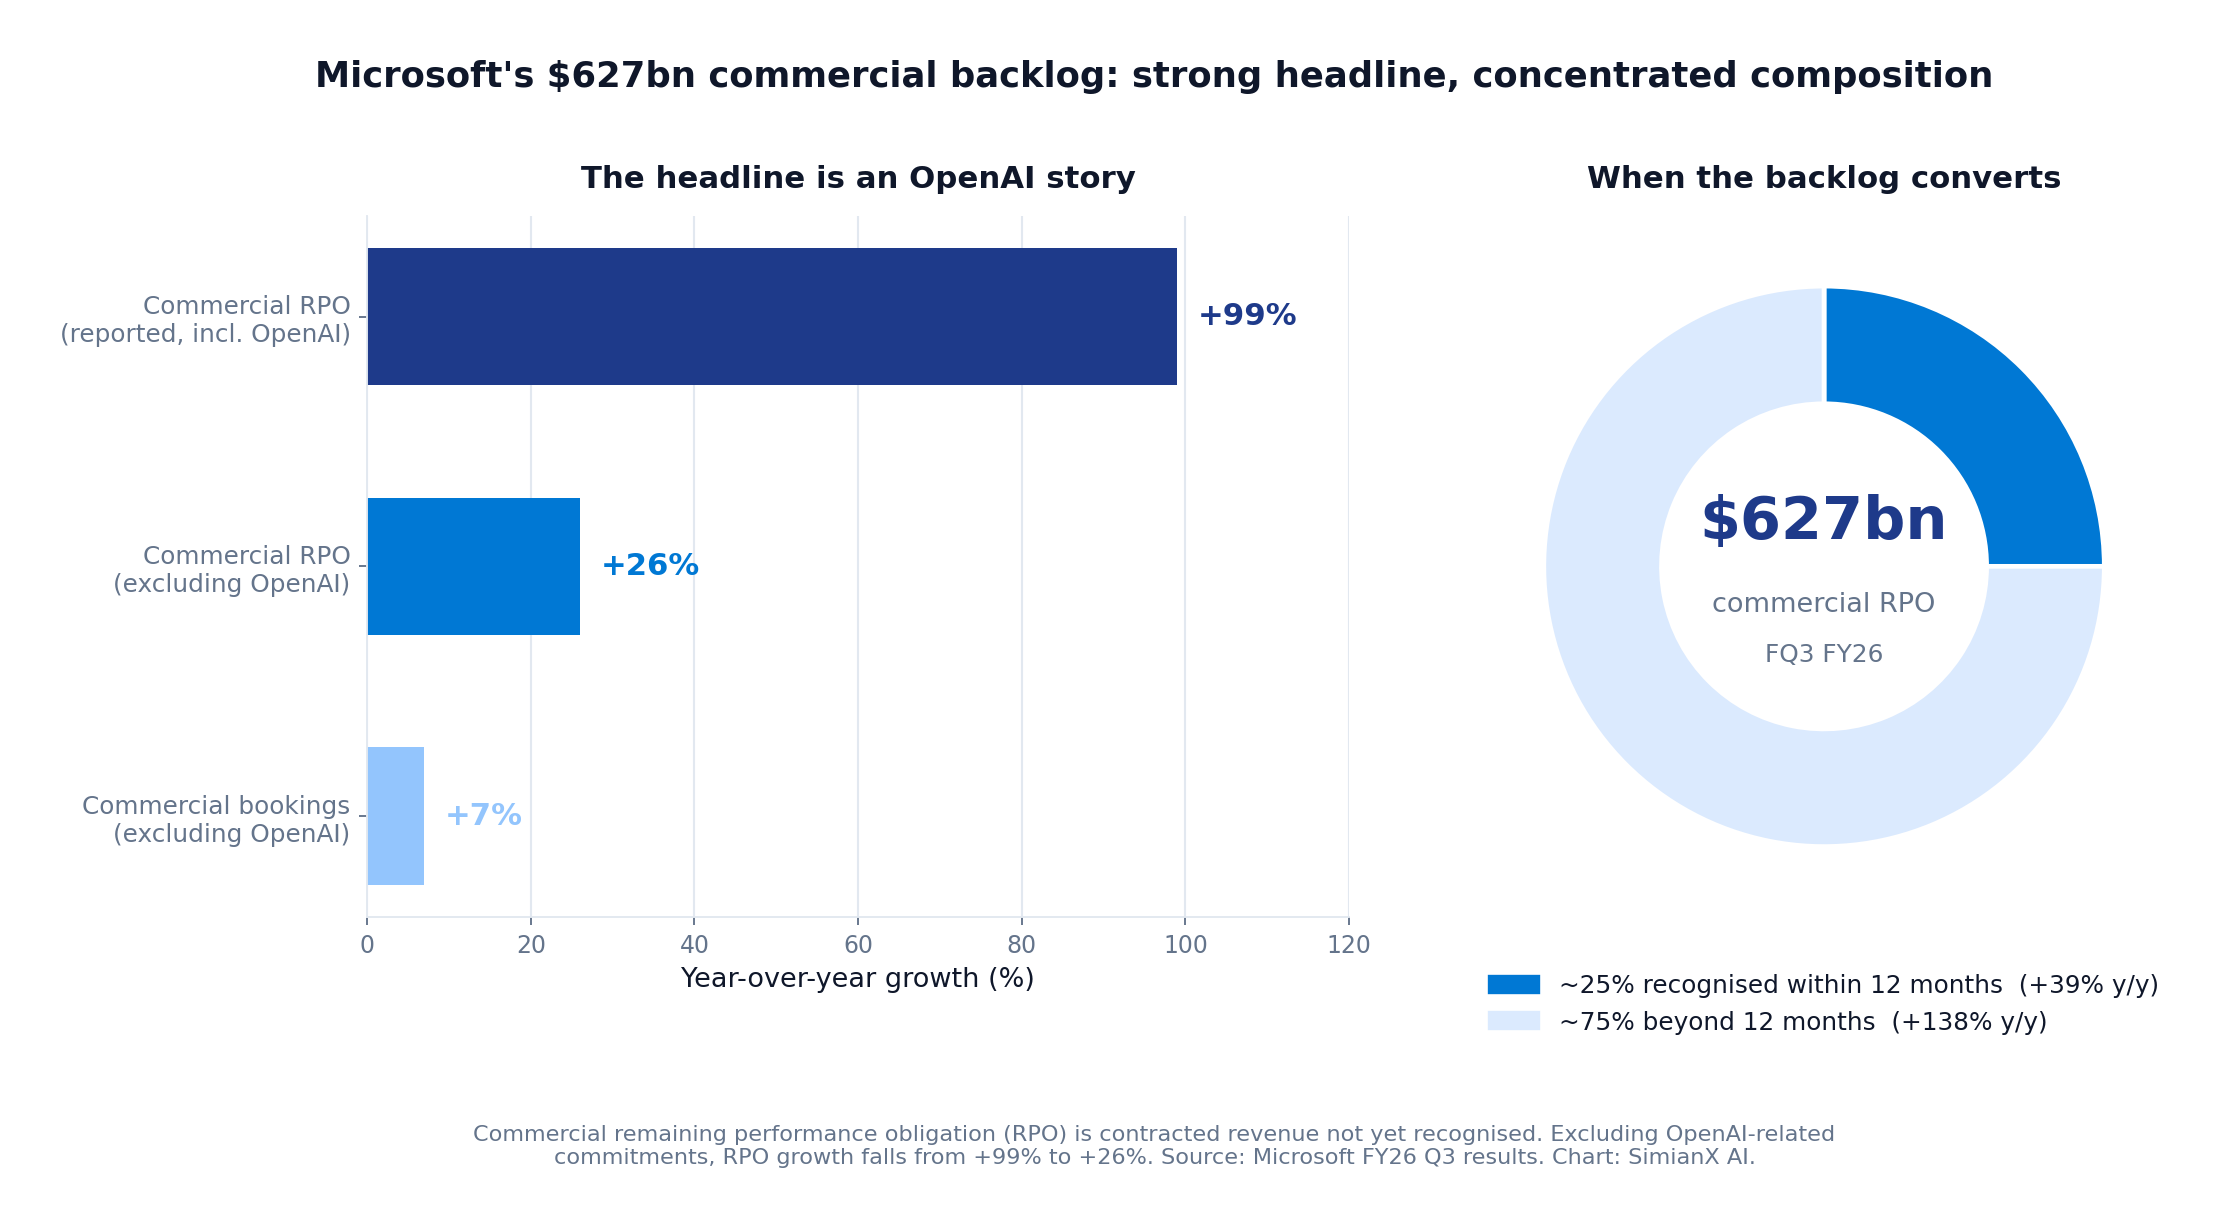
- ภาระผูกพันตามสัญญาที่ยังไม่รับรู้รายได้ (RPO) เชิงพาณิชย์: 6.27 แสนล้านดอลลาร์
- อัตรารายได้ประจำปีของธุรกิจ AI: มากกว่า 37 พันล้านดอลลาร์
- จำนวนที่นั่งที่จ่ายสำหรับ Microsoft 365 Copilot: มากกว่า 20 ล้านที่นั่ง
- กระแสเงินสดจากการดำเนินงาน: 46.7 พันล้านดอลลาร์
- กระแสเงินสดฟรี: 15.8 พันล้านดอลลาร์
- ค่าใช้จ่ายด้านทุน: 31.9 พันล้านดอลลาร์
- อัตรากำไรขั้นต้นของ Microsoft Cloud: 66%
อัตรารายได้จาก AI ของ Microsoft เติบโต 123% เมื่อเปรียบเทียบกับปีที่แล้ว ในขณะที่อัตรากำไรจากการดำเนินงานของบริษัทเพิ่มขึ้นเล็กน้อยเป็น 46% อย่างไรก็ตาม อัตรากำไรขั้นต้นของบริษัทลดลงเนื่องจากการลงทุนในโครงสร้างพื้นฐาน AI และการใช้ผลิตภัณฑ์ AI สร้างต้นทุนเพิ่มเติม
ความกังวลของตลาดจึงเข้าใจได้ Microsoft กำลังสร้างการเติบโตที่น่าทึ่ง แต่ละดอลลาร์ที่เพิ่มขึ้นจากรายได้ AI ในปัจจุบันต้องใช้การใช้จ่ายอย่างมากใน GPU, CPU, การจัดเก็บข้อมูล, เครือข่าย, พลังงาน, การทำความเย็น, ที่ดิน และศูนย์ข้อมูล
การเติบโตของ Azure สามารถชดเชยความเสี่ยงด้านการลงทุน AI ของ Microsoft ได้หรือไม่?
Azure เป็นข้อโต้แย้งที่แข็งแกร่งที่สุดที่สนับสนุนการใช้จ่ายด้านโครงสร้างพื้นฐานของ Microsoft
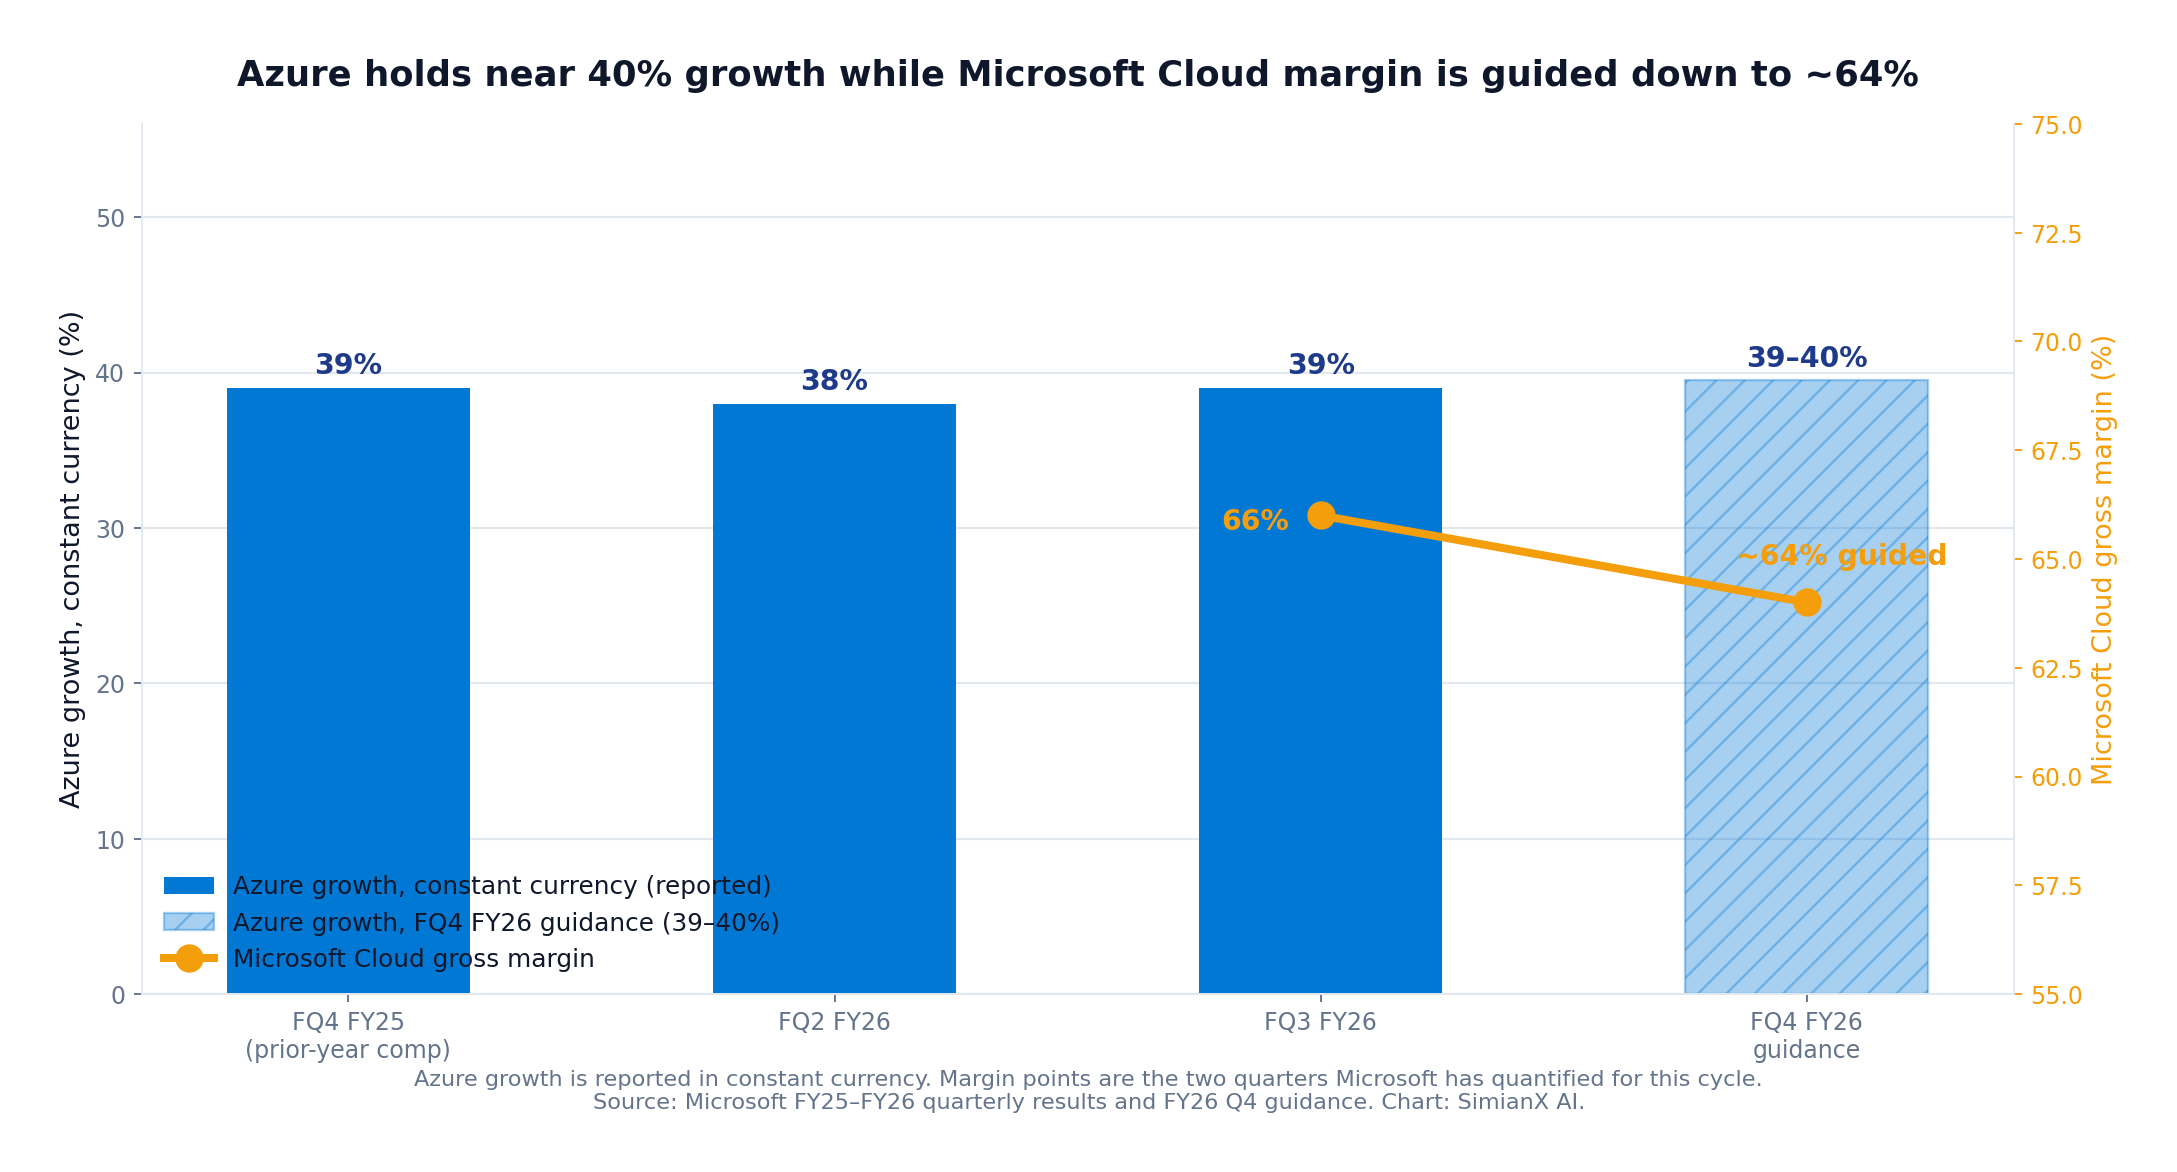
ฝ่ายบริหารคาดว่ารายได้จาก Azure และบริการคลาวด์อื่น ๆ จะเติบโต 39% ถึง 40% ในสกุลเงินคงที่ ในช่วงไตรมาสที่ 4 ของปีงบประมาณ ซึ่งจะเป็นที่น่าสังเกตเป็นพิเศษเพราะ Azure ก็เติบโต 39% ในไตรมาสเดียวกันของปีก่อน ทำให้เกิดการเปรียบเทียบที่ท้าทาย
อัตราการเติบโต 40% บนฐานรายได้ที่ใหญ่กว่าจะสร้างรายได้เพิ่มเติมมากกว่าการเติบโตในอัตราเดียวกันเมื่อหลายปีก่อน Azure ยังได้รับประโยชน์จากแหล่งความต้องการที่ซ้อนทับกันหลายแห่ง:
- การโยกย้ายคลาวด์แบบดั้งเดิม
- การวิเคราะห์ข้อมูลและฐานข้อมูล
- ความปลอดภัยทางไซเบอร์
- การฝึกอบรมโมเดล AI
- การอนุมาน AI
- บริการ Azure OpenAI
- ตัวแทนองค์กร
- การพัฒนาแอปพลิเคชันที่กำหนดเอง
- ความต้องการด้านการจัดเก็บข้อมูล เครือข่าย และการประมวลผล
ความหลากหลายนี้มีความสำคัญ ผลลัพธ์ของ Azure ที่ขับเคลื่อนโดยลูกค้ารุ่นแนวหน้าจำนวนไม่กี่รายจะมีความยั่งยืนน้อยกว่าการเติบโตที่กระจายไปยังธุรกิจนับพันรายและภาระงานหลายประเภท
การเติบโตของ Azure สามารถชดเชยการลงทุน AI ในไตรมาสมิถุนายนได้หรือไม่?
บางส่วน—แต่ไม่ทั้งหมด
การเติบโตของ Azure ใกล้ 40% จะพิสูจน์ว่า Microsoft กำลังขายความสามารถที่นำออนไลน์ได้สำเร็จ มันจะสนับสนุนข้อโต้แย้งของฝ่ายบริหารว่าการใช้จ่ายนั้นเชื่อมโยงกับความต้องการที่มองเห็นได้แทนที่จะเป็นการก่อสร้างโครงสร้างพื้นฐานที่เก็งกำไร
อย่างไรก็ตาม การเติบโตของ Azure เพียงอย่างเดียวไม่สามารถแก้ไขข้อถกเถียงเกี่ยวกับการลงทุนได้อย่างเต็มที่ นักลงทุนยังต้องพิจารณา:
- ว่ารายได้เพิ่มเติมจาก Azure มีอัตรากำไรขั้นต้นที่ยอมรับได้หรือไม่
- ฮาร์ดแวร์ที่ติดตั้งใหม่จะถึงการใช้งานที่มีประสิทธิภาพได้เร็วเพียงใด
- ความสามารถถูกจัดสรรให้กับลูกค้าที่จ่ายหรือการพัฒนา AI ภายใน
- การเติบโตมาจากลูกค้ารายใหญ่จำนวนจำกัดมากน้อยเพียงใด
- ไม่ว่าราคาจะยังคงมีเหตุผลเมื่อการแข่งขันในคลาวด์เพิ่มขึ้น
- ไม่ว่า Microsoft จะสามารถลดต้นทุนต่อ AI token ได้หรือไม่
- ค่าเสื่อมราคาจะเพิ่มขึ้นเร็วเพียงใดในปีงบประมาณ 2027
Microsoft กล่าวว่าได้เพิ่มความสามารถประมาณหนึ่งกิกะวัตต์ในช่วงไตรมาสที่ 3 และยังคงอยู่ในเส้นทางที่จะเพิ่มขนาดโครงสร้างพื้นฐานโดยรวมเป็นสองเท่าในสองปี บริษัทกำลังนำ Maia 200 accelerator มาใช้ ซึ่งฝ่ายบริหารกล่าวว่าให้จำนวน token ต่อดอลลาร์ที่ดีกว่า 30% เมื่อเทียบกับซิลิคอนรุ่นล่าสุดที่มีอยู่เดิมในคลังเซิร์ฟเวอร์ของตน
การปรับปรุงประสิทธิภาพเหล่านี้มีความสำคัญ หาก Microsoft สามารถผลิตผลลัพธ์ AI ได้มากขึ้นจากทุกดอลลาร์ของโครงสร้างพื้นฐาน ก็จะสามารถสนับสนุนการเติบโตของ Azure ที่สูงในขณะที่จำกัดผลกระทบต่อมาร์จิ้นในระยะยาว
ทำไมไตรมาสการใช้จ่ายทุน 40 พันล้านดอลลาร์ของ Microsoft จึงมีความสำคัญ
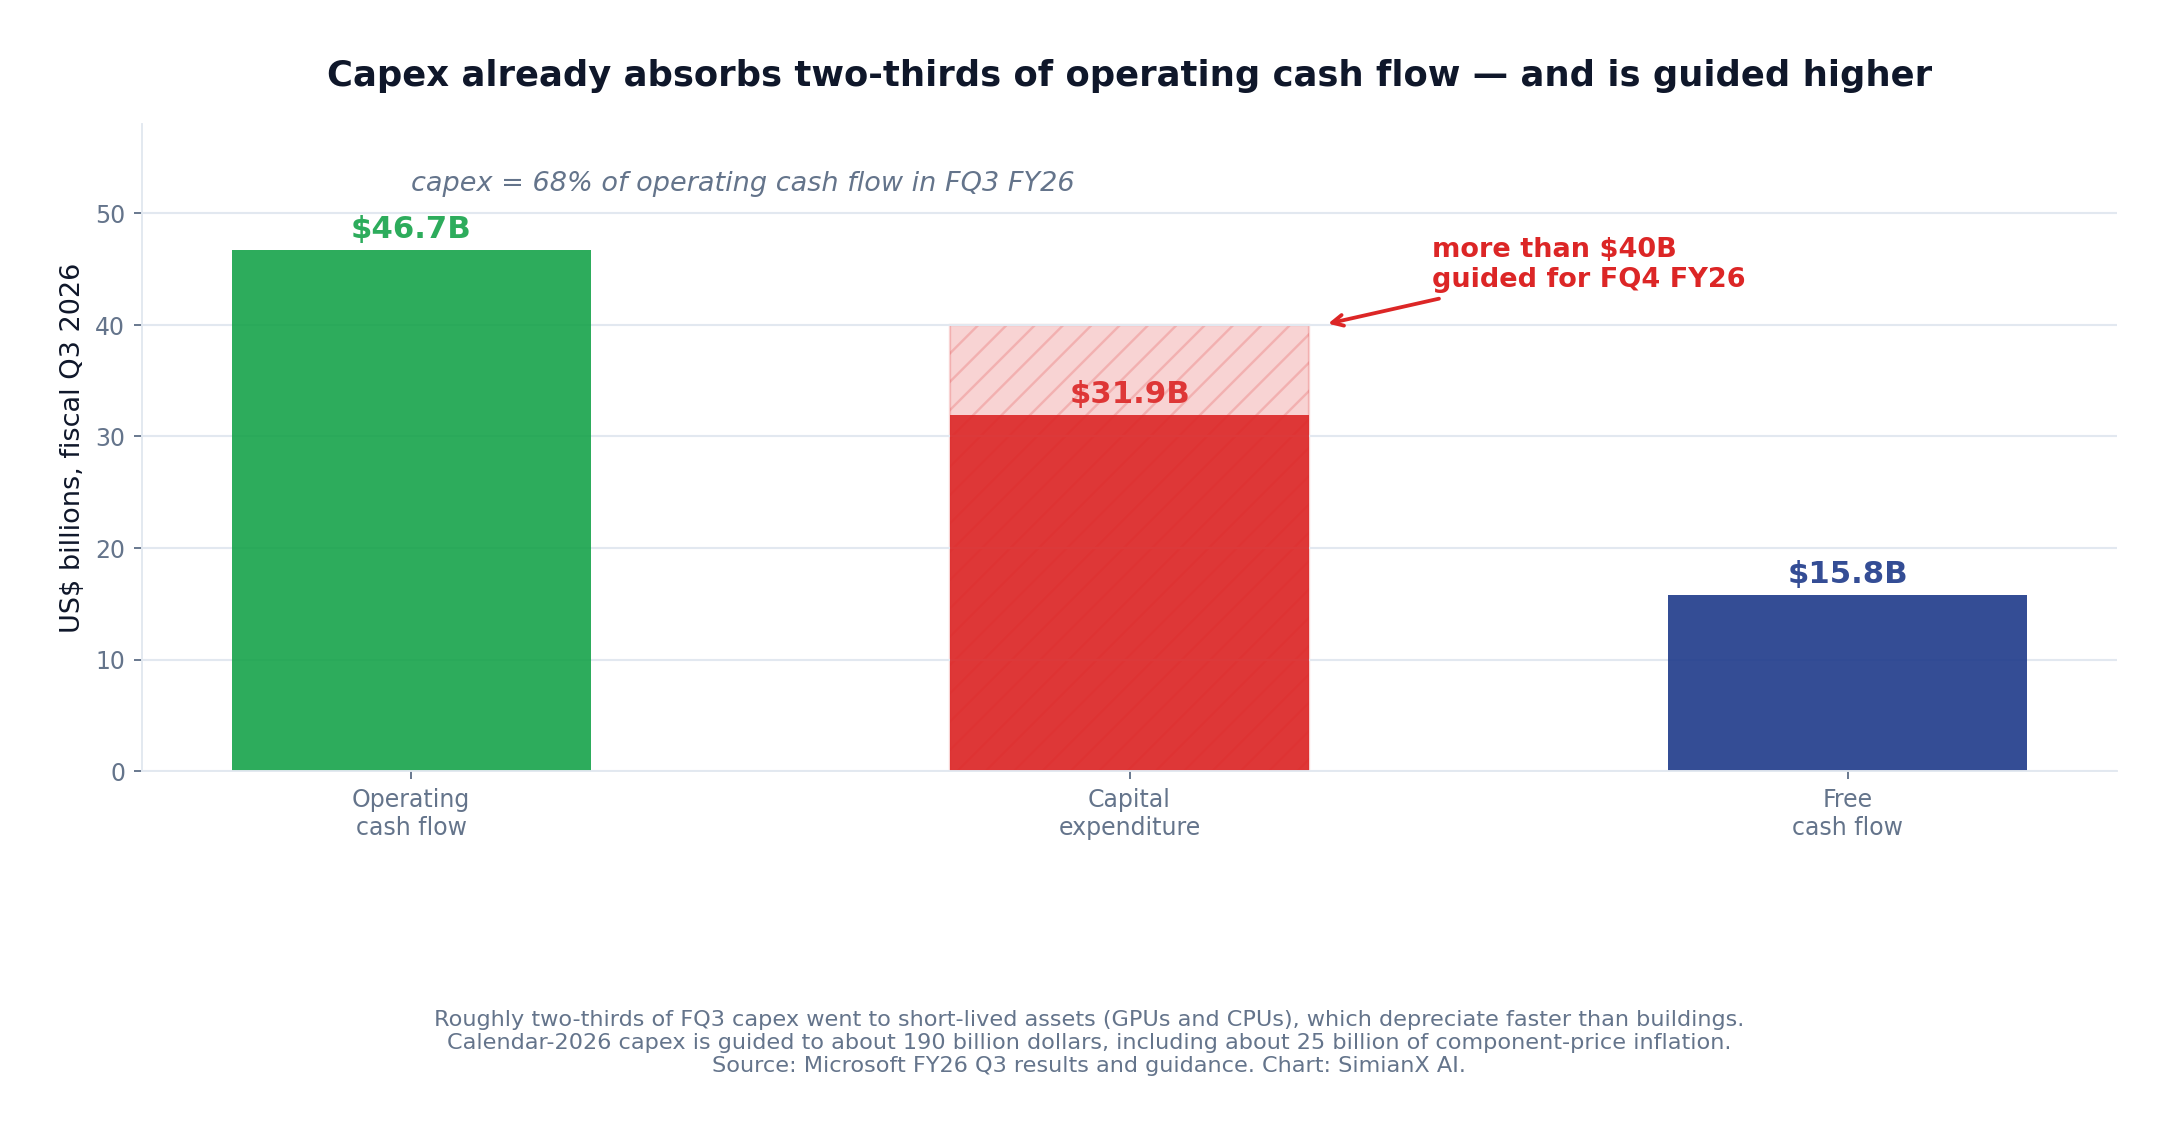
Microsoft คาดว่าการใช้จ่ายทุนในไตรมาสที่ 4 จะเกิน 40 พันล้านดอลลาร์ ซึ่งเพิ่มขึ้นมากกว่า 25% จาก 31.9 พันล้านดอลลาร์ในไตรมาสที่ 3
ประมาณ 5 พันล้านดอลลาร์ของการเพิ่มขึ้นตามลำดับนี้คาดว่าจะมาจากราคาส่วนประกอบที่สูงขึ้น Microsoft ยังคาดว่าการใช้จ่ายทุนในปีปฏิทิน 2026 จะอยู่ที่ประมาณ 190 พันล้านดอลลาร์ รวมถึงประมาณ 25 พันล้านดอลลาร์ที่เกี่ยวข้องกับการเพิ่มขึ้นของราคาองค์ประกอบ
ความแตกต่างนี้มีความสำคัญ การใช้จ่ายทุนที่สูงขึ้นไม่ได้หมายความว่า Microsoft จะได้รับความสามารถในการคอมพิวเตอร์ที่สูงขึ้นในสัดส่วนเสมอไป บางส่วนของการเพิ่มขึ้นนี้แสดงถึงราคาที่สูงขึ้นสำหรับชิป, หน่วยความจำ, การจัดเก็บข้อมูล, การก่อสร้าง และส่วนประกอบอื่นๆ
สินทรัพย์ที่มีอายุสั้นสร้างแรงกดดันในการลดค่าเสื่อมราคาที่เร็วขึ้น
ประมาณสองในสามของการใช้จ่ายทุนในไตรมาสที่ 3 ถูกจัดสรรให้กับสินทรัพย์ที่มีอายุสั้น โดยเฉพาะ GPU และ CPU ส่วนที่เหลืออีกหนึ่งในสามสนับสนุนสินทรัพย์ที่มีอายุยาวนาน เช่น อาคารและโครงสร้างพื้นฐานของศูนย์ข้อมูลที่อาจสนับสนุนการดำเนินงานได้เป็นเวลา 15 ปีหรือมากกว่า
สินทรัพย์ที่มีอายุสั้นสามารถสร้างแรงกดดันทางการเงินที่มากขึ้นในทันที เนื่องจากมีการลดค่าเสื่อมราคาตลอดช่วงเวลาที่สั้นกว่า แม้ว่าเงินสดจะใช้จ่ายในวันนี้ ค่าใช้จ่ายที่เกี่ยวข้องจะยังคงปรากฏในงบกำไรขาดทุนของ Microsoft ในไตรมาสถัดไป
นักลงทุนจึงควรแยกผลกระทบจากการลงทุน (capex) ที่แตกต่างกันสามประการ:
- ผลกระทบทางการเงินทันที: การจ่ายเงินสดลดกระแสเงินสดที่เป็นอิสระ
- การลดค่าเสื่อมราคาในอนาคต: ค่าใช้จ่ายด้านฮาร์ดแวร์ลดอัตรากำไรขั้นต้นและอัตรากำไรจากการดำเนินงานลงตามเวลา
- ความสามารถในการสร้างรายได้ในอนาคต: สินทรัพย์เดียวกันสามารถสนับสนุนรายได้จาก Azure และ AI ที่สูงขึ้น
การลงทุนมีความน่าสนใจทางเศรษฐกิจเฉพาะเมื่อผลกระทบที่สามเกินกว่าสองผลกระทบแรกในที่สุด
อัตรากำไรจากคลาวด์คือตัวถ่วงดุลที่สำคัญที่สุด
ไมโครซอฟท์คาดว่าอัตรากำไรขั้นต้นของ Microsoft Cloud จะอยู่ที่ประมาณ 64% ในไตรมาสที่ 4 ลดลงจาก 66% ในไตรมาสที่ 3 ผู้บริหารระบุว่าการลดลงนี้เกิดจากการลงทุนใน AI ที่ต่อเนื่องและการใช้ GitHub Copilot ที่เพิ่มขึ้น
อัตรากำไรจากคลาวด์ที่ 64% ยังคงมีความสามารถในการทำกำไรสูงในแง่สัมบูรณ์ ความกังวลอยู่ที่ทิศทางของแนวโน้ม
การรวมกันที่แข็งแกร่งที่สุดในไตรมาสที่ 4 จะเป็น:
- การเติบโตของ Azure สูงกว่า 40%
- อัตรากำไรขั้นต้นของคลาวด์ใกล้เคียงหรือสูงกว่า 64%
- การจองเชิงพาณิชย์ที่แข็งแกร่งไม่รวม OpenAI
- การใช้ความสามารถที่เสถียรหรือดีขึ้น
- ไม่มีการเพิ่มคาดการณ์การลงทุนในอนาคตอย่างมีนัยสำคัญ
การรวมกันที่อ่อนแอที่สุดจะเป็น:
- การเติบโตของ Azure ต่ำกว่าคำแนะนำ
- อัตรากำไรจากคลาวด์ต่ำกว่า 63%
- คำแนะนำการลงทุนสูงขึ้น
- กระแสเงินสดที่เป็นอิสระอ่อนแอ
- การเปิดเผยข้อมูลเกี่ยวกับการแปลงรายได้จาก AI ที่จำกัด
การลงทุนสูงสามารถป้องกันได้เมื่อการใช้ประโยชน์ รายได้ และความต้องการที่สัญญาเพิ่มขึ้นพร้อมกัน มันจะกลายเป็นอันตรายเมื่อการใช้จ่ายเร่งตัวขึ้นในขณะที่การเติบโตของคลาวด์และอัตรากำไรชะลอตัวลง
Copilot ต้องกลายเป็นมากกว่าภาพเรื่องการนำไปใช้
Azure เป็นเครื่องมือสร้างรายได้จากโครงสร้างพื้นฐานของไมโครซอฟท์ แต่ Copilot เป็นการทดสอบที่สำคัญว่าไมโครซอฟท์สามารถสร้างรายได้จากซอฟต์แวร์ที่มีมูลค่าสูงขึ้นบนโครงสร้างพื้นฐานนั้นได้หรือไม่
Microsoft รายงานว่ามี ที่นั่ง Microsoft 365 Copilot ที่ชำระเงินมากกว่า 20 ล้านที่นั่ง ในไตรมาสที่ 3 ของปีงบประมาณ จำนวนที่นั่ง Copilot เพิ่มขึ้น 250% เมื่อเทียบกับปีที่แล้ว และจำนวนลูกค้าที่มีที่นั่งมากกว่า 50,000 ที่นั่งเพิ่มขึ้นเป็นสี่เท่า Accenture กลายเป็นลูกค้า Copilot ที่เปิดเผยที่ใหญ่ที่สุดของ Microsoft โดยมีที่นั่งมากกว่า 740,000 ที่นั่ง
ธุรกิจนักพัฒนายังขยายตัวอีกด้วย:
- องค์กรเกือบ 140,000 แห่งใช้ GitHub Copilot
- ผู้สมัครสมาชิก GitHub Copilot สำหรับองค์กรเพิ่มขึ้นเกือบสามเท่าเมื่อเทียบกับปีที่แล้ว
- การใช้งาน GitHub Copilot CLI เพิ่มขึ้นเกือบสองเท่าเมื่อเปรียบเทียบรายเดือน
- Microsoft กำลังเปลี่ยน GitHub Copilot ไปสู่การตั้งราคาแบบใช้มากขึ้น
- จำนวนการค้นหา Copilot ต่อผู้ใช้เพิ่มขึ้นเกือบ 20% เมื่อเปรียบเทียบรายไตรมาส
Microsoft ยังกล่าวว่าเกือบ 90% ของ Fortune 500 มีตัวแทนที่ใช้งานอยู่ซึ่งสร้างขึ้นด้วยผลิตภัณฑ์ที่มีโค้ดต่ำหรือไม่มีโค้ด ขณะที่การใช้พอยต์ Copilot เพิ่มขึ้นเกือบสองเท่าเมื่อเทียบรายไตรมาส
นี่คือสัญญาณการนำไปใช้ที่มีความหมาย แต่ผู้ลงทุนยังต้องการคำตอบที่ดีกว่าเกี่ยวกับเศรษฐศาสตร์
เมตริก Copilot อะไรที่ผู้ลงทุนควรเรียกร้อง?
การประชุมทางการเงินของ Microsoft ในไตรมาสที่ 4 ควรให้หลักฐานในห้าด้าน:
- การเติบโตของที่นั่งที่ชำระเงิน: การทดลองของลูกค้ากำลังเปลี่ยนเป็นการใช้งานอย่างกว้างขวางหรือไม่?
- ความเข้มข้นในการใช้งาน: พนักงานใช้ Copilot บ่อยครั้งหลังจากการใช้งานหรือไม่?
- รายได้เฉลี่ยต่อผู้ใช้: Copilot กำลังเพิ่มราคาของ Microsoft 365 และคุณค่าของลูกค้าหรือไม่?
- รายได้จากการบริโภค: ตัวแทนที่กำหนดเองกำลังสร้างยอดขายที่ใช้ตามการใช้งานเพิ่มเติมหรือไม่?
- ประสิทธิภาพในการอนุมาน: ต้นทุนในการให้บริการแต่ละการโต้ตอบของ Copilot ลดลงหรือไม่?
ผลลัพธ์ที่เหมาะสมคือ โมเดลที่นั่งบวกการบริโภค Microsoft สามารถเก็บรายได้จากการสมัครสมาชิกที่เกิดขึ้นซ้ำสำหรับการเข้าถึงในขณะที่ยังเรียกเก็บค่าธรรมเนียมสำหรับกิจกรรมของตัวแทนที่มีมูลค่าสูงและการใช้งานการคอมพิวเตอร์
อย่างไรก็ตาม การใช้งานที่มากขึ้นอาจลดอัตรากำไรในเบื้องต้นหากต้นทุนการอนุมานเพิ่มขึ้นเร็วกว่าราคา นี่คือเหตุผลหนึ่งที่อัตรากำไรของ Microsoft Cloud และการนำ Copilot ไปใช้ต้องได้รับการประเมินร่วมกัน
งานค้างส่งมอบมูลค่า 6.27 แสนล้านดอลลาร์ของไมโครซอฟท์แข็งแกร่งแค่ไหน?
ภาระผูกพันตามสัญญาที่ยังไม่รับรู้รายได้ (RPO) เชิงพาณิชย์ของไมโครซอฟท์แตะ 6.27 แสนล้านดอลลาร์ ในไตรมาสที่ 3 เพิ่มขึ้น 99% เมื่อเทียบกับปีก่อน หากรวมข้อผูกพันที่เกี่ยวข้องกับ OpenAI
คาดว่าราว 25% ของงานค้างส่งมอบดังกล่าวจะถูกรับรู้เป็นรายได้ภายใน 12 เดือนข้างหน้า ส่วนระยะสั้นนี้เพิ่มขึ้น 39% เมื่อเทียบกับปีก่อน ขณะที่ส่วนที่กำหนดไว้เกิน 12 เดือนเพิ่มขึ้น 138%
เมื่อมองผิวเผิน ตัวเลขนี้ดูเหมือนให้ความชัดเจนด้านรายได้ที่ยอดเยี่ยม อย่างไรก็ตาม นักลงทุนควรพิจารณาองค์ประกอบอย่างละเอียด
RPO เชิงพาณิชย์เติบโตเพียง 26% เมื่อไม่รวม OpenAI ส่วนยอดสั่งซื้อเชิงพาณิชย์เพิ่มขึ้น 7% เมื่อไม่รวม OpenAI แต่กลับลดลงเมื่อรวมข้อผูกพันของ OpenAI เนื่องจากจังหวะเวลาของสัญญาและฐานเปรียบเทียบ
สิ่งนี้ไม่ได้ทำให้งานค้างส่งมอบมีคุณภาพต่ำ แต่ชี้ให้เห็นว่าตัวเลขพาดหัวได้รับอิทธิพลจากลูกค้าเชิงกลยุทธ์รายใหญ่รายเดียว
การประชุมแถลงผลประกอบการควรชี้แจงประเด็นต่อไปนี้:
- RPO ผูกกับ OpenAI มากน้อยเพียงใด
- สัญญามีข้อผูกพันขั้นต่ำที่แน่นอนหรือไม่
- อัตราการแปลงงานค้างส่งมอบเป็นรายได้ที่คาดไว้
- ลูกค้ารายใหญ่ใช้กำลังการผลิตตามกำหนดหรือไม่
- จะรับรู้รายได้เท่าใดหลังปีงบประมาณ 2027
- ความต้องการเชิงพาณิชย์ที่ไม่ใช่ OpenAI กำลังเร่งตัวหรือไม่
- อัตรากำไรของงานค้างส่งมอบสอดคล้องกับเศรษฐศาสตร์ของ Azure ในปัจจุบันหรือไม่
งานค้างส่งมอบที่หนุนด้วยข้อผูกพันจากองค์กรที่หลากหลายจะทำให้แผนการลงทุนปกป้องได้ง่ายขึ้น ส่วนงานค้างส่งมอบที่กระจุกตัวมากขึ้นในห้องปฏิบัติการ AI เพียงไม่กี่แห่งจะสร้างความเสี่ยงด้านคู่สัญญาและการใช้กำลังการผลิตที่สูงขึ้น
Microsoft 365 ช่วยค้ำเหตุผลการลงทุนใน AI
กลุ่มธุรกิจ Productivity and Business Processes ของไมโครซอฟท์มอบความได้เปรียบสำคัญเหนือคู่แข่งด้าน AI ที่เน้นโครงสร้างพื้นฐานเป็นหลัก
สำหรับไตรมาสการเงิน Q4 ไมโครซอฟท์คาดว่ารายได้จากกลุ่มจะอยู่ที่ 37.0 พันล้านดอลลาร์ถึง 37.3 พันล้านดอลลาร์ ซึ่งแสดงถึงการเติบโตที่ 12% ถึง 13% รายได้จากคลาวด์เชิงพาณิชย์ Microsoft 365 คาดว่าจะเติบโต 13% ถึง 14% ในสกุลเงินคงที่ตามที่รายงาน หรือ 15% ถึง 16% หลังจากการปรับปรุงผลประโยชน์ทางบัญชีในปีที่แล้ว
Microsoft 365 ให้เส้นทางโดยตรงแก่บริษัทในการกระจาย AI ไปยัง:
- Word
- Excel
- PowerPoint
- Outlook
- Teams
- SharePoint
- Dynamics
- Power Platform
- ผลิตภัณฑ์ด้านความปลอดภัย
การกระจายนี้ช่วยลดต้นทุนการเข้าถึงลูกค้าและทำให้ไมโครซอฟท์สามารถสร้างรายได้จากโครงสร้างพื้นฐาน AI เดียวกันผ่านผลิตภัณฑ์หลายรายการ
ตัวอย่างเช่น ลูกค้าองค์กรหนึ่งรายอาจสร้างรายได้จากการคอมพิวเตอร์ Azure, การสมัครสมาชิก Microsoft 365, ใบอนุญาต Copilot, ผลิตภัณฑ์ด้านความปลอดภัย, การบริโภคของตัวแทน, การจัดเก็บข้อมูล, และเครื่องมือ GitHub
โมเดลแบบเต็มสแต็คนี้เป็นเหตุผลที่แข็งแกร่งที่สุดที่ไมโครซอฟท์อาจได้รับผลตอบแทนที่น่าสนใจจากการลงทุนใน AI แม้จะมีแรงกดดันด้านมาร์จิ้นในปัจจุบัน
ฝั่งผู้บริโภคที่อ่อนแรงอาจจำกัดการทำได้เกินคาด
ไม่ใช่ทุกธุรกิจของไมโครซอฟท์ที่กำลังเร่งตัว
ฝ่ายบริหารคาดว่ารายได้กลุ่ม More Personal Computing จะอยู่ที่ 11.75 พันล้านดอลลาร์ถึง 12.25 พันล้านดอลลาร์ ต่ำกว่ารายได้ 13.45 พันล้านดอลลาร์ที่รายงานในไตรมาสปีที่แล้ว รายได้จาก Windows OEM และอุปกรณ์คาดว่าจะลดลงราว 15–19% ขณะที่รายได้จากเนื้อหาและบริการ Xbox คาดว่าจะลดลงราว 10–13%
ไมโครซอฟท์ได้กล่าวถึงแรงกดดันหลายประการ:
- การเปรียบเทียบที่ยากลำบากสำหรับ Windows 10 ที่สิ้นสุดการสนับสนุน
- สต็อกสินค้าช่องทางสูง
- ราคาหน่วยความจำที่สูงขึ้น
- ตลาด PC ที่อ่อนแอ
- การเปรียบเทียบเนื้อหาการเล่นเกมที่ยากลำบาก
- การเปลี่ยนแปลงราคาของ Xbox Game Pass
การโฆษณาค้นหาที่ไม่รวมต้นทุนการเข้าถึงการจราจรคาดว่าจะเติบโตในระดับเลขหลักเดียวช่วงสูง (ราว 7–9%) โดยได้รับการสนับสนุนจากการเพิ่มส่วนแบ่งของ Bing และ Edge แต่สิ่งนี้อาจไม่เพียงพอที่จะชดเชยความอ่อนแอของ Windows และการเล่นเกม
นี่สร้างความแตกต่างที่สำคัญสำหรับนักลงทุน: Microsoft อาจรายงานผลลัพธ์ Azure ที่ยอดเยี่ยมในขณะที่รายได้รวมใกล้เคียงฉันทามติ แทนที่จะสูงกว่าอย่างมีนัยสำคัญ
สถานการณ์เชิงบวก ฐาน และเชิงลบ สำหรับไตรมาส 4 ปี 2026
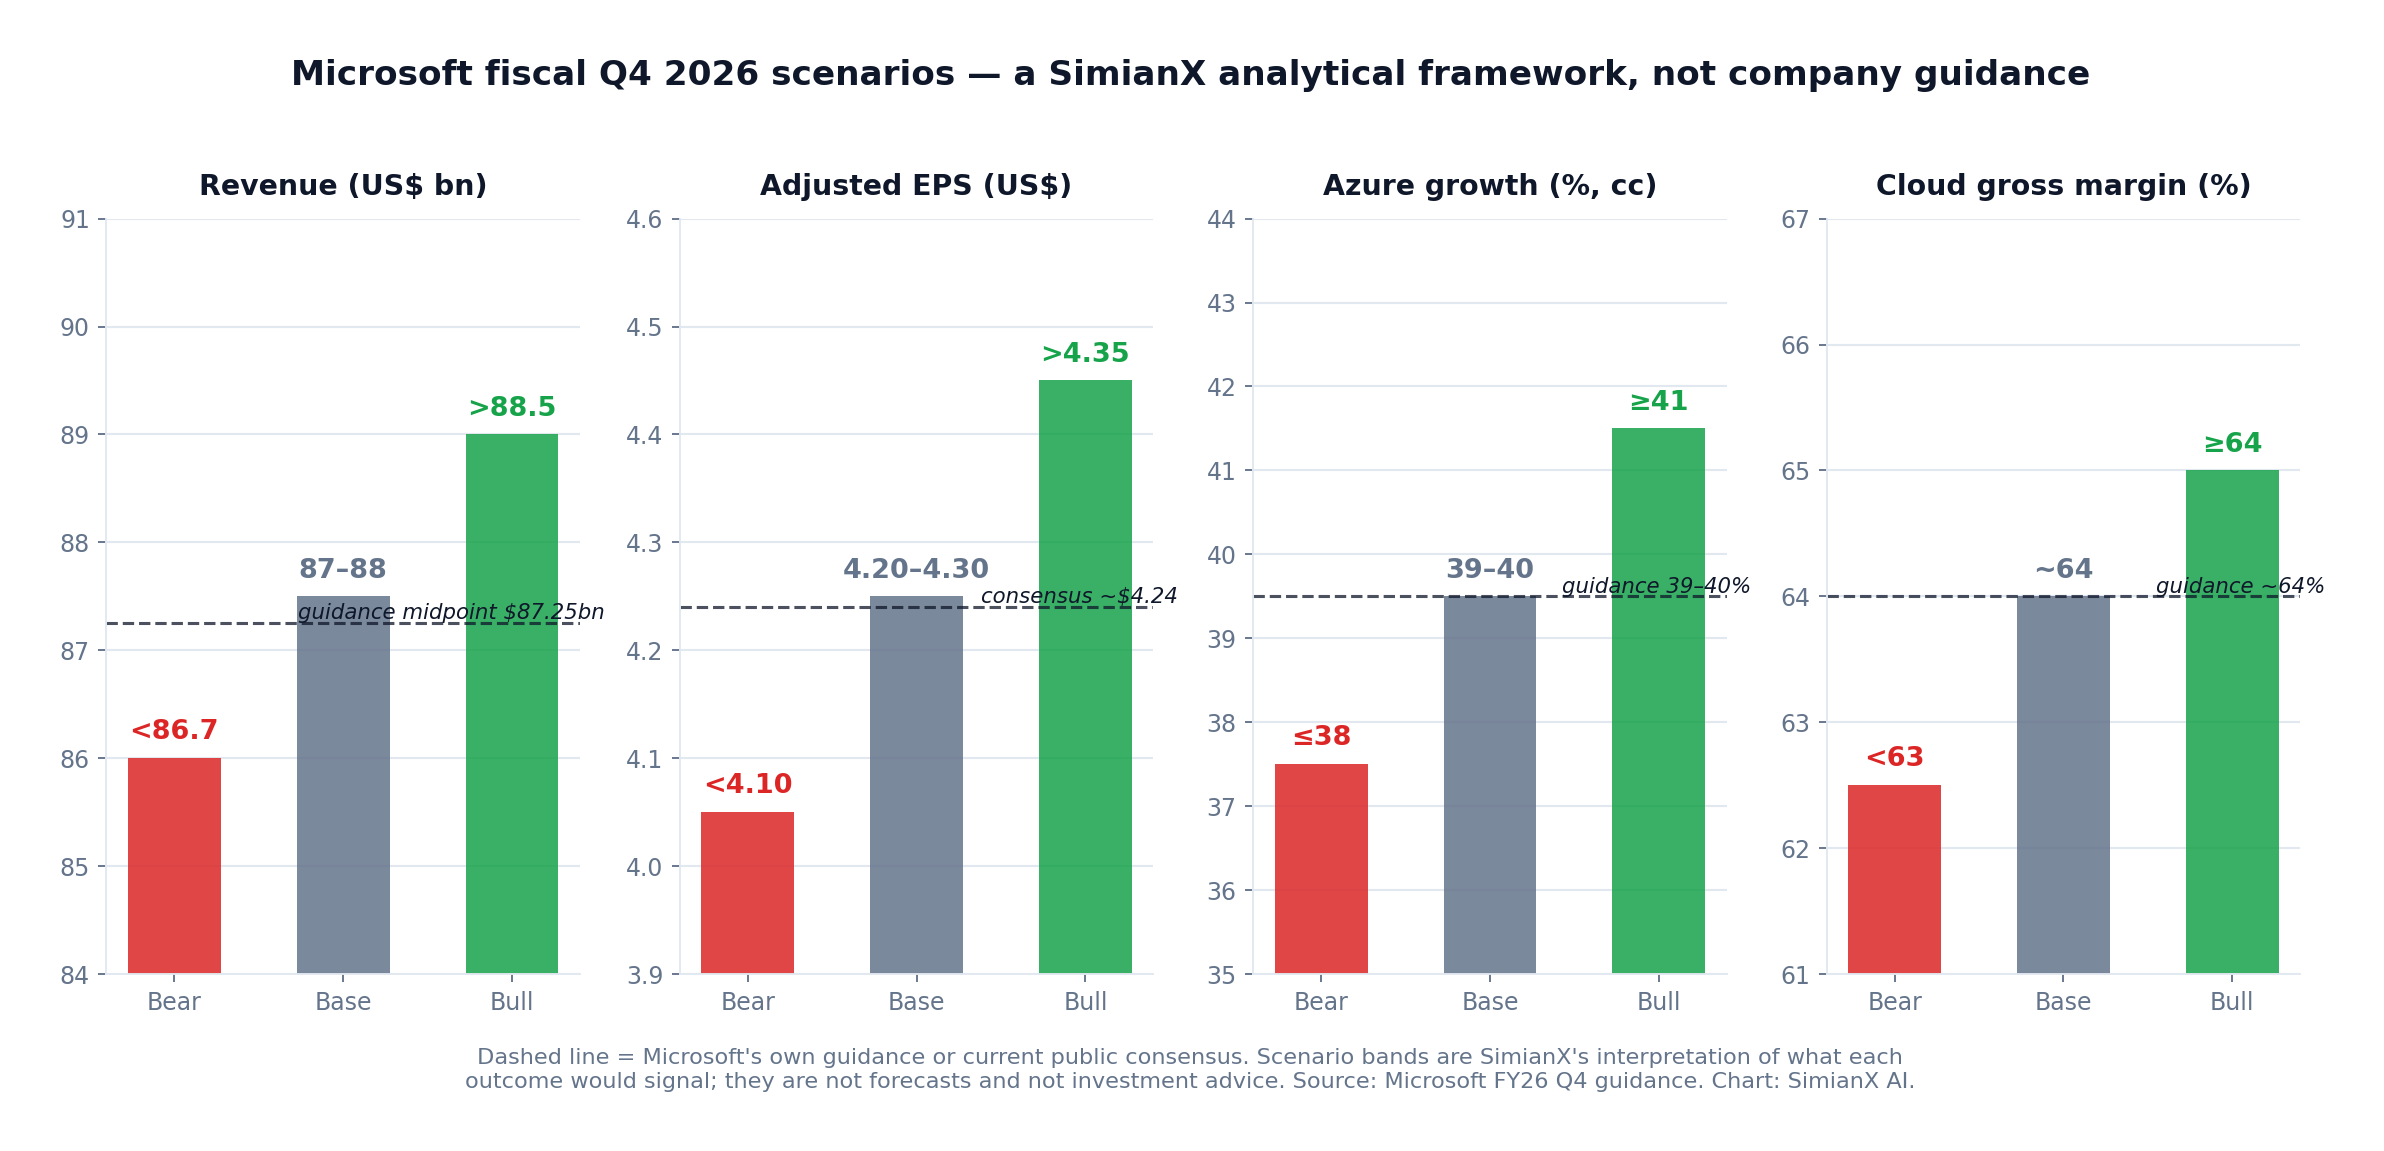
สถานการณ์ต่อไปนี้เป็น กรอบการวิเคราะห์ของ SimianX ไม่ใช่แนวทางอย่างเป็นทางการของบริษัทหรือการรับประกันผลการดำเนินงานของตลาด
| สถานการณ์ | สัญญาณ Q4 ที่เป็นไปได้ | การตีความตลาดที่น่าจะเป็น |
|---|---|---|
| กรณีเชิงบวก | รายได้สูงกว่า 8.85 หมื่นล้านดอลลาร์; EPS สูงกว่า 4.35 ดอลลาร์; การเติบโตของ Azure ที่ 41% หรือดีกว่า; อัตรากำไรจากคลาวด์อย่างน้อย 64%; การจองที่แข็งแกร่งไม่รวม OpenAI; ความเห็นเกี่ยวกับการใช้จ่ายทุน FY2027 ที่ควบคุม | ความสามารถ AI ใหม่กำลังถูกนำไปใช้สร้างรายได้เร็วกว่าที่คาดการณ์ สนับสนุนการเติบโตของรายได้และกระแสเงินสดในอนาคต |
| กรณีฐาน | รายได้ราว 8.7–8.8 หมื่นล้านดอลลาร์; EPS ราว 4.20–4.30 ดอลลาร์; การเติบโตของ Azure ที่ 39%–40%; อัตรากำไรจากคลาวด์ใกล้ 64%; การใช้จ่ายทุนยังคงสูง | ทฤษฎีการลงทุน AI ของ Microsoft ยังคงอยู่ แต่การเพิ่มมูลค่าขึ้นอยู่กับผลตอบแทนทางการเงินในปี 2027 ที่ดีขึ้น |
| กรณีเชิงลบ | รายได้ต่ำกว่า 8.67 หมื่นล้านดอลลาร์; EPS ต่ำกว่า 4.10 ดอลลาร์; การเติบโตของ Azure ที่ 38% หรือน้อยกว่า; อัตรากำไรจากคลาวด์ต่ำกว่า 63%; การจองที่อ่อนแอกว่า; การใช้จ่ายทุนในอนาคตที่สูงขึ้น | ต้นทุนโครงสร้างพื้นฐานกำลังเพิ่มขึ้นเร็วกว่าการสร้างรายได้ ทำให้เกิดความกังวลเกี่ยวกับกระแสเงินสดฟรีและอัตรากำไร |
ตลาดออปชั่นกำลังตั้งราคาให้มีการเคลื่อนไหวประมาณ 8.9% ในทั้งสองทิศทางก่อนการรายงาน ซึ่งบ่งชี้ว่าเทรดเดอร์คาดว่าจะมีความผันผวนสูง การเคลื่อนไหวที่บ่งชี้จากออปชั่นเปลี่ยนแปลงอย่างต่อเนื่องและไม่ควรถูกมองว่าเป็นการคาดการณ์ทิศทาง
ความคิดเห็นจากนักวิเคราะห์ล่าสุดได้มุ่งเน้นน้อยลงเกี่ยวกับว่า Microsoft สามารถเอาชนะ EPS รายไตรมาสได้หรือไม่ และมากขึ้นเกี่ยวกับว่า การเร่งตัวของ Azure สามารถตรงกับการใช้จ่ายทุนที่สูงขึ้นได้หรือไม่ ปัญหาอื่น ๆ รวมถึงการพึ่งพา GPU ของบุคคลที่สาม การแข่งขันจากผลิตภัณฑ์ AI ที่เกิดขึ้นใหม่ และความเป็นไปได้ที่ตัวแทน AI จะทำให้ราคาซอฟต์แวร์แบบดั้งเดิมต่อที่นั่งเกิดการเปลี่ยนแปลง
สกอร์การ์ดประเมินผลประกอบการไมโครซอฟท์แบบใช้งานจริง
นักลงทุนสามารถประเมินรายงานโดยใช้กรอบการทำงานเจ็ดขั้นตอนดังต่อไปนี้
1. เปรียบเทียบการเติบโตของ Azure กับแนวทาง
- บวก: มากกว่า 40%
- กลาง: 39%–40%
- ลบ: ต่ำกว่า 39%
ความแตกต่างเล็กน้อยมีความสำคัญเพราะ Azure เป็นหลักฐานหลักที่แสดงให้เห็นว่าความสามารถใหม่กำลังสร้างรายได้
2. ตรวจสอบอัตรากำไรขั้นต้นของ Microsoft Cloud
- บวก: 64% หรือสูงกว่า
- กลาง: ประมาณ 63.5%–64%
- ลบ: ต่ำกว่า 63%
ประสิทธิภาพของอัตรากำไรแสดงให้เห็นว่าประสิทธิภาพของแพลตฟอร์มสามารถชดเชยค่าใช้จ่ายด้านโครงสร้างพื้นฐานและการอนุมาน AI ได้หรือไม่
3. แยกงานค้างส่งมอบที่รวมและไม่รวม OpenAI
การเติบโตของ RPO ที่เป็นหัวข้อข่าวมีข้อมูลน้อยลงหากไม่เข้าใจการกระจุกตัวของลูกค้า มุ่งเน้นไปที่การจองเชิงพาณิชย์และ RPO ที่ไม่รวมข้อผูกพันที่เกี่ยวข้องกับ OpenAI
4. วัดการสร้างรายได้จาก Copilot
มองหาการเพิ่มจำนวนที่นั่งที่ต้องชำระเงิน, การเติบโตของการใช้งาน, การขยายตัวของ ARPU, การปรับใช้ลูกค้า, พฤติกรรมการต่ออายุ, และรายได้ตามการบริโภค
5. ตรวจสอบคุณภาพของ Capex ไม่ใช่แค่ขนาดของ Capex
กำหนดว่าการใช้จ่ายมีการสะท้อนถึง:
- ปริมาณการประมวลผลเพิ่มเติม
- ราคาส่วนประกอบที่สูงขึ้น
- เวลาการเช่าทางการเงิน
- ฮาร์ดแวร์ AI ที่มีอายุการใช้งานสั้น
- อาคารและโครงสร้างพื้นฐานที่มีอายุการใช้งานยาวนาน
จำนวนเงินดอลลาร์ที่สูงขึ้นไม่ได้หมายความว่าเป็นความสามารถที่ใช้งานได้มากขึ้นโดยอัตโนมัติ
6. ตรวจสอบกระแสเงินสดอิสระอย่างรอบคอบ
ค่าใช้จ่ายด้านทุนและการเช่าทางการเงินสามารถสร้างความแตกต่างด้านเวลาระหว่าง capex ที่รายงานและการซื้อเงินสดของทรัพย์สินและอุปกรณ์ นักลงทุนควรเปรียบเทียบกระแสเงินสดจากการดำเนินงาน, capex เงินสด, การเช่าทางการเงิน, และกระแสเงินสดอิสระแทนที่จะพึ่งพาหมายเลขเดียว
7. ให้ความสำคัญกับแนวทางการเงินปี 2027
การตอบสนองของหุ้นอาจขึ้นอยู่กับความคิดเห็นในอนาคตมากกว่าผลลัพธ์ในไตรมาสที่ 4
ผู้บริหารได้ระบุแล้วว่าคาดว่าจะมีอีกหนึ่งปีงบประมาณที่รายได้และกำไรจากการดำเนินงานเติบโตในระดับสองหลัก นักลงทุนจะต้องการรายละเอียดเพิ่มเติมเกี่ยวกับ:
- การเติบโตของ Azure ในไตรมาสกันยายน
- ค่าใช้จ่ายลงทุนปีงบประมาณ 2027
- ค่าใช้จ่ายในการเสื่อมราคา
- อัตรากำไรขั้นต้นจากคลาวด์
- ข้อจำกัดด้านความสามารถของ AI
- การเติบโตของ Microsoft 365 Copilot
- จำนวนพนักงานและค่าใช้จ่ายในการดำเนินงาน
Microsoft คาดว่าการเติบโตของ Azure จะเร่งตัวขึ้นเล็กน้อยในช่วงครึ่งหลังของปีปฏิทิน 2026 แม้ว่าข้อจำกัดด้านความสามารถอาจยังคงมีอยู่จนถึงสิ้นปี
ผู้ใช้ SimianX AI สามารถนำสกอร์การ์ดเชิงปัจจัยพื้นฐานนี้ไปรวมกับความเชื่อมั่นจากข่าวแบบเรียลไทม์ สัญญาณทางเทคนิค กิจกรรมออปชั่น และการวิเคราะห์ภาษาของผู้บริหาร เพื่อแยกแยะว่าปฏิกิริยาต่อผลประกอบการเป็นเพียงชั่วคราว หรือเป็นการเปลี่ยนแปลงถาวรของทฤษฎีการลงทุนใน MSFT
คำถามที่พบบ่อยเกี่ยวกับผลกำไร Q4 ของ Microsoft 2026
Microsoft จะรายงานผลกำไร Q4 ในปี 2026 เมื่อใด?
Microsoft จะประกาศผลการดำเนินงานปีงบประมาณ Q4 2026 หลังจากที่ตลาดสหรัฐฯ ปิดในวันพุธที่ 29 กรกฎาคม 2026 การโทรหารายได้จะเริ่มขึ้นเวลา 14:30 น. ตามเวลามหาสมุทรแปซิฟิก หรือประมาณ 05:30 น. ตามเวลาในสิงคโปร์ในวันพฤหัสบดีที่ 30 กรกฎาคม
การคาดการณ์รายได้ Q4 2026 ของ Microsoft คืออะไร?
Microsoft คาดการณ์รายได้ระหว่าง 86.7 พันล้านดอลลาร์ถึง 87.8 พันล้านดอลลาร์ การประมาณการฉันทามติสาธารณะในปัจจุบันอยู่ที่ประมาณ 87.6 พันล้านดอลลาร์ ซึ่งอยู่ใกล้ครึ่งบนของช่วงที่ผู้บริหารกำหนดไว้
การคาดการณ์การเติบโตของ Azure สำหรับผลกำไร Q4 ของ Microsoft คืออะไร?
Microsoft คาดว่ารายได้จาก Azure และบริการคลาวด์อื่น ๆ จะเติบโต 39% ถึง 40% ในสกุลเงินคงที่ ผลลัพธ์ที่สูงกว่า 40% จะบ่งชี้ว่าความสามารถที่เพิ่งนำไปใช้กำลังเปลี่ยนเป็นการบริโภคของลูกค้าได้เร็วกว่าที่คาดไว้
การเติบโตของ Azure สามารถชดเชยค่าใช้จ่ายลงทุน AI ของ Microsoft ได้หรือไม่?
การเติบโตของ Azure สามารถชดเชยค่าใช้จ่ายลงทุน AI ได้หากโครงสร้างพื้นฐานใหม่สร้างรายได้ที่ยั่งยืน ราคาที่มั่นคง การใช้ที่สูง และอัตรากำไรจากคลาวด์ที่ยอมรับได้ การเติบโตใกล้ 40% จะเป็นสัญญาณที่น่าพอใจ แต่ผู้ลงทุนยังต้องการหลักฐานว่ากระแสเงินสดอิสระและอัตรากำไรสามารถปรับปรุงได้เมื่อโครงสร้างพื้นฐานถึงขนาด
หุ้น MSFT ควรซื้อก่อนรายงานผลประกอบการไตรมาส 4 หรือไม่?
ขึ้นอยู่กับระยะเวลาการลงทุนของนักลงทุน สมมติฐานการประเมินมูลค่า และความทนทานต่อความผันผวนของผลกำไร ผลลัพธ์ที่แข็งแกร่งจาก Azure อาจยังตามมาด้วยปฏิกิริยาตลาดที่เป็นลบหาก Microsoft เพิ่มความคาดหวังด้านการลงทุนหรือรายงานอัตรากำไรจากคลาวด์ที่อ่อนแอกว่า รายงานควรถูกมองว่าเป็นเหตุการณ์ข้อมูลมากกว่าตัวกระตุ้นทิศทางที่รับประกัน
สรุป
ผลประกอบการไตรมาส 4 ปี 2026 ของ Microsoft จะกำหนดว่านักลงทุนมองว่าโครงการโครงสร้างพื้นฐาน AI ของบริษัทเป็นการขยายตัวที่มีระเบียบซึ่งได้รับการสนับสนุนจากความต้องการที่ยอดเยี่ยม—หรือเป็นการแข่งขันที่มีค่าใช้จ่ายสูงขึ้นเรื่อยๆ โดยมีผลตอบแทนที่ไม่แน่นอน
หลักฐานที่สนับสนุน Microsoft ยังคงมีมากมาย:
- Azure เติบโต 39% ในสกุลเงินคงที่ในไตรมาส 3
- ความต้องการยังคงเกินความสามารถที่มีอยู่
- ธุรกิจ AI ของ Microsoft มีรายได้ประจำปีเกิน 37 พันล้านดอลลาร์
- Microsoft 365 Copilot มีผู้ใช้ที่จ่ายแล้วเกิน 20 ล้านที่นั่ง
- RPO เชิงพาณิชย์ถึง 627 พันล้านดอลลาร์
- Microsoft สามารถกระจาย AI ไปยังคลาวด์ ผลผลิต ความปลอดภัย การพัฒนา และแอปพลิเคชันธุรกิจ
แต่ความเสี่ยงกำลังกลายเป็นสิ่งที่ยากจะมองข้าม:
- การใช้จ่ายด้านการลงทุนในไตรมาสจะเกิน 40 พันล้านดอลลาร์
- การใช้จ่ายด้านการลงทุนในปีปฏิทินคาดว่าจะถึงประมาณ 190 พันล้านดอลลาร์
- อัตราเงินเฟ้อของส่วนประกอบลดความสามารถที่ได้รับต่อดอลลาร์
- อัตรากำไรขั้นต้นของ Microsoft Cloud คาดว่าจะลดลงเหลือประมาณ 64%
- ฮาร์ดแวร์ AI ที่มีอายุสั้นจะทำให้ค่าเสื่อมราคาเพิ่มขึ้น
- OpenAI เป็นองค์ประกอบสำคัญของงานค้างส่งมอบ
- Windows และเกมคาดว่าจะลดลง
ผลลัพธ์ที่น่าเชื่อถือที่สุดจะรวมถึง การเติบโตของ Azure เกิน 40% อัตรากำไรจากคลาวด์ใกล้เคียงหรือสูงกว่าคำแนะนำ การสร้างรายได้จาก Copilot ที่เร่งตัว การจองเชิงพาณิชย์ที่หลากหลาย และความคิดเห็นด้านการใช้จ่ายที่มีระเบียบในปีงบประมาณ 2027
ผลลัพธ์ที่น่าเชื่อถือน้อยที่สุดจะเป็นการเพิ่มขึ้นอีกครั้งในค่าใช้จ่ายโดยไม่มีการปรับปรุงที่สอดคล้องกันในด้านการเติบโตของ Azure อัตรากำไร และการแปลงงานค้างส่งมอบเป็นรายได้
ใช้ SimianX AI เพื่อติดตามความประหลาดใจด้านรายได้ของ Microsoft, ความรู้สึกของผู้บริหาร, ปฏิกิริยาตลาดแบบเรียลไทม์, และการวิเคราะห์หลายตัวแทนเมื่อการอภิปรายเกี่ยวกับการลงทุนด้าน AI เคลื่อนจากคำมั่นสัญญาด้านโครงสร้างพื้นฐานไปสู่ผลตอบแทนทางการเงินที่วัดได้
การอ่านที่เกี่ยวข้อง
แหล่งอ้างอิง
การวิจัยนี้มีวัตถุประสงค์เพื่อข้อมูลและการศึกษาเท่านั้นและไม่ถือเป็นคำแนะนำด้านการลงทุน, กฎหมาย, หรือภาษี