
The Netflix Question Nobody Is Asking: What Happened After the Warner Deal Died
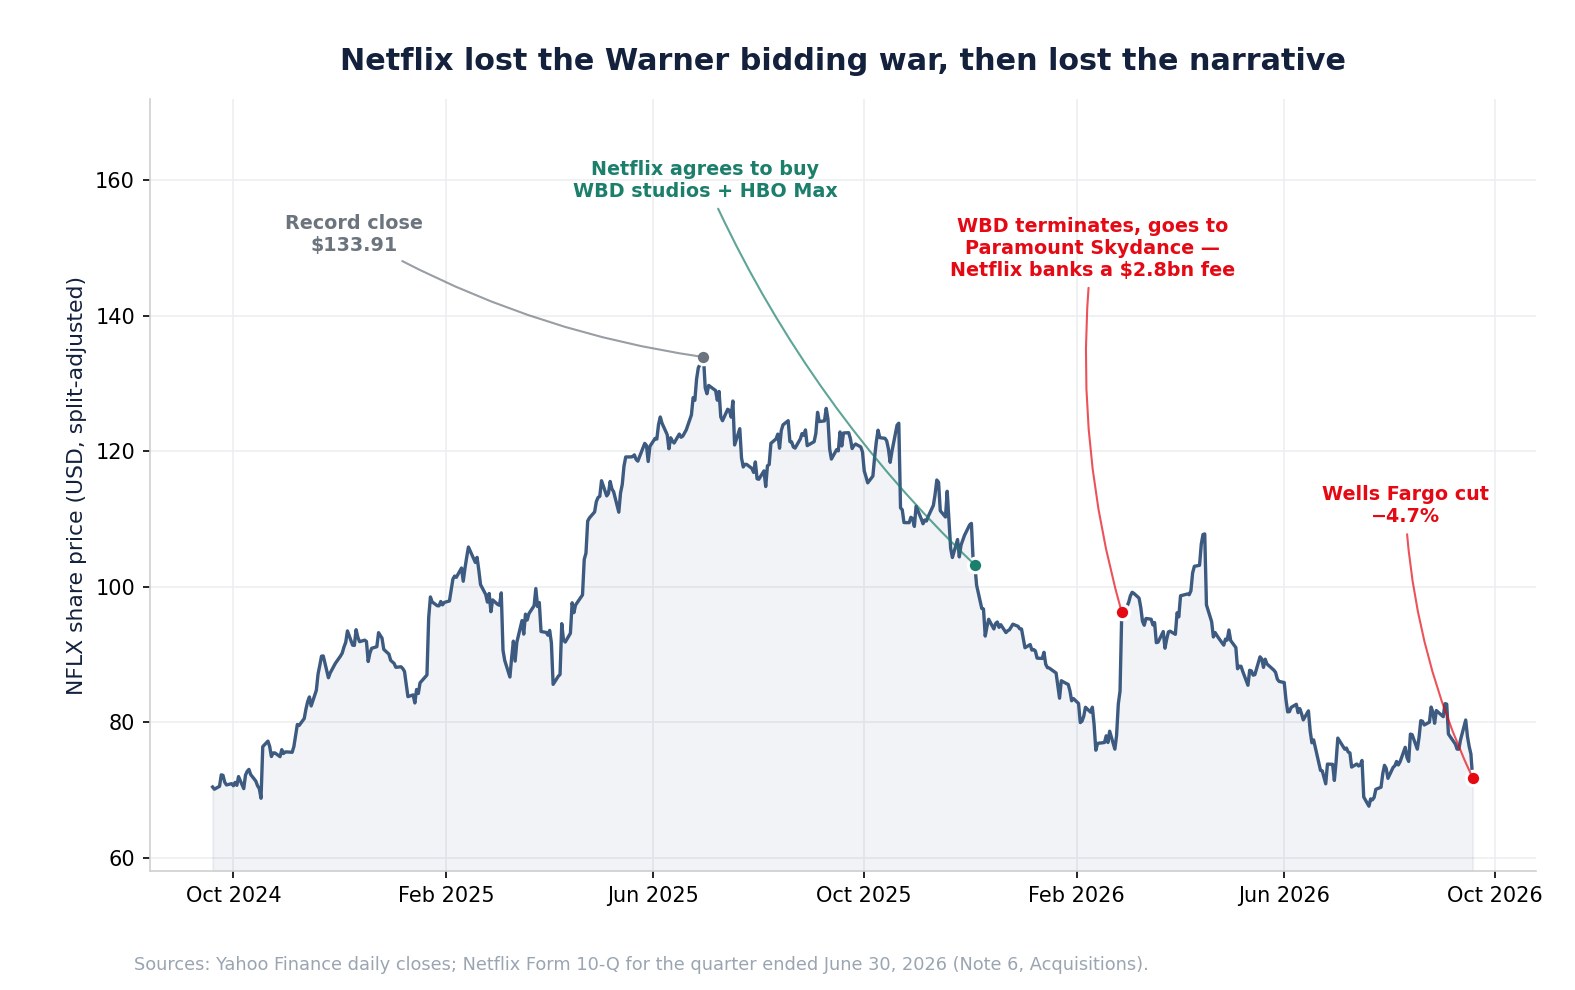
On September 18, 2026, Netflix (NASDAQ: NFLX) fell 4.67% to $71.79 on 114.3 million shares — three times its sixty-day average volume — after Wells Fargo downgraded the stock to Underweight and cut its price target to $57. The coverage framed it as a verdict on engagement: too few watercooler hits, too much competition from YouTube for the same hours.
That framing is incomplete, and the missing piece is not an opinion. It is in the filings.
Seven months earlier, Netflix lost a bidding war for the biggest content library on the market. On December 4, 2025, Netflix signed a definitive merger agreement to acquire Warner Bros. Discovery's studios and streaming businesses, including HBO and HBO Max. On February 27, 2026, WBD terminated that agreement in order to merge with Paramount Skydance instead. Paramount Skydance, on WBD's behalf, paid Netflix a $2.8 billion termination fee.
That single fact does three things at once. It explains why a company supposedly losing its crown has a competitor that just got dramatically larger. It explains why Netflix's trailing earnings look cheaper than its business actually is — the $2.8 billion sits in "interest and other income," not operating income, and it is 100% non-recurring. And it reframes the engagement debate: Netflix's inorganic route to more must-watch content was closed off in February, which makes the organic question urgent rather than academic.
This analysis works through what the September drop actually was, what the Warner outcome means, and what Netflix's own financial statements say once the one-off is removed. Investors can track NFLX filings, estimate revisions and price behavior with SimianX AI.
All figures are drawn from SEC filings and market data through September 18, 2026.
What actually happened on September 18
The move was real but should be sized correctly.
| Measure | Value |
|---|---|
| Sept 17, 2026 close | $75.31 |
| Sept 18 open / high / low | $71.27 / $72.38 / $70.11 |
| Sept 18 close | $71.79 |
| One-day change | −4.67% |
| Volume | 114.3M (3.0x 60-day average) |
| Reported price target change | $80 → $57 |
| Implied downside from prior close | ~24% |
A 4.67% decline is a notable day but not an extraordinary one for this stock. Over the past two years Netflix has had four worse sessions: −10.07% (October 22, 2025), −9.72% (April 17, 2026), −8.53% (March 6, 2025) and −7.26% (July 17, 2026). Only about 3% of Netflix sessions move 5% or more, so this was in the tail — but the tail is populated.
The volume is the more informative number. Three times normal turnover on a sell-side rating change means positioning moved, not just sentiment.
One correction to much of the commentary: Netflix did not issue a viewership warning on September 18. There was no 8-K, no company statement, no guidance revision. The catalyst was an analyst's interpretation of third-party engagement data. Netflix's own most recent disclosure said first-half global viewing exceeded 97 billion hours, up about 2% year over year.
The context the headline number hides
A single-day percentage tells you nothing about where the stock already was.
| Reference point | Level | NFLX at $71.79 |
|---|---|---|
| Record close (June 30, 2025) | $133.91 | −46.4% |
| 52-week high | $124.86 | −42.5% |
| 52-week low | $65.08 | +10.3% |
| 2026 year to date | — | −21.1% |
| Maximum drawdown, past year | — | −45.5% |
| Annualized volatility | — | ~36% |
Netflix is not a stock that just started falling. It has been falling for fifteen months, is down 46.4% from its record close, and sits just 10.3% above its 52-week low. The downgrade did not begin the decline; it extended one.
That distinction matters for the investment question. If you believe the engagement thesis is wrong, you are buying something already marked down by nearly half. If you believe it is right, you are catching a stock that has spent more than a year proving the market agrees with you.
The deal that changed the competitive map
Netflix's merger agreement with Warner Bros. Discovery is disclosed in Note 6 of the Form 10-Q for the quarter ended June 30, 2026. The sequence:
| Date | Event |
|---|---|
| December 4, 2025 | Netflix signs definitive agreement to acquire WBD's studios and streaming businesses, including HBO and HBO Max |
| January 19, 2026 | Agreement amended and restated |
| February 27, 2026 | WBD terminates in order to merge with Paramount Skydance Corporation |
| Same date | Paramount Skydance, on WBD's behalf, pays Netflix a $2.8 billion termination fee |
| Q1 2026 | Fee recorded in "interest and other income (expense)" |
| March 2026 | Netflix completes a separate, unrelated acquisition for approximately $587 million in cash |
Consider what this means for the "has Netflix lost its crown" question. The most valuable independent content library in Hollywood — HBO, HBO Max, the Warner film and television studios — went to a competitor. Netflix bid for it, was outbid or outmaneuvered, and walked away with cash.
The strategic implication is not that Netflix is doomed. It is that Netflix's path to more prestige content is now entirely organic. It cannot buy its way to another Succession or The Sopranos library; it has to commission them. And that is precisely the capability the September downgrade questioned.
Meanwhile a combined Paramount Skydance and WBD creates a competitor with enormous library depth. The streaming market's structure changed in February, and the September conversation about engagement was in part a delayed reaction to it.
Why the $2.8 billion matters to your valuation model
This is where the missing fact becomes a number.
Netflix's "interest and other income (expense)" line for the first half of 2026 was $2,903.8 million, against $90.5 million a year earlier — an increase of 3,108%. Management attributes it directly to the WBD termination fee. Quarterly detail confirms the timing: Q2 2026 contributed only $51.7 million, so essentially all of it landed in Q1.
The effect on trailing earnings is substantial.
| Trailing twelve months to June 30, 2026 | Reported | Adjusted |
|---|---|---|
| Net income | $13,650M | $11,354M |
| Diluted EPS (approx.) | $3.20 | $2.66 |
| P/E at $71.79 | 22.4x | 27.0x |
The adjustment removes the $2.8 billion fee taxed at Netflix's 18% first-half effective rate, worth roughly $0.54 of trailing EPS. On reported numbers Netflix looks like a 22x stock. On the earnings its operations actually generate it is closer to 27x.
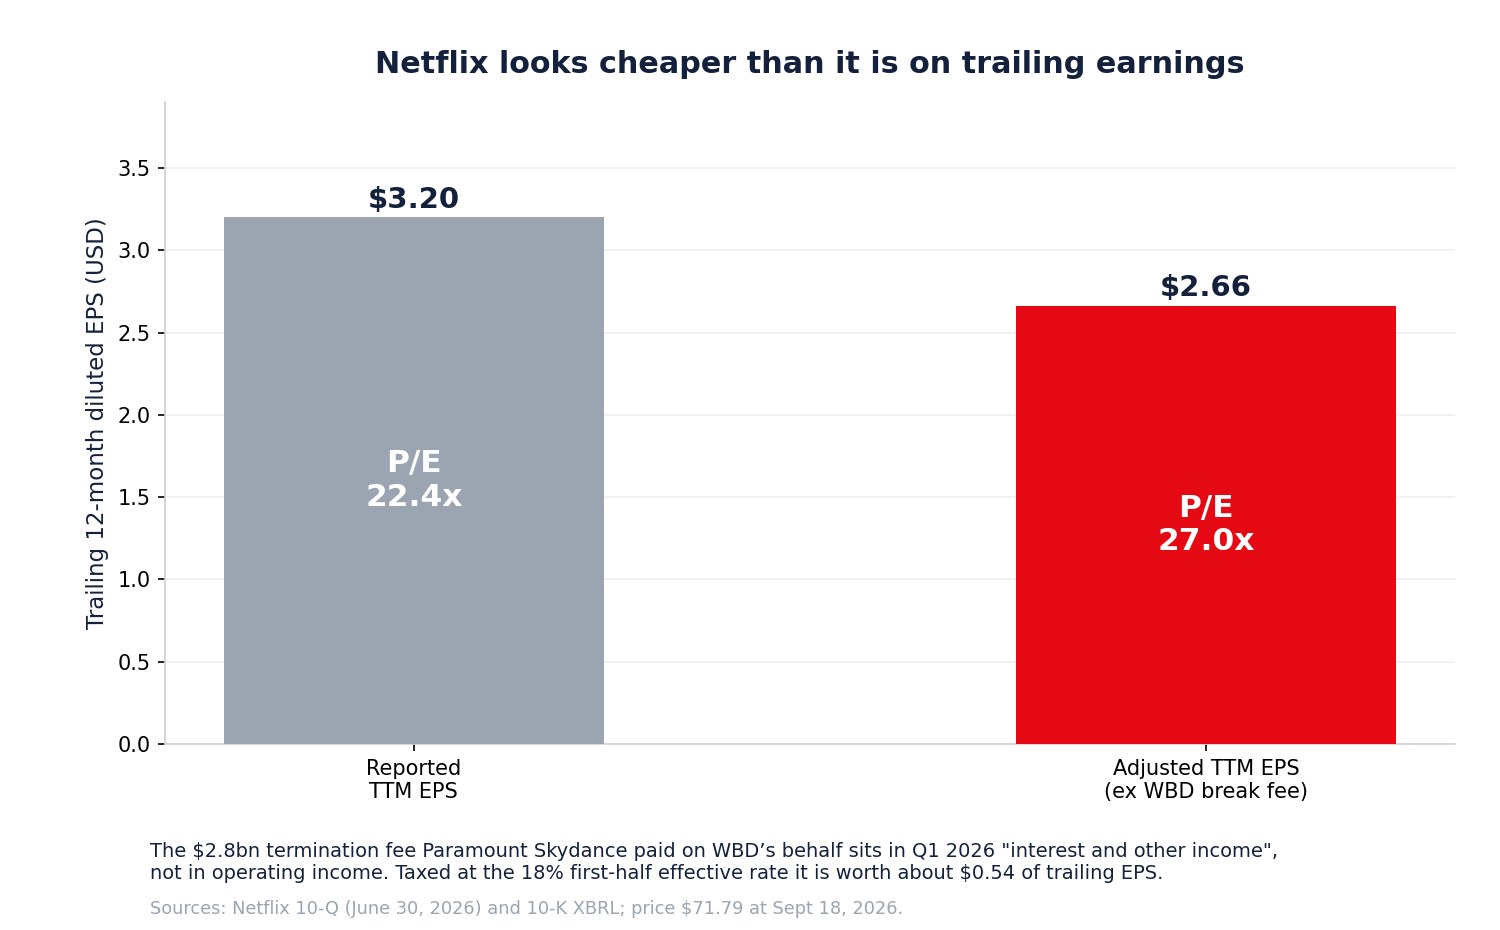
That is a 20% difference in the multiple, and it points the opposite way from the bullish "it's cheap now" reflex. It does not make Netflix expensive — 27x for a business compounding revenue in the low teens with 33% operating margins is defensible. It does mean the stock is not as cheap as a screen suggests, and screens are exactly what a 46% decline attracts.
The single most quoted bull argument after a drawdown is the trailing multiple. Netflix's is flattered by a break fee from a deal it lost.
The operating business is genuinely strong
None of the above says Netflix is deteriorating. The June quarter was good.
| Q2 2026 | Value | Year over year |
|---|---|---|
| Revenue | $12,559.9M | +13.4% |
| Operating income | $4,192.6M | +11.1% |
| Operating margin | 33.4% | from 34.1% |
| Net income | $3,401.4M | +8.8% |
| Diluted EPS | $0.80 | +11.1% |
| Free cash flow | $1,525M | from $2,267M |
First-half revenue reached $24,809.7 million, up 14.7%, with operating income of $8,149.6 million. Netflix guided the full year to revenue of $51.0-51.4 billion and an operating margin around 31.5%, up from 29.5% in 2025. For the September quarter it guided to roughly $12.86 billion of revenue, $4.27 billion of operating income and $0.82 of diluted EPS.
A business with 33% operating margins growing revenue in the low teens is not in crisis. The question is direction of travel.
Revenue growth is decelerating, and that part is not disputed
| Quarter | Revenue growth |
|---|---|
| Q2 2025 | +15.9% |
| Q3 2025 | +17.2% |
| Q1 2026 | +16.2% |
| Q2 2026 | +13.4% |
| Q3 2026 (guidance) | +11.7% |
From a 17.2% peak to guided 11.7% in four quarters. Some of that is arithmetic — the base is larger — and some is the pricing and paid-sharing benefits of 2023-24 annualizing away. It is the same maturation pattern that reframed PDD's growth-versus-profit trade-off.
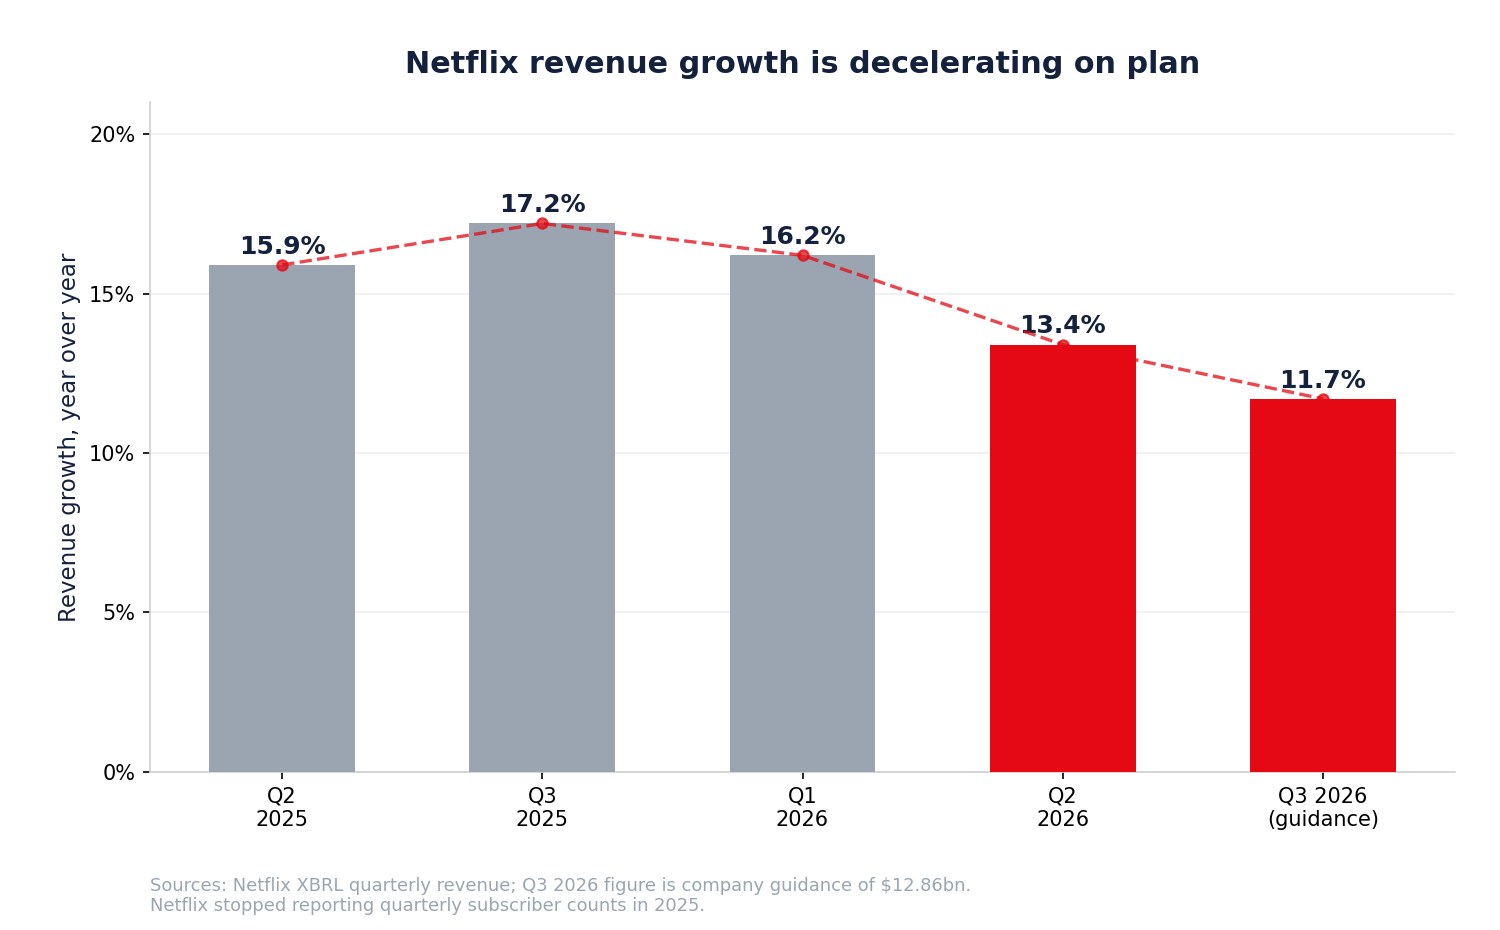
The reason this feeds the engagement debate is that Netflix has removed the metric that would settle it. The company no longer reports quarterly subscriber totals, so an outsider cannot divide viewing hours by members to compute engagement per subscriber. When Netflix says total viewing rose 2% and an analyst says viewing per member is falling, both can be true simultaneously if the member base grew faster than 2% — and the public data does not adjudicate between them.
That is a disclosure choice with a cost. Reduced disclosure transfers the narrative to third-party measurement firms and sell-side models, which is exactly what happened on September 18. Reduced visibility magnifies single-analyst moves, a dynamic also visible when consumer bellwethers trimmed disclosure and guidance.
Content spending is growing twice as fast as revenue
Here is the second finding the coverage missed, and it sits in the cash flow statement.
| First half | 2026 | 2025 | Change |
|---|---|---|---|
| Revenue | $24,809.7M | $21,622.0M | +14.7% |
| Additions to content assets | $9,774.4M | $7,385.5M | +32.3% |
| Operating cash flow | $7,034.0M | $5,212.5M | +34.9% |
| Operating cash flow excluding the $2.8bn fee | ~$4,234M | $5,212.5M | −18.8% |
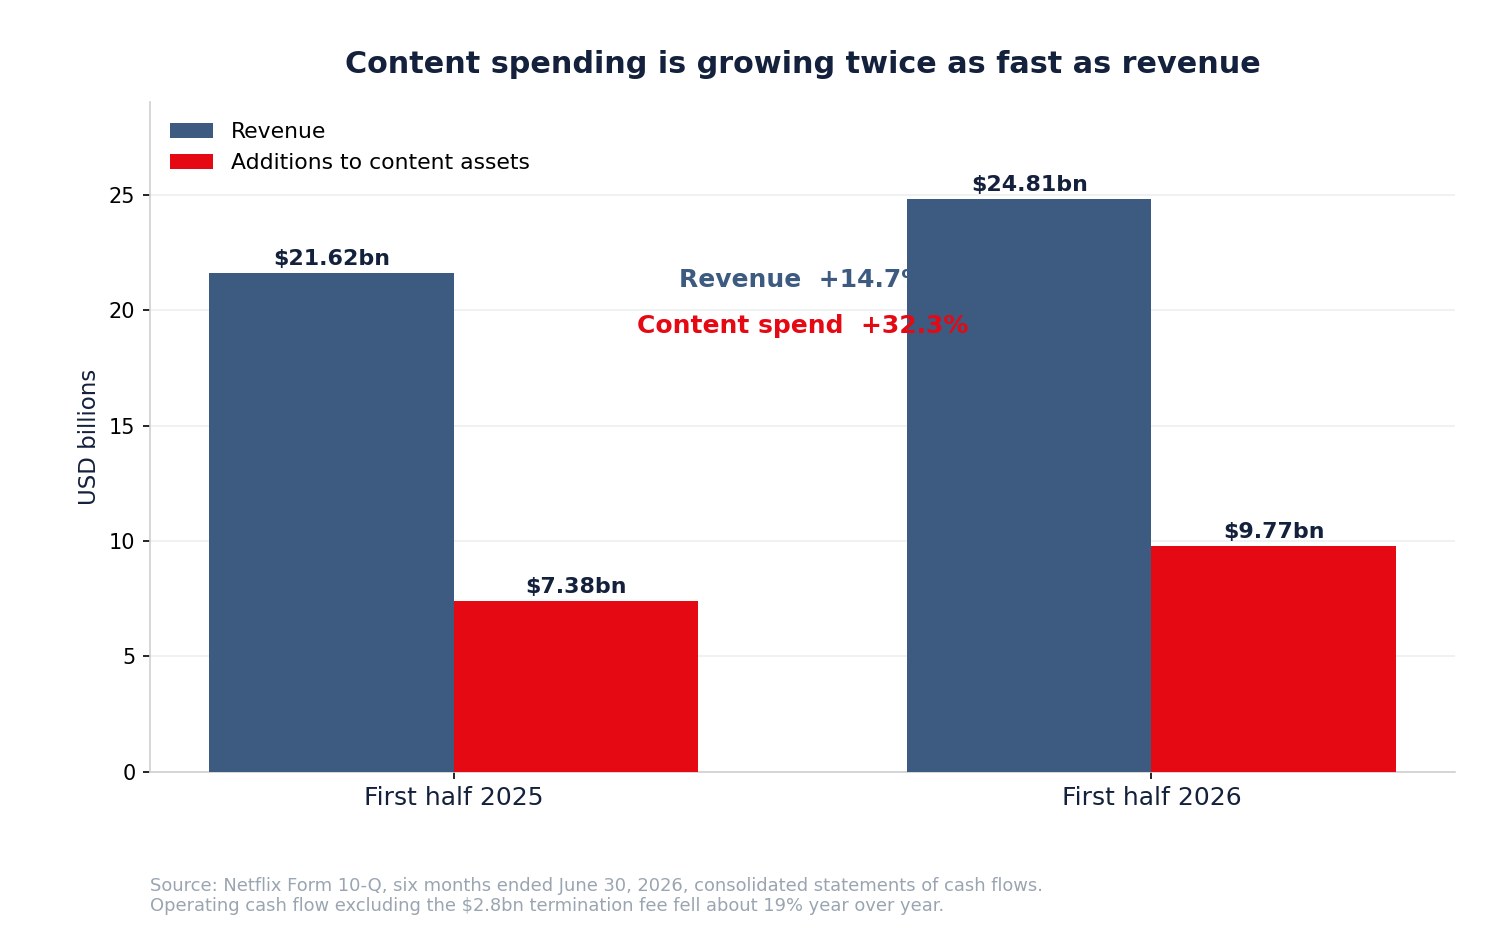
Content spending rose 32.3% while revenue rose 14.7% — more than double the rate. And once the termination fee is stripped out, first-half operating cash flow fell about 19% year over year. In the June quarter alone, operating cash flow was $1,743.8 million against $2,423.3 million, down 28.0%.
There are benign readings. Content spend is lumpy and front-loads ahead of a release slate; a heavier second half of deliveries would be consistent with this. Netflix still guides to roughly $12.5 billion of free cash flow for 2026.
There is also a less benign reading, and it connects to the Warner outcome: if you cannot buy a library, you have to spend your way to one. A 32% increase in content investment against 14.7% revenue growth is what an organic-only strategy looks like in the cash flow statement. Whether it produces hits is the whole question. Spending more to defend a franchise is a familiar late-cycle pattern, and drawdowns in high-multiple growth names rarely resolve quickly.
The buyback is underwater
Netflix repurchased 52,934,688 shares for $4.7 billion in the June quarter — an average of about $88.79 per share. Across the first half it bought 66,431,786 shares for $5.9 billion, an average near $88.81. As of June 30, $27.1 billion remained authorized.
At $71.79, the second-quarter repurchase is roughly 19% underwater.
This is not a scandal; buybacks are not market-timing exercises and Netflix has repurchased stock for years. But it is a fact worth holding alongside the "the stock is cheap here" argument: management was a large and confident buyer 19% higher, which tells you something about how the drawdown has surprised the people with the best information.
It also frames the capital-allocation choice. Netflix has $9.1 billion of cash against roughly $14.3 billion of debt, is spending 32% more on content, and returned $5.9 billion to shareholders in six months. Those three claims on cash compete.
Has YouTube actually taken the crown?
The competitive argument deserves engagement rather than dismissal.
By Nielsen's measurement of US television viewing, YouTube reached a record 14.2% share in July 2026, with total streaming at about 49% of television use, while Netflix's share sat near 8%. On that metric YouTube commands substantially more American television attention than Netflix. Alphabet has disclosed that YouTube generated more than $60 billion of combined advertising and subscription revenue in 2025 — more than Netflix's $45.2 billion of total 2025 revenue.
Those numbers are real, and they are the strongest version of the bear case. But they measure different businesses:
- YouTube is a distribution platform with near-zero marginal content cost, monetizing creator supply it does not fund.
- Netflix is a studio and a subscription service, funding content directly and monetizing through paid membership and, increasingly, advertising.
- Nielsen's Gauge measures television screens in the United States, which understates Netflix's international base and mobile viewing.
Share of US TV time is a legitimate competitive indicator, not a profit-and-loss statement. Netflix's 33% operating margin is not obviously the margin of a company being beaten. Comparable dynamics show up wherever attention platforms meet content spenders, as in Alphabet's own capex and monetization debate and Meta's pivot toward AI-driven engagement.
The fair conclusion: YouTube has won share of casual viewing time. Netflix retains the premium subscription relationship. Both can be true, and the second is worth more per hour.
Advertising is the swing factor
If viewing hours per member are flat or declining, advertising becomes the way to grow revenue per member anyway.
Netflix's ad tier has been scaling, and the economics differ fundamentally from subscription: revenue depends on impressions delivered and price per thousand, which means it is directly sensitive to engagement. Fewer hours per member is a subscription-neutral, advertising-negative outcome. That is the mechanism by which the engagement debate reaches the income statement, and it is why an analyst focused on hours per member is not making a category error.
The broader advertising market backdrop matters too — the same demand pool that drives AI-assisted ad platforms and the performance budgets of every large platform.
Live programming: small hours, large purpose
Netflix has disclosed that live programming will represent slightly more than 5% of 2026 content spending but only about 1% of viewing hours.
Read as an efficiency ratio that looks poor. Read as an acquisition and retention instrument it looks different: live events concentrate attention, generate cultural moments, create advertising inventory with premium pricing, and give subscribers a reason not to cancel in a given month. Netflix has said live programming generated a disproportionate share of its most-watched titles.
Evaluating live content purely by hours understates it. Evaluating it purely by cultural noise overstates it. The honest test is whether it reduces churn and raises advertising yield — neither of which Netflix discloses directly, which returns us to the disclosure problem.
What the balance sheet supports
| As of June 30, 2026 | Amount |
|---|---|
| Cash and cash equivalents | $9,099M |
| Total notes outstanding | $14,309M |
| Of which short-term | $2,484M |
| Content assets, net | $33,838M |
| Total assets | $58,450M |
| Remaining buyback authorization | $27,100M |
| Shares outstanding | 4,163,939,676 |
| Market capitalization at $71.79 | ~$299bn |
This is a comfortable balance sheet. Net debt of roughly $5.2 billion against $13.3 billion of 2025 operating income is not a constraint. Netflix's problem, if it has one, is not solvency — it is the rate at which content investment converts into engagement and pricing power.
The bull case
- The operating business compounds. Revenue up 13.4% in the June quarter with a 33.4% operating margin and guidance for 31.5% full-year margin, up from 29.5%.
- The stock has already de-rated 46.4% from its record close and sits 10.3% above its 52-week low.
- The engagement warning is an analyst estimate, not a company disclosure; Netflix reported first-half viewing above 97 billion hours, up 2%.
- Advertising is early. A scaling ad tier grows revenue per member even if hours per member stagnate.
- $27.1 billion of buyback authorization remains against a $299 billion market capitalization.
- Losing WBD preserved $30bn-plus of balance-sheet capacity and avoided years of integration and antitrust risk — and paid Netflix $2.8 billion for the inconvenience.
- Pricing power has not been disproven, with revenue growth still low-teens after years of increases.
The bear case
- Revenue growth is decelerating from 17.2% to a guided 11.7% in four quarters.
- Trailing earnings are inflated by a non-recurring $2.8 billion fee; the operating multiple is nearer 27x than 22x.
- Content spending rose 32.3% against 14.7% revenue growth, and operating cash flow excluding the fee fell about 19%.
- Netflix lost the Warner library to a competitor, so incremental prestige content must now be built, not bought.
- YouTube leads US television share at 14.2% versus roughly 8% for Netflix.
- Disclosure has been reduced. Without quarterly subscriber counts, engagement per member is unverifiable from public data.
- The June-quarter buyback is about 19% underwater at $88.79 average cost.
- The stock is down 21.1% in 2026 and has spent fifteen months making lower highs.
The bear case is not that Netflix is a bad business. It is that a very good business is being asked to grow organically, at greater cost, against a competitor that just absorbed the asset Netflix wanted.
What to watch before the next earnings report
Engagement and disclosure: whether Netflix restores any per-member engagement metric; the next semiannual viewing report; Nielsen monthly share trends for Netflix and YouTube.
Financial: revenue growth against the guided 11.7%; operating cash flow excluding one-offs; additions to content assets versus revenue growth; operating margin against the 31.5% full-year target; free cash flow against the roughly $12.5 billion guide.
Strategic: advertising revenue disclosure and ad-tier scale; live-event slate and any churn commentary; whether the Paramount Skydance-WBD combination changes content licensing terms; further acquisitions now that the Warner route is closed.
Capital: buyback pace and average price; whether management keeps buying near these levels.
A five-step routine:
- Separate operating income from other income — the last twelve months contain a large one-off.
- Compare content spend growth with revenue growth, which is where an organic strategy shows up first.
- Track cash conversion, not just reported EPS.
- Watch share of viewing as a competitive indicator, not a profit measure.
- Confirm valuation support — estimate revisions rising faster than the price.
SimianX AI can combine SEC filings, earnings revisions, price behavior and news tone into a repeatable process for exactly this kind of mixed signal.
Is Netflix stock a buy after the drop?
The honest answer separates three questions that the September headlines merged into one.
Is the business deteriorating? No. Revenue grew 13.4% last quarter at a 33.4% operating margin, and full-year margin guidance is higher than last year's. A company losing its crown does not expand margins.
Is growth slowing? Yes, and Netflix says so. From 17.2% to a guided 11.7% is a real deceleration, and the pricing and paid-sharing tailwinds that drove 2023-25 have largely annualized.
Is the stock cheap? Less than it looks. Strip the $2.8 billion Warner break fee out of trailing earnings and the multiple moves from about 22x to about 27x. That is a reasonable price for this business — it is not a bargain, and the 46.4% decline from the record close has not made it one on operating earnings.
Investors who believe the ad tier scales, content spending produces hits, and cash conversion normalizes in the second half have a coherent thesis. The next two quarters of cash flow will test it directly.
Investors who want to see engagement disclosure restored, content spending growth converge toward revenue growth, and evidence that the organic content strategy can replace what the Warner library would have provided also have a coherent thesis.
What September 18 settled is nothing. It was an analyst's opinion, delivered at three times normal volume, about a stock already down 46% — and it did not mention the deal that actually changed the industry's structure seven months earlier.
FAQ about Netflix stock and the September decline
Did Netflix issue a viewership warning?
No. There was no company statement, 8-K or guidance change on September 18, 2026. Wells Fargo downgraded the stock and cut its price target, citing engagement trends drawn from third-party data. Netflix's most recent disclosure reported first-half global viewing above 97 billion hours, up roughly 2% year over year.
What was the $2.8 billion termination fee?
Netflix agreed on December 4, 2025 to acquire Warner Bros. Discovery's studios and streaming businesses, including HBO and HBO Max. On February 27, 2026, WBD terminated the agreement to merge with Paramount Skydance, which paid Netflix a $2.8 billion termination fee on WBD's behalf. Netflix recorded it in "interest and other income (expense)" in the first quarter of 2026, as disclosed in Note 6 of its June 2026 Form 10-Q.
Does that fee change Netflix's valuation?
Yes, meaningfully. It inflates trailing twelve-month earnings by roughly $0.54 per share after tax at the 18% first-half effective rate. Reported trailing EPS of about $3.20 becomes roughly $2.66 adjusted, moving the P/E at $71.79 from about 22.4x to about 27.0x.
Has YouTube overtaken Netflix?
In share of US television viewing, yes — Nielsen measured YouTube at a record 14.2% in July 2026 against roughly 8% for Netflix, and Alphabet reported more than $60 billion of YouTube advertising and subscription revenue in 2025. But the two monetize differently: YouTube distributes creator content it does not fund, while Netflix funds and owns programming and earns a 33% operating margin doing it.
Why can't investors verify the engagement claim?
Because Netflix stopped reporting quarterly subscriber counts. Without a member denominator, viewing hours per member cannot be calculated from public data. Netflix's "total viewing up 2%" and an analyst's "viewing per member down" can both be true if membership grew faster than 2%.
Is Netflix's cash flow deteriorating?
On an underlying basis, first-half operating cash flow fell about 19% once the $2.8 billion fee is excluded, and June-quarter operating cash flow was down 28.0% year over year. Content asset additions rose 32.3% in the first half. Netflix still guides to roughly $12.5 billion of free cash flow for 2026, so the second half carries the burden of proof.
What is the biggest risk?
That organic content investment does not produce enough must-watch programming to hold engagement, while the cost of trying keeps rising faster than revenue. The Warner outcome makes this risk sharper because the acquisition route to a premium library is closed.
Conclusion
Netflix fell 4.67% because an analyst said its viewers are drifting. The more consequential event happened on February 27, 2026, when Warner Bros. Discovery walked away from Netflix and into a merger with Paramount Skydance, handing Netflix a $2.8 billion consolation payment on the way out.
The verifiable picture is this. Operationally Netflix is strong: $12.56 billion of June-quarter revenue, up 13.4%, at a 33.4% operating margin, with full-year margin guided to 31.5%. Directionally it is slowing: growth from 17.2% to a guided 11.7% in four quarters. Financially it is less cheap than it appears: trailing EPS of about $3.20 falls to roughly $2.66 without the break fee, moving the multiple from 22.4x to 27.0x. And underneath, content spending grew 32.3% against 14.7% revenue growth while operating cash flow excluding the fee fell about 19%.
The stock is 46.4% below its record close and 10.3% above its 52-week low. Management bought $4.7 billion of it in the June quarter at an average near $88.79, about 19% above today's price.
Four things will decide this, in order: whether second-half cash conversion normalizes; whether content spending growth converges toward revenue growth; whether advertising scales fast enough to offset flat engagement per member; and whether Netflix can commission organically what it tried and failed to buy. The last one is the real question behind the crown — and it was settled in February, not September.
Related Reading
- Alphabet Q2 Earnings 2026: Can Gemini, Cloud Justify Capex?
- META Stock After Muse: Can an AI Agent Justify $145B Capex?
- Amazon Q2 Earnings 2026: Can AWS Justify $200B AI Capex?
- AppLovin Stock 2026: Can AI Advertising Keep APP Growing?
- Lululemon Stock Below $100: Broken Brand or Rare Buy?
- PDD Stock 2026: Temu Slows, Revenue Up, Profit Down 15%
- Walmart & Target 2026: Decoding US Consumer Stress Signals
- Every Tech Bubble Since 1929: How AI in 2026 Compares
- AI CEOs Hit the Brakes: Chip Stocks Fell, Big Tech Rose
References
- Netflix — Form 10-Q for the quarter ended June 30, 2026
- Netflix — Investor Relations
- Netflix — quarterly earnings materials
- Nielsen — The Gauge, monthly US television viewing shares
- SEC EDGAR full-text search
- Warner Bros. Discovery — corporate site
- Paramount — corporate site
- Alphabet — investor relations
- Netflix — consumer site
- Nasdaq — NFLX quote and trading history
- SimianX — NFLX stock fundamentals