
AI Stock Analysis, Rebuilt Around an 8-Agent Committee
Most AI stock analysis ends the same way: one model, one long answer, and no way to tell which sentence deserves your trust. The rebuilt SimianX Deep Analysis works differently. Eight AI agents research one US stock, argue about the points where they disagree, vote again after the argument, and hand you a decision with an entry, a stop and a target. Then the committee stays in the room, and you can question any member with live data behind every answer.
This article walks through the new flow screen by screen, using a real run on NVDA from October 4, 2026. That run took 3 minutes 32 seconds from the first click to the finished PDF report. Every number quoted below comes from that session. It shows what the product does; it is not a recommendation to trade Nvidia.
What Changed: Old Deep Analysis vs the Rebuild
The first version, described in our original four-stage launch post, produced eight reports in one long stream. It worked, but it had real weaknesses, and we rebuilt both the engine and the interface to remove them.
| Area | Before | Now |
|---|---|---|
| Holding period | One fixed outlook for everyone | You choose short-term, swing or long-term; charts, news weight and the plan follow that choice |
| Debate | Two rounds with random speakers and no conclusion | A chair picks the 1–3 biggest disagreements, questions each side, and settles or leaves open every one |
| What members know | Later agents missed parts of earlier work | Every member reads every report; the risk manager decides after the debate, not before |
| After the debate | Opinions never moved | A closing vote: each member restates stance and conviction, and you see who moved |
| Decision | A rating and a 0–100 confidence score | Conclusion first, the committee split, reward/risk, "what would prove this wrong", and checked price levels |
| Follow-up questions | Short answers from memory, no data access | Routed to the right member, who pulls fresh financials, prices and news, and can compare a peer ticker |
| Running out of points | The run was cut off mid-sentence | The run pauses at a step boundary, saves everything, and resumes later |
| Language | English output only | Reports, debate, PDF and email in 16 languages |
| Models | No choice | One model for all agents or one per agent, saved once |
| Layout | A long scroll | A live stage with one scene at a time, then a result board built for phone and desktop |
Step 1: Choose a Stock and a Holding Period
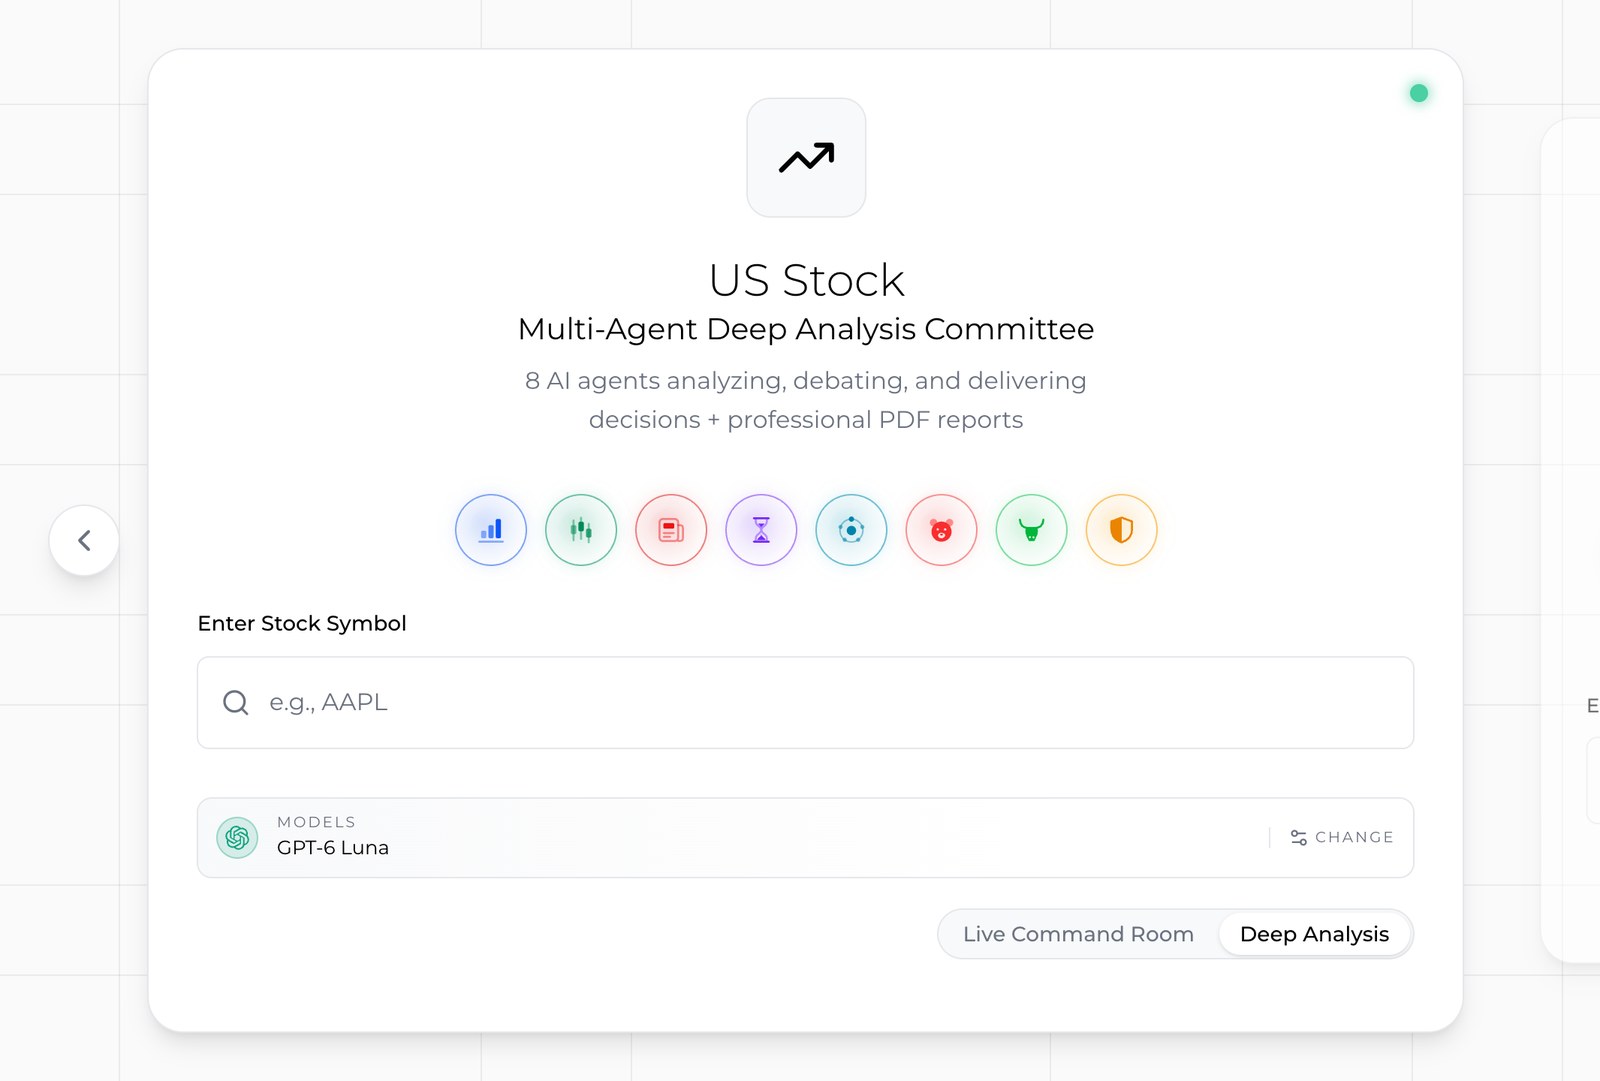
Open Deep Analysis, type a ticker, and pick it from the list. The start card shows the model that will run the committee, and nothing else asks for your attention.
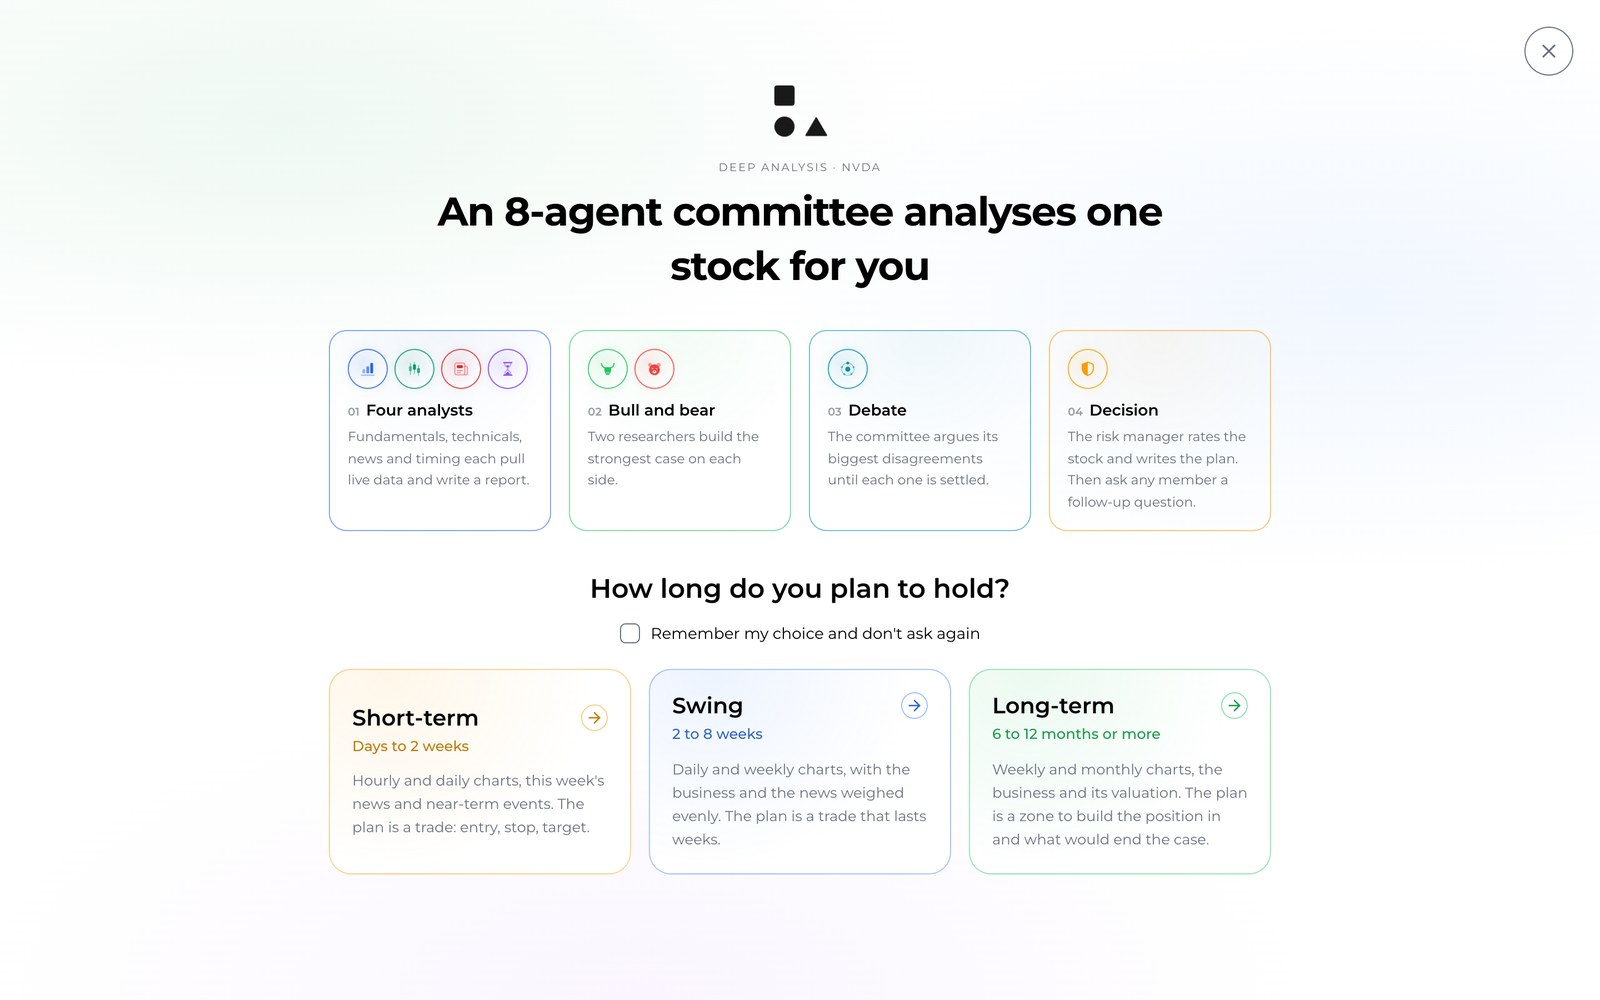
Before the first run, one screen explains the four stages and asks a single question: how long do you plan to hold?
- Short-term (days to 2 weeks): hourly and daily charts, this week's news and near-term events. The plan is a trade.
- Swing (2 to 8 weeks): daily and weekly charts, with the business and the news weighed evenly.
- Long-term (6 to 12 months or more): weekly and monthly charts, the business and its valuation. The plan is a zone to build a position in, plus what would end the case.
This choice matters more than it looks. The old version quietly assumed a few weeks for everyone, so a long-term investor received a trader's stop. Now the stop distance, the entry window and even the weight given to valuation follow the period you chose. Nothing is preselected. You can tick "remember my choice" if you always invest the same way.
Step 2: Four Analysts Research in Parallel
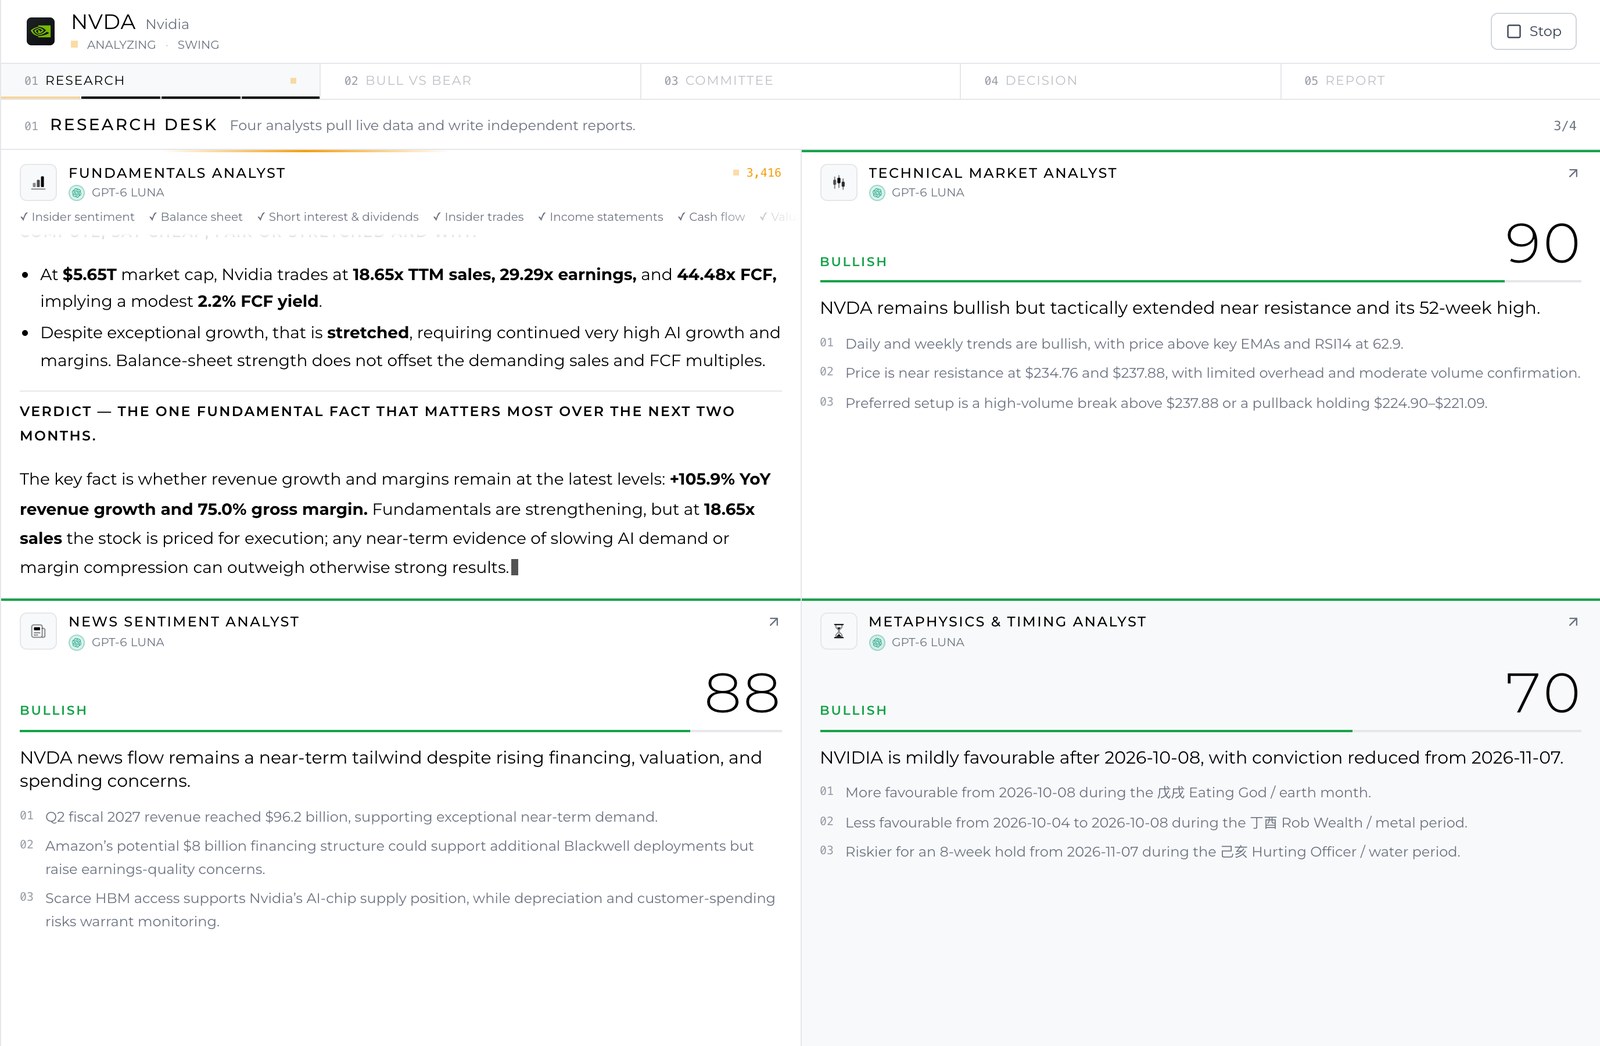
The run opens on the research desk. Four analysts work at the same time, and you can watch each one write:
- The Fundamentals Analyst reads valuation ratios, income statements, cash flow, the balance sheet, short interest and insider trades.
- The Technical Market Analyst reads price, moving averages, RSI, MACD, volume, support and resistance.
- The News Sentiment Analyst reads recent coverage. In the NVDA run it read 40 articles, and the full list stays on the result page.
- The Metaphysics & Timing Analyst gives a calendar-based timing view. Treat it as a different lens, not as evidence.
Each pane lists the data the analyst actually pulled, shown as ticks under its name. When an analyst finishes, the pane folds into a stance (bullish, neutral or bearish), a conviction number, a one-line conclusion and three supporting points. For NVDA the four analysts started at bullish 85, 90, 88 and 70.
What this gives you: four independent reads before anyone has seen another's work. If all four agree, that is information. If the fundamentals and the chart disagree, you know where the debate will go. Splitting one job across agents that work independently is the core idea of multi-agent AI, explained in What Are AI Agents? How Multi-Agent AI Systems Work.
Step 3: A Bull and a Bear Build the Strongest Cases
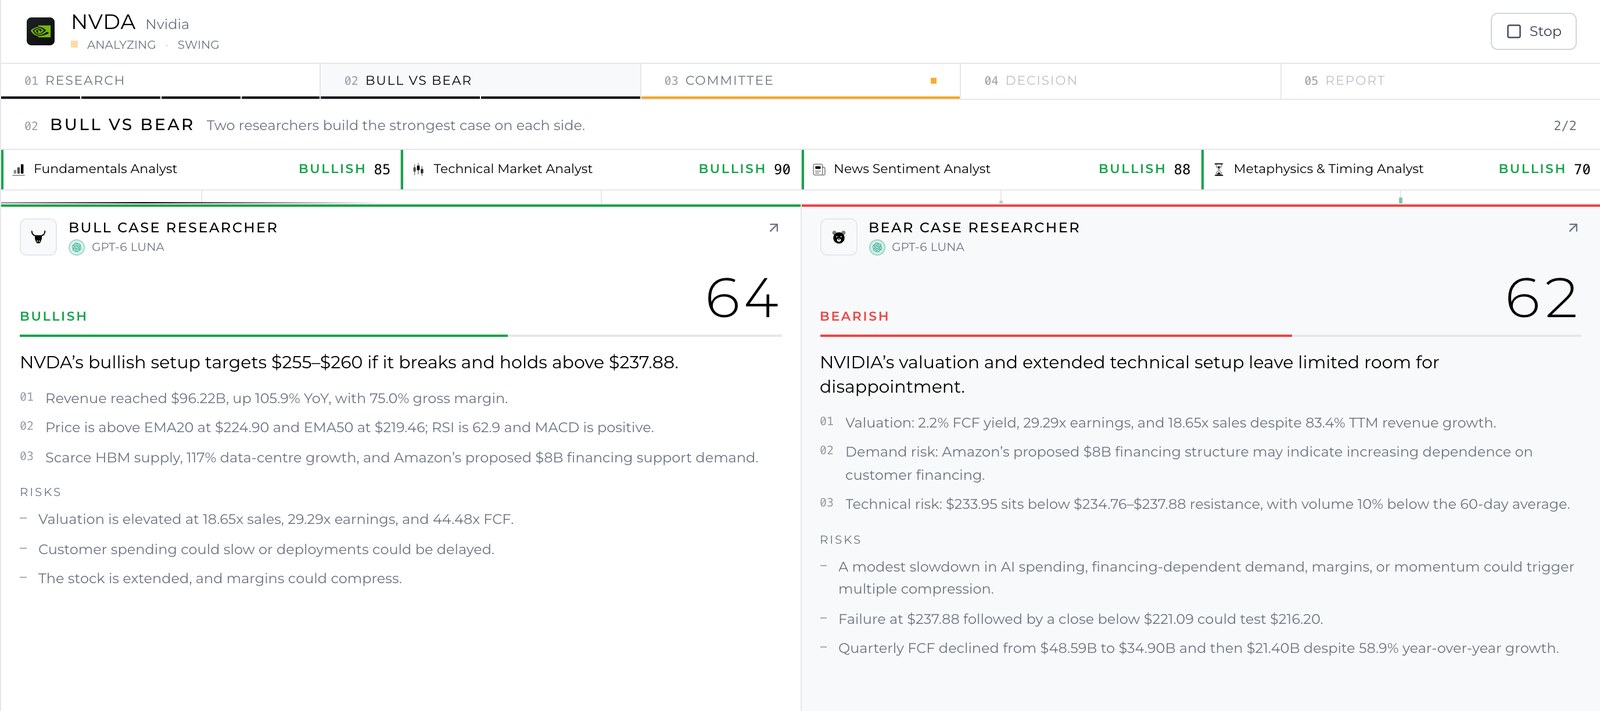
Two researchers then read all four reports. One writes the strongest honest case for buying, the other the strongest case against. This is a deliberate devil's advocate step: the bear must argue against the stock even when every analyst is bullish.
In the NVDA run the bull targeted $255–$260 on a break above $237.88, citing revenue up 105.9% year over year and a 75.0% gross margin. The bear answered with valuation (18.65 times sales, a 2.2% free-cash-flow yield) and one line that became the centre of the debate: quarterly free cash flow fell from $48.59B to $34.90B and then to $21.40B.
Both researchers also list the risks to their own case. Read those first. A bull who can name what would break the thesis is more useful than one who cannot.
Step 4: The Committee Debate Settles the Disagreements
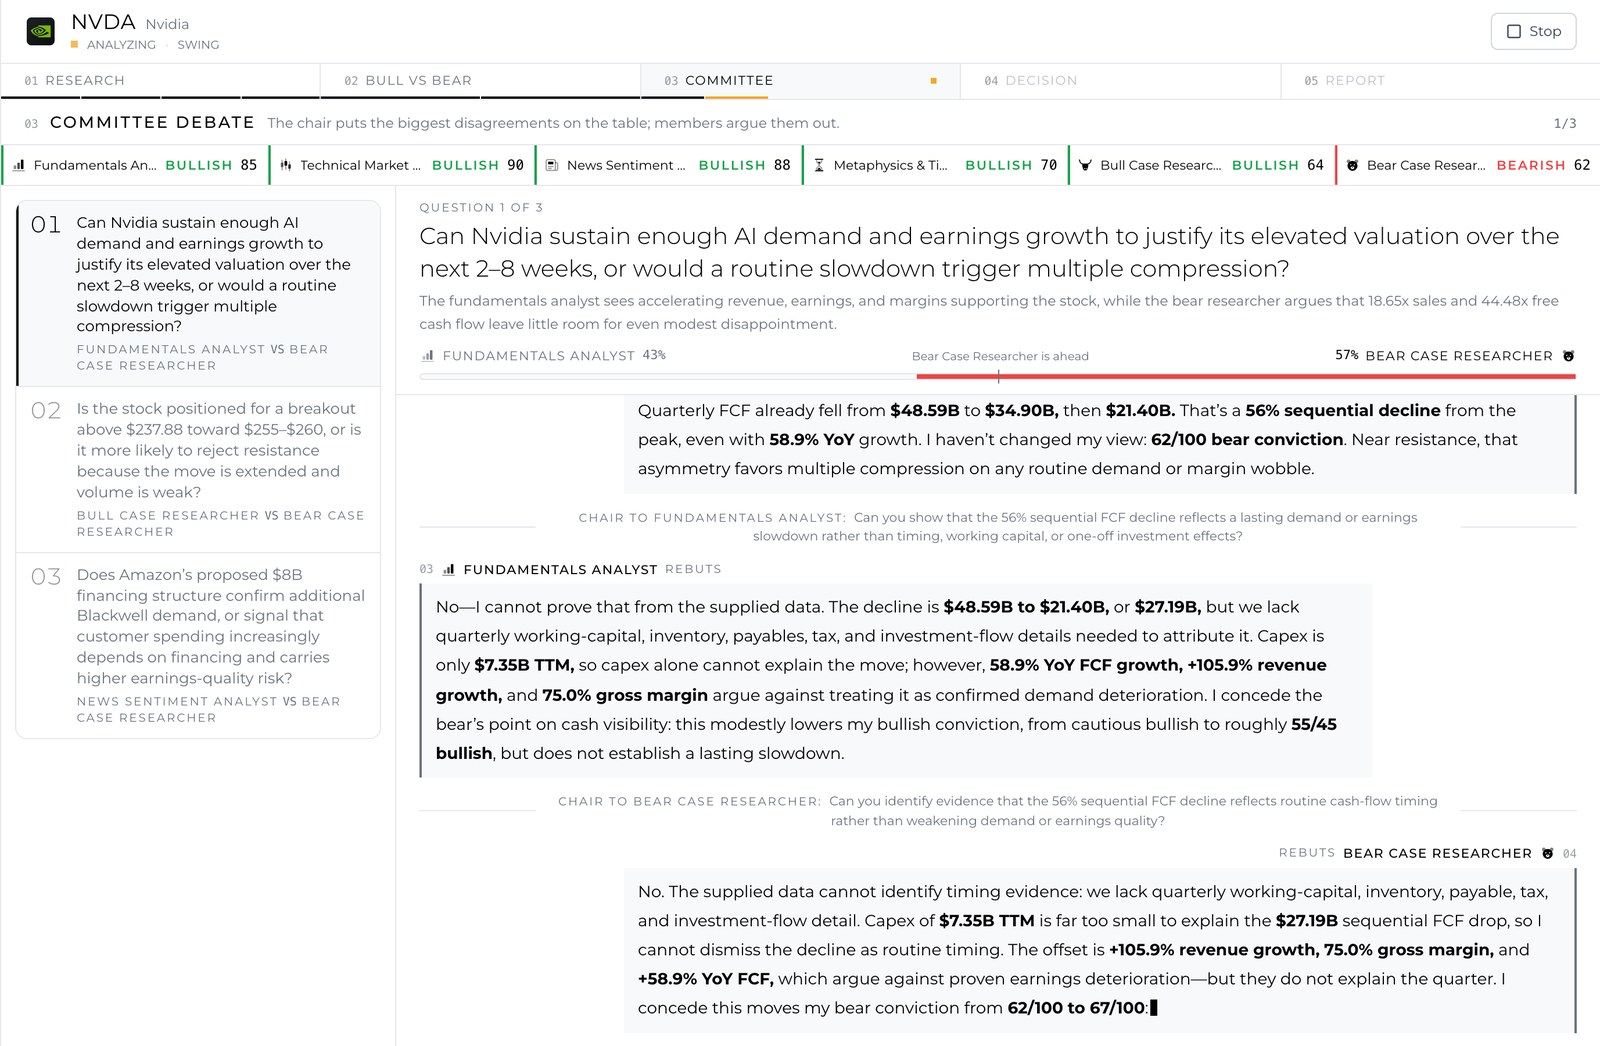
This is the part we rebuilt from nothing. A chair reads every report, finds the largest disagreements, and puts one to three questions on the table. Each question names the two members who disagree most. They open, respond and rebut, and the chair cuts in with pointed questions to each side. A bar above the exchange shows who is ahead as the argument moves.
For NVDA the chair asked three questions:
- Can Nvidia sustain enough AI demand to justify its valuation over the next 2–8 weeks?
- Is the stock set for a breakout above $237.88, or more likely to be rejected there on weak volume?
- Does Amazon's proposed $8B financing structure confirm new demand, or signal that customer spending depends on financing?
The useful moments are the concessions. Asked whether the drop in free cash flow reflected weaker demand, the Fundamentals Analyst replied that the supplied data could not prove it either way and cut its own bullish conviction. The Bear Researcher, asked for evidence that the drop was only timing, also admitted there was none. The chair recorded question one as "left open", with both sides agreeing on exactly what is unknown.
That is the result you want from a debate: not a winner by volume, but a clear list of what was settled, what was not, and which fact would settle it.
Step 5: The Decision Card Puts the Conclusion First
After the debate every member restates stance and conviction in a closing vote. Then the Risk Manager writes the decision. The card reads top to bottom in the order you need it:
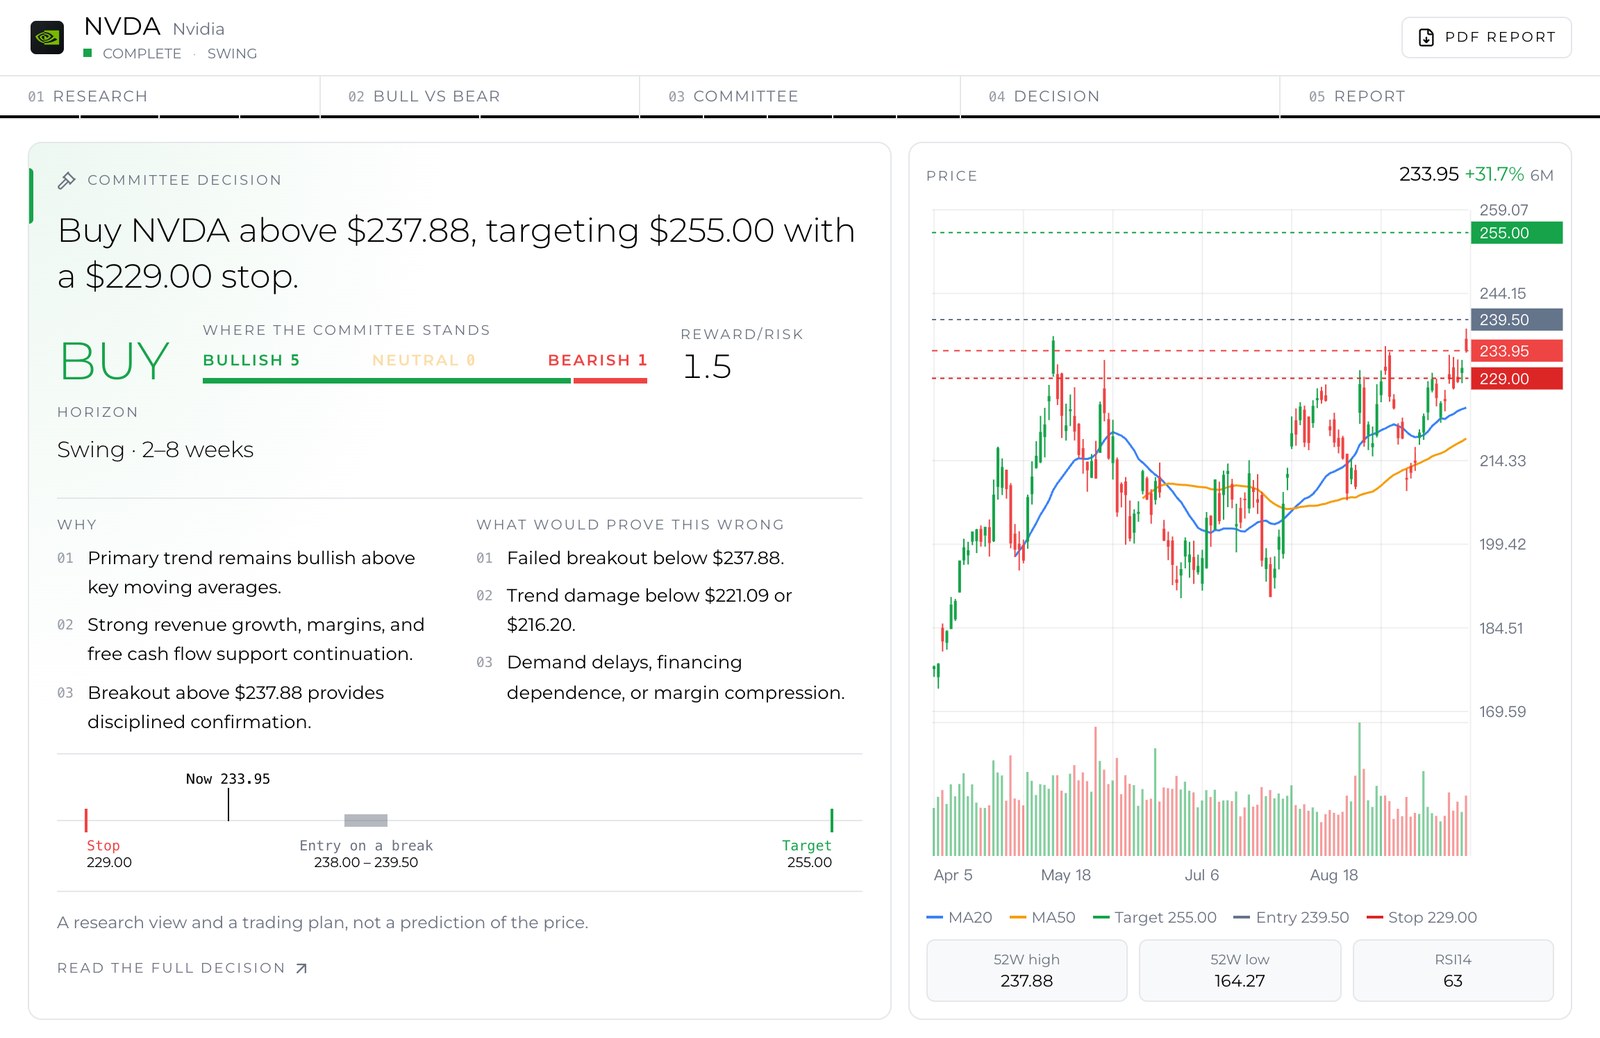
- The conclusion in one sentence. "Buy NVDA above $237.88, targeting $255.00 with a $229.00 stop."
- The rating: Buy, Hold or Sell. Hold means no trade and no levels.
- Where the committee stands: 5 bullish, 0 neutral, 1 bearish. We removed the old 0–100 confidence score because it looked precise and was not. A split tells you more. If the decision goes against the majority, the card says so and explains why.
- Reward/risk: 1.5 here. The software calculates this from the levels using the worst fill inside the entry zone; the model is not allowed to state it. See Investopedia on the risk/reward ratio.
- Why and What would prove this wrong, three lines each.
- The level ladder: stop, current price, entry zone and target on one scale, and the same levels drawn on the price chart beside it.
Notice the kind of entry. With the price at $233.95, the committee did not say "buy now". It asked for a daily close above $237.88 first, because the debate found that volume had not yet confirmed the move. The plan waits for evidence, and it lapses if the entry never triggers.
The levels are also checked by code before you see them: the stop must sit on the correct side of the entry, the target beyond it, and the stop distance must fit the holding period. If a draft fails, the Risk Manager rewrites it.
Step 6: The Board Shows Who Changed Their Mind
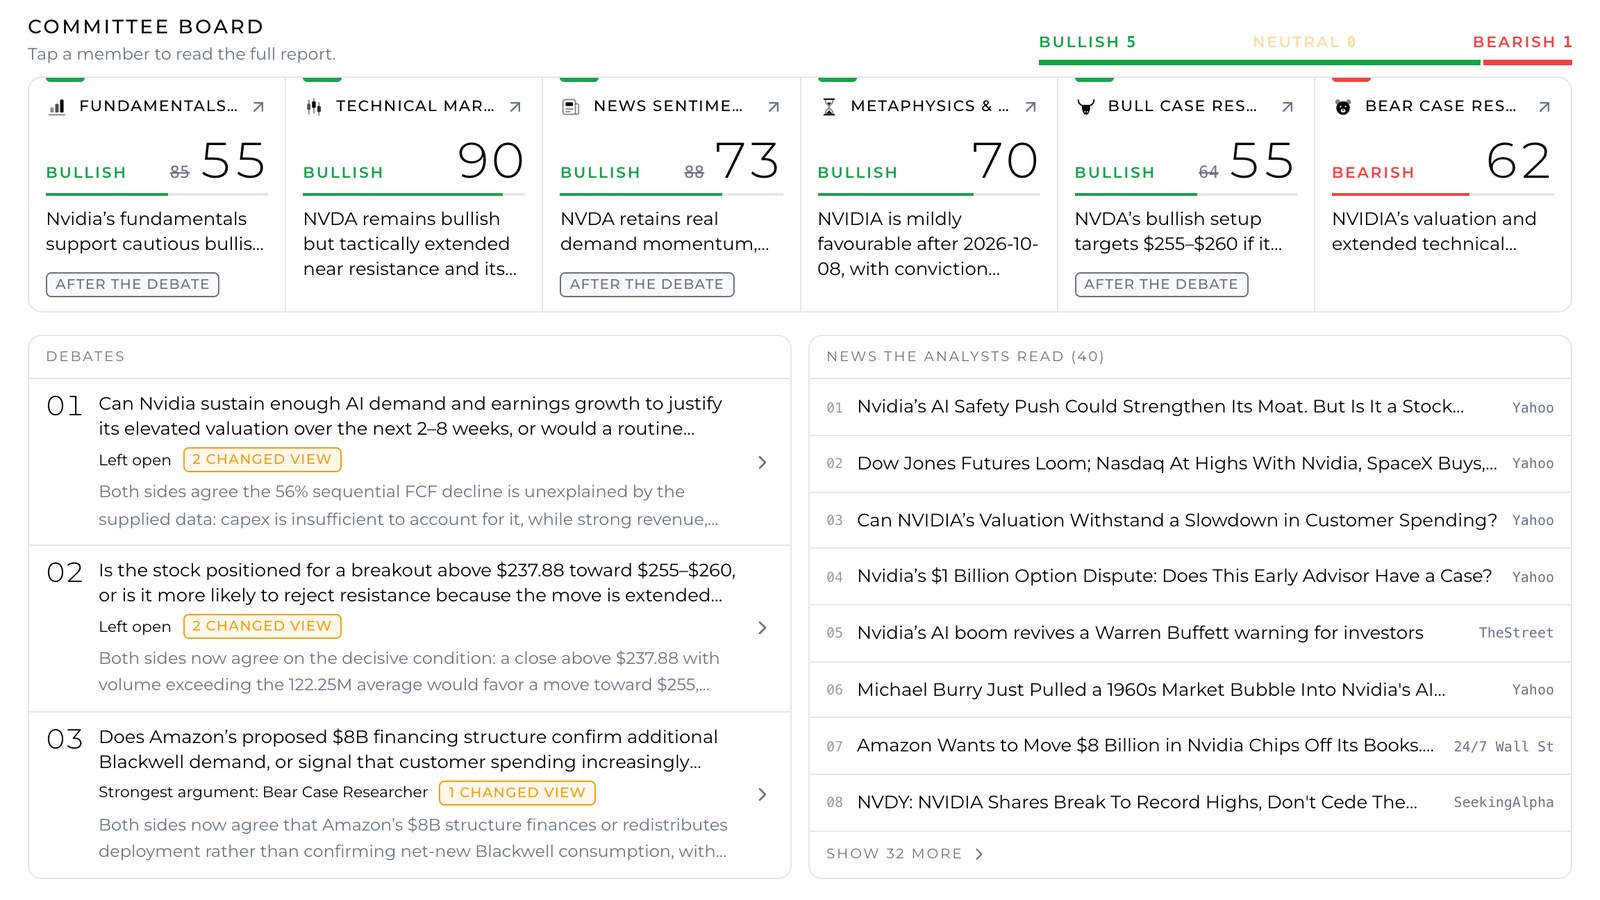
Below the decision sits the committee board, one card for each member. A struck-through number beside the current one means the member moved during the debate. In the NVDA run the Fundamentals Analyst fell from 85 to 55, the News Sentiment Analyst from 88 to 73, and the Bull Researcher from 64 to 55. The rating stayed Buy, but with much less conviction than the opening reports suggested, and the board shows that at a glance.
Tap any member to read the full report, its key points, its risks and the data it used. The Debates panel lists each question with its outcome ("left open" or "strongest argument: Bear Case Researcher") and how many members changed view. Tap one to replay the whole exchange. The timeline at the top replays any stage of the run.
Next to it is every article the news analyst read, with its source, so you can check a claim yourself. One button builds the PDF report: cover, decision and plan, financial snapshot, the debate, all analyst reports and the sources. Here is a sample report for TSLA.
Ask the Committee: Follow-Up Questions With Live Data
A report answers the questions its authors thought of. Yours are different, and this is where the rebuild goes furthest. When the run ends, the analysis folds into one bar and a conversation opens with the same eight members.
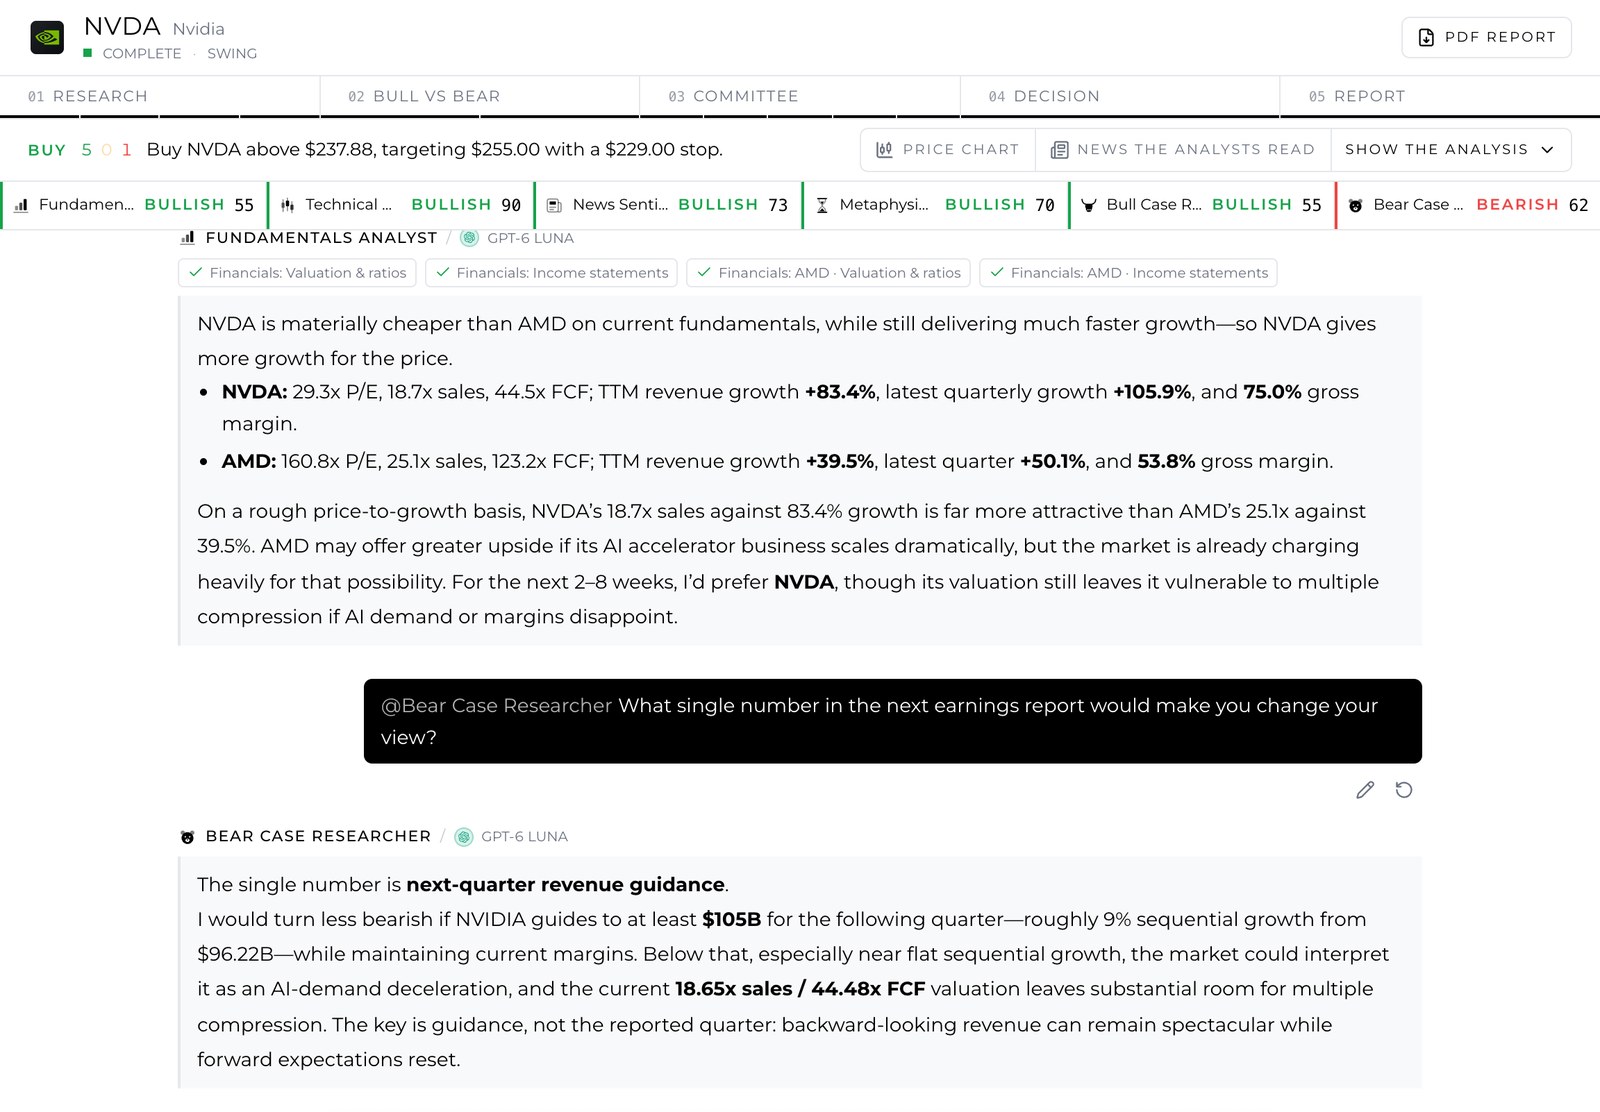
Ask anything, and the right member answers. You do not need to know who covers what. We asked, "How does NVDA's valuation compare with AMD right now, and which one gives more growth for the price?" The page showed the routing first: Fundamentals Analyst, and why. Then it showed the data being pulled: valuation ratios and income statements for NVDA, and the same two sets for AMD. The answer put the numbers side by side. NVDA: 29.3 times earnings, 18.7 times sales, revenue up 83.4% over twelve months. AMD: 160.8 times earnings, 25.1 times sales, revenue up 39.5%. It closed with a view and its main risk.
Pick who answers with @. Type @ and choose a member. We asked the Bear Researcher, "What single number in the next earnings report would make you change your view?" The answer was specific: next-quarter revenue guidance of at least $105B, about 9% sequential growth from $96.22B. Below that, the bear case gets stronger. A dissenting opinion became a number you can check on earnings day.
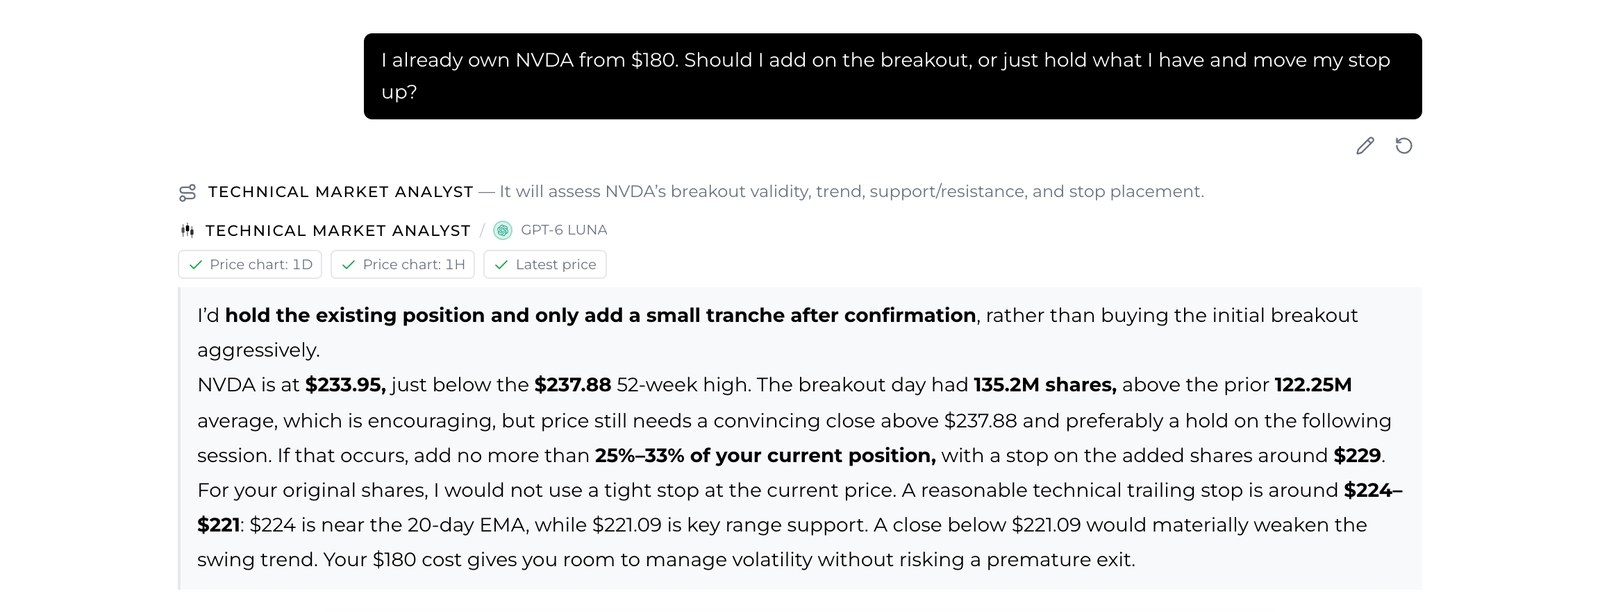
Bring your own position. The committee's plan is written for someone with no shares. We wrote, "I already own NVDA from $180. Should I add on the breakout, or hold and move my stop up?" The Technical Market Analyst pulled the daily chart, the hourly chart and the latest price, then answered for that situation: hold, add at most 25%–33% of the position only after a confirmed close above $237.88, and trail the original shares near $224–$221 instead of using a tight stop.
A few more things the conversation can do:
- Attach images. Paste or upload a screenshot of your position or a chart, and the member reads it.
- Edit and ask again. Change a question or resend it; earlier versions stay available.
- It remembers. Later answers build on earlier ones in the same session.
- Views can change. If your question exposes a real problem, a member can revise its view, the Risk Manager re-checks the decision, and the board and the PDF are updated, with the change marked.
How to Use the Analysis to Judge a Stock
A workable reading order, from our own use:
- Read the split before the rating. A 5–0–1 Buy and a 3–1–2 Buy are different decisions.
- Look for struck-through numbers. Conviction that fell in the debate tells you where the weak point is.
- Open the debate that was "left open". That is the committee telling you what it does not know.
- Read "what would prove this wrong" as your exit checklist. Decide in advance what you will do if one of those lines comes true.
- Check the entry type. "Entry on a break" and "buy zone on a pullback" both mean waiting. If the price never gets there, the plan is void.
- Compare the stop distance with what you can tolerate. If the stop is too wide for your account, reduce size instead of moving the stop.
- Ask the dissenter. Whoever disagrees with the decision usually holds the most useful question.
- Run a second holding period. A stock can be a Hold for two weeks and a Buy for a year. That is not a contradiction.
What to Watch Out For
We would rather you know the limits than discover them.
- It is a research view, not a price prediction. The card says so on every decision. It is not a signal service, and we do not claim that following its plans beats the market. Use it to understand a stock faster and to pressure-test your own thesis.
- Fundamental analysts lean cautious on expensive stocks. High-multiple names often draw a bearish fundamentals view while the chart is strong. Read both.
- Two runs can differ. Models are not deterministic, and news changes hourly. If a decision flips between runs, the call is close.
- Data has gaps. When the committee cannot explain a number, as with Nvidia's free cash flow above, it says so. Take "the supplied data cannot prove this" seriously.
- The plan has a clock. Entries expire, and holding periods end. An analysis from three weeks ago is history.
- Position size is yours. The committee does not know your account, taxes or other holdings unless you tell it.
- Not financial advice. SimianX provides research tools. Decisions and their results are your own.
Models, Points, Languages and Devices
- Models. The free plan runs every agent on GPT-6 Luna. Paid plans choose one model for all agents or one per agent, and the choice is saved for later runs. See pricing.
- Points. Each model call costs points, and the model settings show an estimate per analysis. If you run out, the analysis pauses at the end of the current step, keeps everything finished so far, and resumes after a top-up or the daily reset. Rates are on the points page.
- Time. About 4–8 minutes. The NVDA run here took 3 minutes 32 seconds.
- Languages. The interface, reports, debate, PDF and email are available in 16 languages.
- Phone and desktop. The stage and the result board are designed separately for small screens, not shrunk from the desktop layout.
Deep Analysis is the slow, thorough look. For the minute-by-minute view of the same stock, open the Live Command Room, which we covered in Stock Live Analysis. To find what is moving before you choose a ticker, start from Market Pulse.
FAQ
What is multi-agent AI stock analysis?
Several AI agents with different roles study the same stock, and their conclusions are compared and challenged before a final decision. The aim is to expose disagreement instead of hiding it inside one confident answer. We compared the two approaches in Multi-Agent AI vs ChatGPT for NVDA Signals.
How long does a Deep Analysis take?
Usually 4 to 8 minutes. You can leave the page; the run continues and the session waits in your sidebar.
Which stocks are covered?
US-listed stocks. The free plan covers a list of popular tickers shown on the start card; paid plans are not limited to that list.
Can I trust the Buy, Hold or Sell rating?
Trust it as the committee's reasoned view, with its reasons and its dissent visible. Do not treat it as a forecast. The most valuable parts are the evidence, the open questions and the conditions that would prove the view wrong.
Can I ask about a stock I already own?
Yes. Give your cost and size in a follow-up question, or attach a screenshot, and the answer is written for your position.
Does a follow-up question cost points?
Yes. Each answer uses model calls, usually far fewer than a full analysis.
Try It on a Stock You Know Well
The fastest way to judge the rebuild is to run it on a company you already understand, such as NVDA. You will see quickly whether the committee found what you know, and what it found that you had missed. Start a Deep Analysis, pick your holding period, and when the decision arrives, ask the member who disagreed.