 By Marcus Reeve
ANT Stock After Day One: What the Filings and 8 AI Agents Say
Anthropic's Class A shares began trading on the Nasdaq Global Select Market under the ticker ANT on November 19, 2026, a day after the largest IPO on record priced at $83.00. The stock opened at $111.50, traded between $92.72 and $115.10, and closed at $97.17, 17.1% above the IPO price, on about 829 million shares. At that close ANT was worth about $1.28 trillion on our basic share count and about $1.76 trillion fully diluted. On its second trading day, November 20, ANT fell 8.5% to close at $88.91, 7.1% above the IPO price, which puts it at about $1.19 trillion on our basic count, now including the 147 million shares the underwriters bought when they exercised their option in full at the November 20 closing; the day-two section below has the numbers.
This page is not about the IPO date or the deal terms; our Anthropic IPO tracker covers those. Nor is it about the loss line, which we take apart in Anthropic's cash burn explained. It answers the questions that come after the first trade: what ANT stock is worth against its revenue, what could move it next, and what a structured AI research committee concludes. We ran SimianX's 8-agent research committee on ANT once, after the close, and we also checked how Anthropic's own Claude models perform in our AI trading arena.
Key takeaways
- Day one: ANT closed at $97.17, +17.1% versus $83, the fourth-biggest first-day gain among seven mega-IPOs we compared. It gave back part of an opening jump of +34.3%.
- Day two: on November 20 ANT closed at $88.91, down 8.5% on the day and 7.1% above the $83 IPO price, and below the $92.72 day-one low that the committee flagged. At that close it traded at about 14.7x run-rate revenue on basic shares and 19.8x fully diluted.
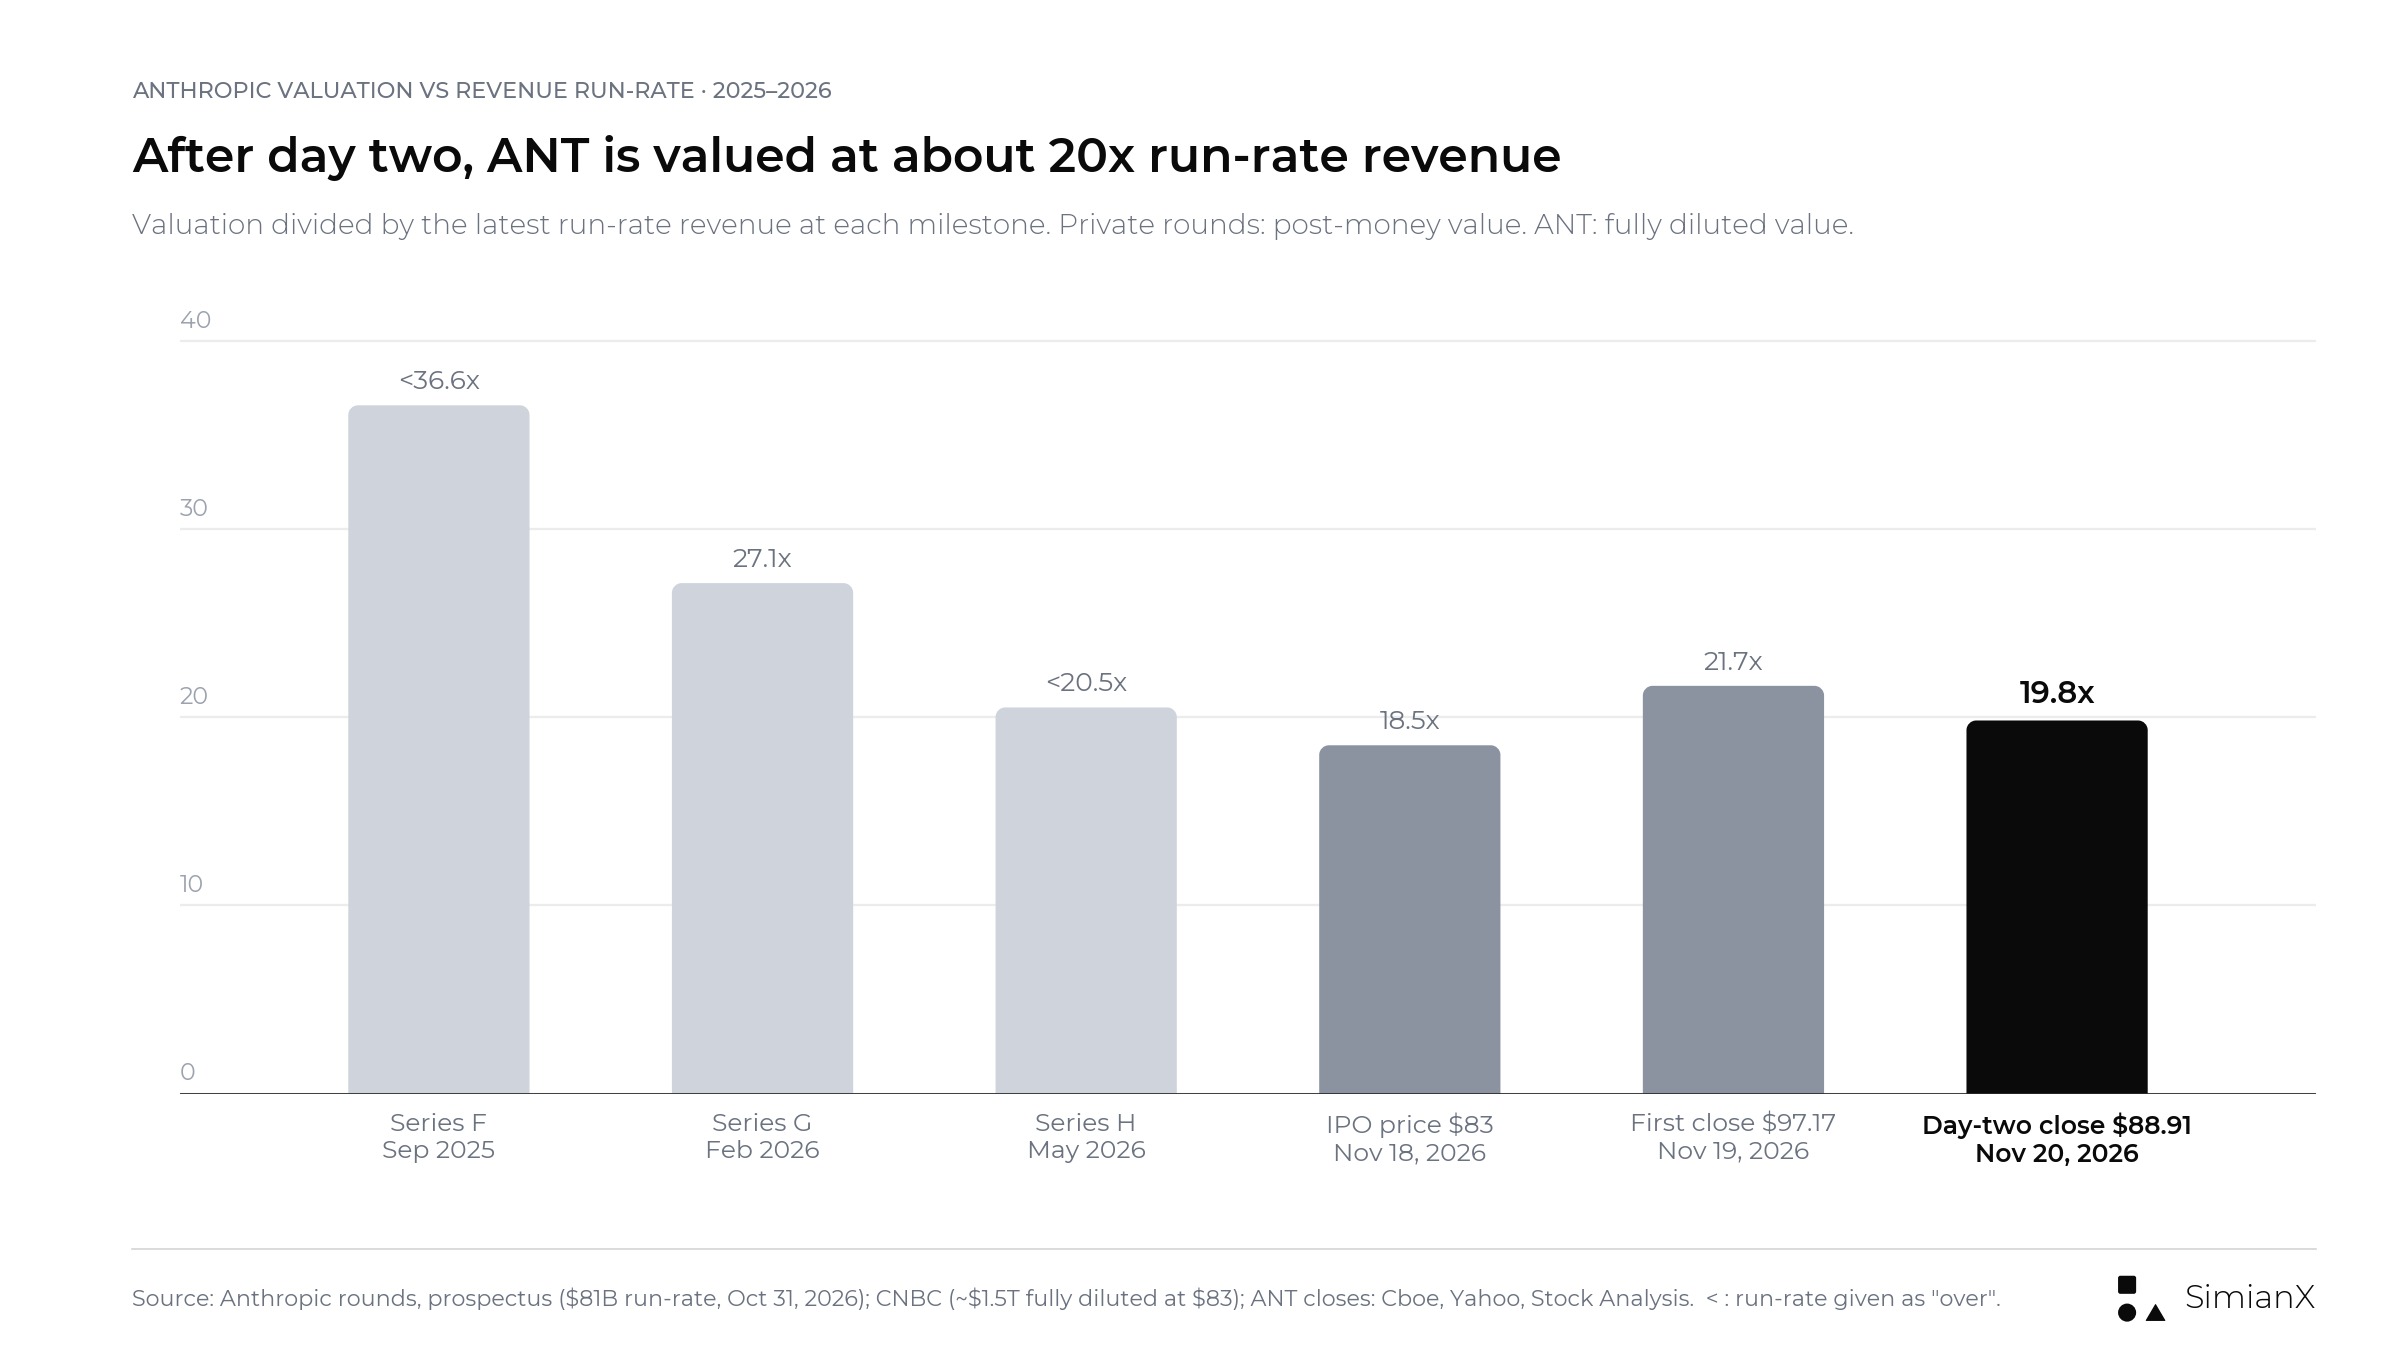
- Valuation: at the first close, ANT traded at about 15.8x its $81 billion run-rate revenue on basic shares and about 21.7x fully diluted.
- The AI committee: after the close it rated ANT Hold (confidence 78/100) with no entry, stop or target: no trade signal yet on day-one data. The four analysts stayed neutral, mostly for lack of day-one data, and the bear researcher (61/100) outweighed the bull researcher (25/100).
- Supply: only about 8.4% of the shares trade freely after the underwriters' option was exercised in full, but insider shares unlock in tranches from day one, with the largest release (up to 3.0 billion shares) tied to the Q1 2027 results.
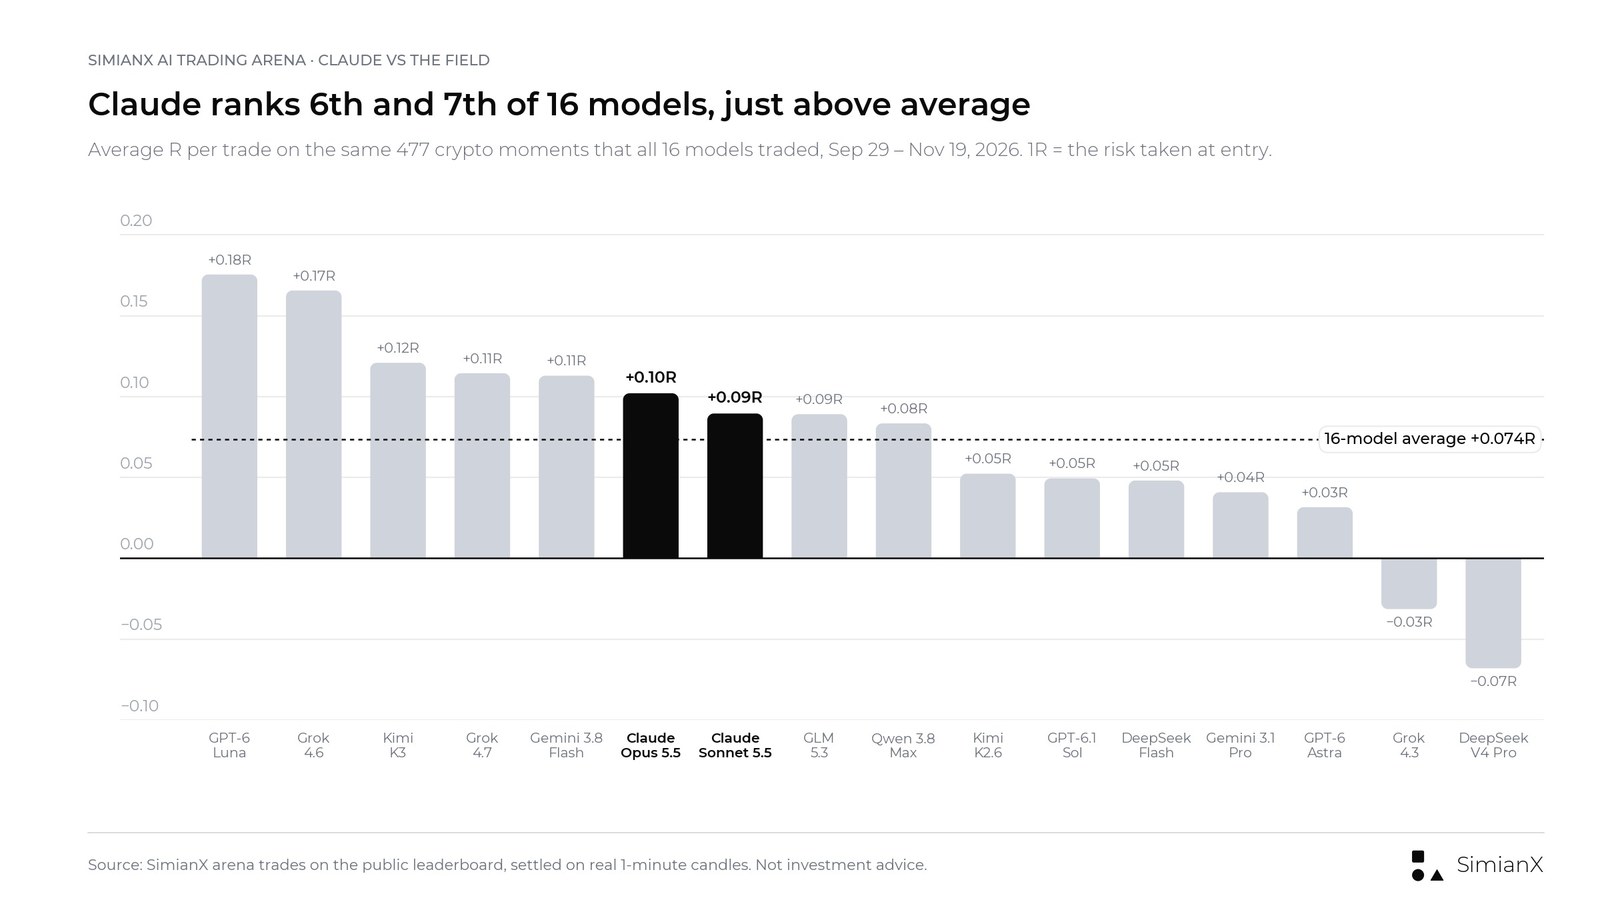
- Claude as a trader: Claude Opus 5.5 and Claude Sonnet 5.5 rank 6th and 7th of 16 models on identical crypto trades, slightly above the average, a gap that is not statistically meaningful.
ANT Stock's First Day in Numbers
| Item | Value |
|---|---|
| IPO price (November 18, 2026) | $83.00 |
| Opening price | $111.50 (+34.3%) |
| Intraday high | $115.10 (+38.7%) |
| Intraday low | $92.72 (+11.7%) |
| Official close | $97.17 (+17.1%) |
| Volume | About 829 million shares |
| Shares sold in the IPO | 980,000,000 (956,351,354 new, 23,648,646 from selling stockholders) |
| Gross proceeds | $81.34 billion, the largest IPO on record |
| Market value at the close, basic | About $1.28 trillion (about 13.20 billion shares, SimianX estimate) |
| Market value at the close, fully diluted | About $1.76 trillion (CNBC's ~$1.5 trillion at $83, scaled to the close) |
Prices: Cboe official figures, cross-checked with Stock Analysis and SimianX's own market-data feed. Volume is Cboe's regular-session figure. IPO size as priced on November 18; with the underwriters' option exercised at the November 20 closing, the IPO came to 1,127,000,000 shares and about $93.5 billion (see the day-two section below).
ANT opened 34.3% above the IPO price and traded as high as $115.10 (+38.7%) and as low as $92.72 (+11.7%). It closed 12.9% below its opening price. Volume of about 829 million shares equals roughly 85% of the 980 million shares sold in the IPO, so a large part of the allocation changed hands on the first day. Even at the low, the stock stayed 11.7% above $83, so the underwriters' price support (Morgan Stanley is the stabilization agent) was not tested.
ANT Stock's Second Day: Price Path and Valuation at the November 20 Close
On November 20, its second trading day, ANT opened at $89.86, below the $92.72 day-one low, and never traded above that level: it ranged from $83.05 to $92.56 and closed at $88.91, down 8.5% on the day. Over two sessions it has fallen 20.3% from the $111.50 first trade and closed 7.1% above the $83.00 IPO price.
| Nov 19 (day 1) | Nov 20 (day 2) | |
|---|---|---|
| Open | $111.50 | $89.86 |
| High | $115.10 | $92.56 |
| Low | $92.72 | $83.05 |
| Official close | $97.17 | $88.91 |
| Close vs the $83 IPO price | +17.1% | +7.1% |
| Market value, basic (SimianX estimate) | About $1.28 trillion | About $1.19 trillion |
| Market value, fully diluted | About $1.76 trillion | About $1.61 trillion |
| Run-rate revenue multiple, basic / fully diluted | 15.8x / 21.7x | 14.7x / 19.8x |
Day 1: Cboe official figures. Day 2: Yahoo Finance daily bar, cross-checked with Stock Analysis. Multiples use the $81 billion run-rate revenue at October 31, 2026; the share count is explained in the methodology below.
Closing and the option. Anthropic announced on November 20 that the IPO and the private placement closed and that the underwriters exercised their option in full: 1,127,000,000 shares in the IPO (1,103,351,354 of them new), about $93.5 billion, plus 313,253,007 Class N shares for about $26.0 billion. The 147 million option shares raise our basic count to about 13.35 billion, so the day-two market values use that count, and the free float rises to about 8.4%.
Valuation at the November 20 close. On that basic share count, ANT traded at about 14.7 times run-rate revenue, 17.5 times Q3 2026 revenue annualized and 26.8 times nine-month revenue annualized, against 13.5, 16.2 and 24.7 times at the $83 IPO price on the count before the option. Fully diluted, the run-rate multiple was about 19.8 times, back below the Series H's multiple of at most about 20.5 times; at the first close it had been above it, at 21.7 times.
The market that day. ANT's second session came on a day of broad declines led by technology and chip stocks: the Nasdaq Composite fell 5.3%, the PHLX Semiconductor Index (SOX) 10.7% and the S&P 500 3.7%, which left the S&P 500 11.6% below its October 6 record close. These index moves are context for the day, not an explanation of ANT's price.
The committee's levels. The committee's Hold rating below was set on day-one data and has not been rerun. It named the $92.72 day-one low as the level where a close below could favor further weakness, and ANT closed below it on November 20. That describes the price; it is not a new rating. For the IPO-price timeline and what the prospectus says about price stabilization and the underwriters' option, see our Anthropic IPO tracker.
How ANT's Debut Compares With Other Mega-IPOs
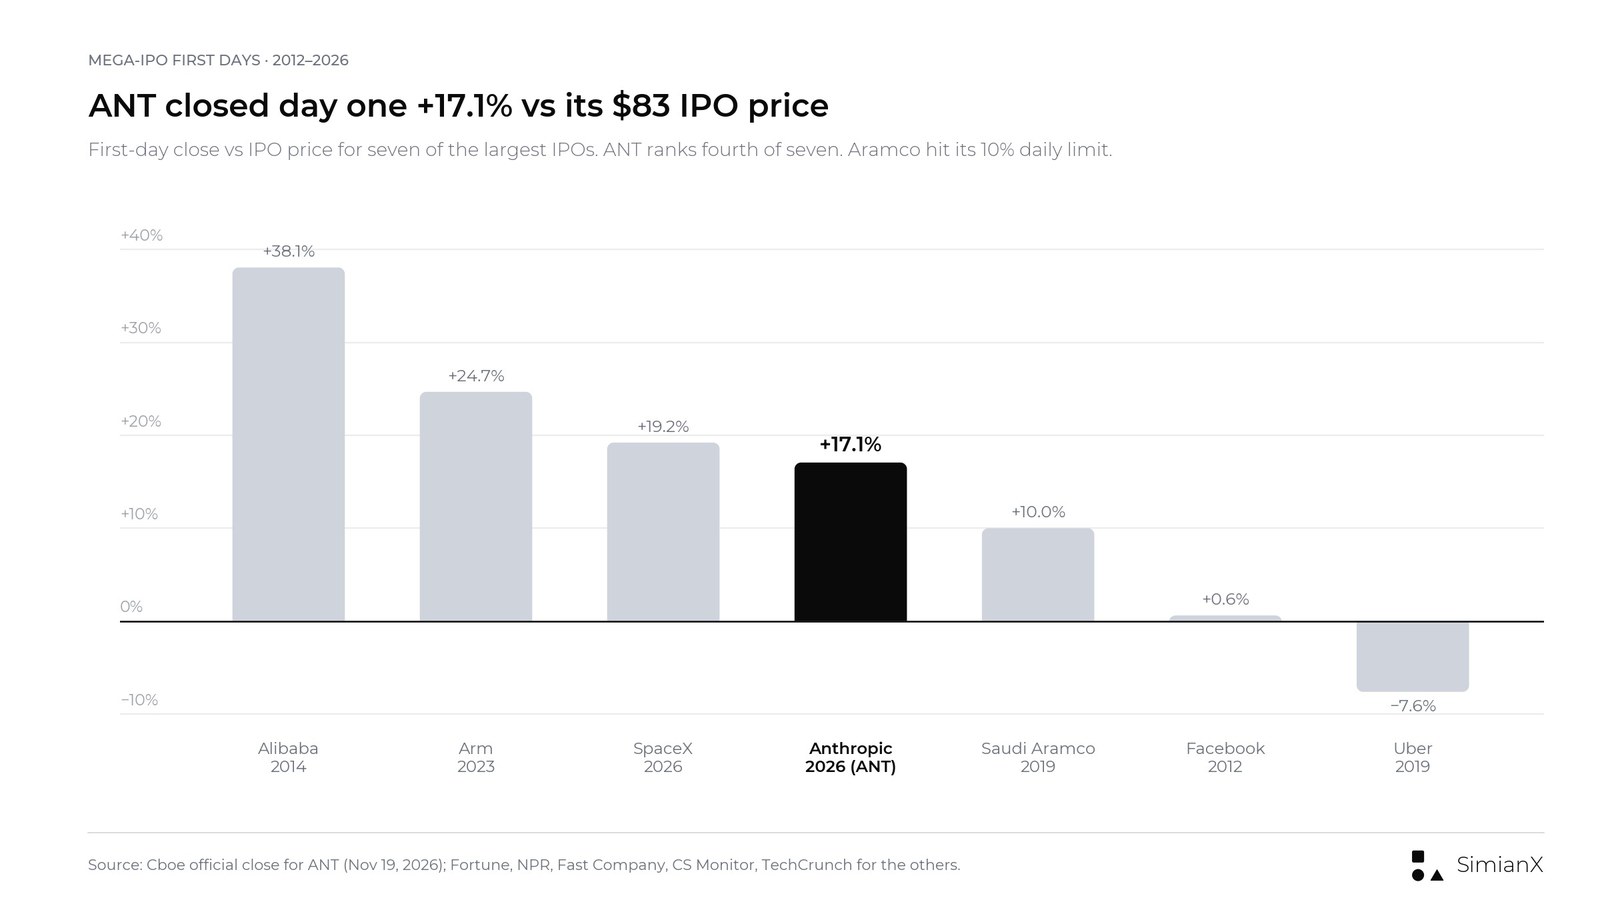
| Company | First trading day | IPO price | First-day close | Change | Raised |
|---|---|---|---|---|---|
| Alibaba | Sep 19, 2014 | $68.00 | $93.89 | +38.1% | $21.8B |
| Arm | Sep 14, 2023 | $51.00 | $63.59 | +24.7% | $4.9B |
| SpaceX | Jun 12, 2026 | $135.00 | $160.95 | +19.2% | $75B |
| Anthropic (ANT) | Nov 19, 2026 | $83.00 | $97.17 | +17.1% | $81.34B |
| Saudi Aramco | Dec 11, 2019 | 32.00 riyals | 35.20 riyals | +10.0% | $25.6B |
| May 18, 2012 | $38.00 | $38.23 | +0.6% | $16B | |
| Uber | May 10, 2019 | $45.00 | $41.57 | −7.6% | $8.1B |
A first-day move is a reading of demand, not a verdict on value. Facebook barely held its price on day one in 2012 and Uber fell in 2019, while Alibaba's 38% jump in 2014 is the largest in this group. ANT's base deal of $81.34 billion is the largest IPO on record, ahead of SpaceX's $75 billion in June, so its first-day price had to clear far more stock than any debut before it.
Anthropic Valuation vs Revenue Run-Rate
Which revenue figure you divide by changes the answer a lot. The prospectus gives a run-rate revenue of about $81 billion as of October 31, 2026, up $10 billion in a single month. Run-rate is the last 28 days of usage fees times 13 plus monthly subscriptions times 12, so it annualizes a snapshot. Reported GAAP revenue is smaller: $16.96 billion in Q3 2026 and $33.2 billion in the first nine months.
| Revenue measure | Amount | Multiple at $83 (basic) | Multiple at the close (basic) | Multiple at the close (fully diluted) |
|---|---|---|---|---|
| Run-rate revenue, Oct 31, 2026 | $81.0B | 13.5x | 15.8x | 21.7x |
| Q3 2026 revenue × 4 | $67.8B | 16.2x | 18.9x | 25.9x |
| First nine months of 2026, annualized | $44.3B | 24.7x | 29.0x | 39.7x |
| Full-year 2025 revenue | $4.6B | 238x | 279x | 382x |
Two readings of the same table:
- Against the private rounds, the multiple is not new. Investors paid less than 37 times run-rate revenue in the September 2025 Series F, 27 times in February 2026 and less than 21 times in the May 2026 Series H. At the IPO price the fully diluted multiple was about 18.5 times. At the first close it was about 21.7 times, above the Series H, where the multiple was at most about 20.5 times: public buyers paid a higher multiple than the last private round.
- Against reported revenue, it is steep. On the nine months annualized, ANT trades at about 29.0 times sales on basic shares. The bet is that revenue keeps compounding: if it doubled again from the October run-rate to about $162 billion, the basic value at the first close would be about 7.9 times that figure.
Growth, Margins and the Loss Line
The bull case for ANT stock starts with the revenue line, and the filing backs it up. Anthropic's revenue went from $41 million in 2023 to $386 million in 2024 and $4.6 billion in 2025. In the first nine months of 2026 it reached $33.2 billion, up from $2.5 billion a year earlier, a growth rate the company puts at 1,206%. The prospectus also says, in plain words, that Anthropic does not expect growth to continue at comparable rates.
| Quarter | Revenue | Compute and infrastructure | Operating income (loss) | Net loss |
|---|---|---|---|---|
| Q3 2025 | $1.38B | $2.05B | −$3.09B | −$12.14B |
| Q4 2025 | $2.04B | $2.95B | −$2.84B | −$16.86B |
| Q1 2026 | $4.73B | $3.39B | −$1.67B | −$14.44B |
| Q2 2026 | $11.56B | $5.56B | +$0.97B | −$66.31B |
| Q3 2026 | $16.96B | $9.86B | −$0.57B | −$23.29B |
Source: Anthropic S-1 Amendment No. 2, quarterly consolidated statements of operations (unaudited).
Three things stand out in that table.
- Revenue grew about 47% in a single quarter. Q3 2026 revenue of $16.96 billion compares with $11.56 billion in Q2 and $1.38 billion a year earlier.
- Operating losses are now small next to revenue. The operating margin was −3% in Q3 2026, and Anthropic reports a 15% adjusted operating margin ($2.5 billion) once stock-based compensation is excluded. Q2 2026 even showed a GAAP operating profit of $974 million.
- The net loss is a different story, and it is mostly non-cash. The nine-month net loss of about $104 billion comes almost entirely from changes in the fair value of convertible notes and similar instruments as Anthropic's valuation rose. Our separate breakdown, Anthropic's cash burn and the $80.7B loss explained, walks through those charges line by line, so we do not repeat it here.
Customer data points the same way. Customers paying $100,000 or more a year (trailing twelve months) rose from more than 950 to more than 11,900 between September 2025 and September 2026; about 250 pay $10 million or more. Anthropic reports a net revenue retention of about 900% as of September 30, 2026, which means the average existing customer spent roughly nine times as much as a year earlier.
The balance sheet is unusually strong for a company with these losses. At September 30, 2026 Anthropic held $95.6 billion of cash and cash equivalents plus $36.3 billion of short-term investments. The IPO added about $91.6 billion of gross primary proceeds (1,103,351,354 new shares at $83, including the 147 million option shares), and the $26.0 billion Class N private placement with Google, NVIDIA, AMD, Broadcom, Micron, Microsoft and TSMC closed alongside it on November 20.
Float and Lock-Up: The ANT Unlock Calendar
ANT starts life with a small float. With the underwriters' option exercised in full at the November 20 closing, 1,127 million shares were sold in the IPO, about 8.4% of the roughly 13.35 billion Class A and Class N shares we estimate are outstanding after the offering, the option and the private placement (before the option: 980 million shares, about 7.4% of about 13.2 billion).
Instead of a single lock-up expiry after 180 days, the prospectus spreads the unlocks over a year. The schedule below is taken from S-1 Amendment No. 2 (November 10, 2026), counted from the prospectus date of November 18; when a date falls on a non-trading day, it moves to the next trading day. The amounts are maximums and include shares that come from equity awards.
| Earliest date shares can be sold | Up to | Who |
|---|---|---|
| November 19, 2026 (first trading day) | 316 million | Non-founder directors, officers, current and former employees and consultants |
| December 15, 2026 (27th day) | 299 million | Further tranche |
| January 5, 2027 (48th day) | 299 million | Further tranche |
| January 19, 2027 (62nd day) | 349 million | Further tranche |
| February 2, 2027 (76th day) | 349 million | Further tranche |
| Second full trading day after full-year 2026 results | 1.7 billion | Then five tranches of up to 474 million each over the next 69 days |
| Q1 2027 results, or May 17, 2027 (180th day) if earlier | 3.0 billion | Then four tranches of up to 449 million each |
| Q2 2027 results | 562 million | Then five tranches of up to 505 million each |
| Q3 2027 results, or November 18, 2027 (365th day) if earlier | 1.9 billion | Final lock-up release |
Source: Anthropic S-1 Amendment No. 2, "Shares Eligible for Future Sale". Goldman Sachs and Morgan Stanley can release shares early.
Two details matter for anyone watching supply. First, the 313 million Class N shares sold to the strategic investors at $83 are not under the lock-up, but they are restricted securities that cannot be resold without registration or a Rule 144 exemption; Google also has registration rights. Second, the largest single release, up to 3.0 billion shares, comes with the first-quarter 2027 results, roughly six months out. A steady staircase of unlocks tends to spread selling pressure out rather than concentrate it on one day, but it also means new supply arrives almost every month.
What SimianX's 8-Agent Committee Found
We ran SimianX's eight-agent research committee on ANT once, right after the 1:00 p.m. PT close on November 19, for a swing horizon (the next 2 to 8 weeks). The committee's final rating step did not complete today: the model service hit a rate limit during the risk manager's call, and under our rules for these runs we did not rerun it, so this page carries no committee rating, entry, stop or target. Everything before it finished: the four analysts, the bull and bear researchers, a two-question debate chaired by the research manager, and the members' vote.
Update, November 19, 2026, 2:49 p.m. PT: the stopped run was resumed once after the close to complete its final step, on the same data cut off at the November 19 close. The risk manager's rating for the committee: Hold, confidence 78/100, with no entry, stop or target (no trade until a signal is confirmed). It rests on the same thin day-one inputs described below, including a live-quote tool that returned no data during the run.
>
Its headline: "Hold ANT and wait for a confirmed breakout or breakdown before trading." Its three reasons: there is no verified post-IPO trend or dated price sequence; neither a long nor a short entry signal is confirmed; and the catalysts and available fundamentals give no directional edge. It named two levels to watch, the day-one low of $92.72 (a close below it could favor further weakness) and the opening print of $111.50 (a sustained close above it with volume could favor a long), and flagged the leveraged ETF launch or company news as possible triggers for a sharp move. Hold here means no trade signal yet on day-one data, not a recommendation to own the stock.
It was day one, and the committee worked with what its data sources had: no price history beyond the first session, no options, no 13F holdings and no short-interest data, and the fundamentals analyst could not assess the financials because our feed did not yet carry them. The financial figures elsewhere on this page come from Anthropic's S-1 amendments and final prospectus (424B4), not from the committee. What follows is what the members concluded, as they stated it.
| Seat | Stance (confidence) | What drove it |
|---|---|---|
| Fundamentals analyst | Neutral (100) | Its data feeds held no financial statements and no price for a stock listed that morning, so it declined to judge growth or valuation. The prospectus figures earlier on this page were not in its sources yet. |
| Technical/market analyst | Neutral (100) | One trading day gives no trend, momentum or volatility reading. It marked the first-day low ($92.72) and high ($115.10) as the only reference levels: a close below $92.72 would be evidence of further weakness. |
| News analyst | Neutral (92) | Strong demand signals (the 34% opening premium and reports of heavy IPO demand) against a first-day gain that faded and a debut that did not lift the wider AI trade. It flagged Tradr's 2x long and short ANT ETFs, due to start trading on Monday, November 23, as a volatility catalyst. |
| Positioning analyst | Neutral (100) | No options, short interest, analyst estimates or 13F holdings exist yet for a day-old stock, so it could not say what the market expects. |
| Bull researcher | Bullish (25) | A rebound toward $105–$115 within eight weeks if post-IPO selling stabilizes; a close below $92.72 would undercut it. It called its own case "trading-driven, not fundamental". |
| Bear researcher | Bearish (61) | The faded opening premium looks like distribution, and the data offered no valuation anchor; downside of $88–$92. It would change its mind on a sustained close back above $111.50 with volume. |
The debate settled nothing. The research manager put two questions to the researchers: whether the debut shows demand that can carry a rebound or demand that is fading, and whether customer-acquisition credits mentioned in the day's news, together with the new leveraged ETFs, help a rebound or add downside risk. On both, the chair ruled the question unresolved, because neither side could verify a dated price after the open with the tools available during the run. In the vote, all four analysts stayed neutral, the bull held at 25, and the bear eased from 67 to 61.
How to read this. A day-one stock is close to the hardest case for this kind of committee: most of its data sources (price history, options, short interest, analyst estimates, quarterly statements) simply do not exist yet, and the members said so instead of guessing. The useful output is the shape of the disagreement, not a call: the only levels any member named are $92.72 on the downside and $111.50 to $115.10 on the upside, and both researchers tied their view to how the stock trades around those levels in the coming weeks.
Bull Case vs Bear Case for ANT Stock
This table combines the committee's two researchers with the prospectus figures covered above.
| Bull case | Bear case | |
|---|---|---|
| Demand | Opened 34.3% above $83 and closed above the IPO price; the book was reported about six times covered before pricing (Bloomberg) | The opening premium faded through the day; the debut did not lift the wider AI trade |
| Growth | Run-rate revenue of about $81 billion on October 31, up $10 billion in a month; 9-month revenue up 1,206% | The company itself says growth will not continue at these rates; run-rate is a one-month snapshot |
| Profitability | Q3 2026 adjusted operating margin of 15%, and a GAAP operating profit in Q2 2026 | Q3 2026 GAAP operating margin of −3%; about $900.9 billion of committed compute and infrastructure spend |
| Valuation | The multiple of run-rate revenue fell with each funding round as revenue caught up | At the first close, about 21.7 times run-rate revenue on a fully diluted basis leaves little room for error |
| Supply | Only about 8.4% of shares trade freely, and unlocks come in small steps at first | New shares unlock almost every month for a year, with up to 3.0 billion at the Q1 2027 results |
| Trading | Wider access (2x ETFs from Monday) can draw in buyers | Leveraged products can amplify falls as much as rallies |
Committee findings, including the Hold rating, are model research output from a single run on thin day-one data. They are not a recommendation.
Key Risks the Filings Flag
The committee's own list of risks is above. The prospectus runs to dozens of pages of risk factors; these are the ones we think matter most for a public shareholder.
- Valuation leaves little room for disappointment. At the IPO price the company was valued at about 13.5 times its $81 billion run-rate revenue, and run-rate is an annualized snapshot of a single month, not a forecast. Anthropic itself warns that the metric can overstate a full year.
- Compute commitments are enormous. As of and after September 30, 2026, Anthropic had purchase commitments and leases with an aggregate committed spend of about $900.9 billion, substantially all for compute and infrastructure: about $451.6 billion before the end of 2030 and about $70.7 billion due within twelve months. Many of these contracts are take-or-pay, so if demand slows, the costs do not.
- Governance limits outside shareholders. Anthropic is a public benefit corporation. Its Long-Term Benefit Trust elects board members through a Class T share, and the co-founders' single Class F share carries 50.1% of the votes until a sunset. Public Class A holders cannot change control.
- Customer concentration. No single customer was more than 10% of revenue in the first nine months of 2026, but the top five were about 25%, and many large customers are not on long-term contracts.
- Competition and pricing. OpenAI, Google and others sell similar models, and Anthropic says newer models lower the cost per task for customers; Opus 5.5 cut it by about 40% versus Opus 5. Cheaper tasks can drive usage, but they also pressure revenue per task.
- Reported losses will stay volatile. Fair-value swings on convertible instruments drove a $66 billion net loss in a single quarter (Q2 2026). Those swings should end as the instruments convert, but headline earnings can still surprise.
- Supply overhang. The staircase of unlocks above adds new tradable shares almost every month for a year.
How Claude Models Trade on SimianX
Anthropic's product is Claude, and SimianX runs Claude, along with 30+ other AI models, in its crypto trading research. On IPO day it is fair to ask whether "the Anthropic model" is also the best trader. Our data says: good, not best, and not measurably different from the average.
How the arena works. The SimianX arena replays real moments when a live analysis session opened a crypto position, and asks every model to decide on the same market snapshot. Two in three moments use the forced-direction prompt (the model must pick long or short and set its own stop and target); the rest let it stay flat. Each entry is settled on the exchange's real 1-minute candles by its own stop or target, or closed at market after 100 candles (at least six hours). Nothing is managed in between. A model's trades count only from its public release date. Results are measured in R, the profit or loss divided by the risk taken at entry, so +0.10R means a trade made a tenth of what it risked, on average.
Claude Opus 5.5 and Claude Sonnet 5.5, all arena trades counted on the board:
| Model | Trades | Window | Win rate | Average R |
|---|---|---|---|---|
| Claude Opus 5.5 | 663 | Sep 22 – Nov 19, 2026 | 45.4% | +0.06R |
| Claude Sonnet 5.5 | 645 | Sep 28 – Nov 19, 2026 | 46.0% | +0.08R |
A win rate under 50% with a positive average R is normal here: targets sit further from the entry than stops, so a winning trade typically earns more than a losing trade loses.
Head to head on identical moments. The cleanest comparison uses only the 477 moments that all 16 long-running arena models traded, from September 29 to November 19, 2026 (41 coins, led by BTC, ETH, XRP and SOL; mostly 15-minute charts).
| Rank by average R | Model | Win rate | Average R |
|---|---|---|---|
| 1 | GPT-6 Luna | 49.7% | +0.175R |
| 2 | Grok 4.6 | 46.5% | +0.166R |
| 6 | Claude Opus 5.5 | 45.9% | +0.102R |
| 7 | Claude Sonnet 5.5 | 45.7% | +0.090R |
| — | Average of all 16 models | 44.1% | +0.074R |
| 16 | DeepSeek V4 Pro | 36.3% | −0.068R |
Is the difference meaningful? Mostly not. We paired each Claude trade with the average of every other model on the same moment and bootstrapped the difference by session. Claude Opus 5.5 beat that field average by about 0.03R per trade (646 moments), but the 90% confidence interval runs from −0.03R to +0.08R, so the gap could be zero. Sonnet 5.5 looks the same (+0.02R, interval spanning zero). The only clear results: GPT-6 Luna beat both Claude models by about 0.08R per trade, and both Claude models beat DeepSeek V4 Pro and Grok 4.3. Against the other eleven models, the differences sit inside the noise.
Where Claude did better and worse. On slower charts (1-hour and above, 53 shared moments) Claude Sonnet 5.5 ranked 3rd with +0.57R against a +0.40R field average, and Opus 5.5 ranked 2nd on the 11 four-hour moments; those samples are small. On the 329 shared 15-minute moments Opus 5.5 ranked 4th. When allowed to stay flat, both Claude models did worse than on forced calls (about −0.12R and −0.10R over roughly 80 trades each), again a small sample.
Live autopilots. Claude models have rarely been the decision model in live SimianX autopilots: 40 closed positions since March 4, 2026, mostly Claude Haiku 4.5 that month, with 20 wins and 20 losses and an average of −0.02R. Across all decision models, live autopilots closed 5,486 positions between January 22 and November 19, 2026, with a 55.6% win rate and +0.02R. Forty trades are far too few to read anything into.
Current standings. On the public AI model leaderboard (as of November 19, 2026; 39 ranked models, ranked by average R with at least 20 closed trades), Claude Sonnet 5.5 is #10 (46.0% win rate, +0.08R, 645 trades), Claude Opus 5.5 is #12 (45.1%, +0.06R, 669 trades) and the retired Claude Haiku 4.5 is #34 (52.4%, −0.01R, 194 trades). The board also counts live positions where a model filled any analysis seat, which is why its trade counts differ slightly from the arena-only figures above. For the full model-by-model comparison, see which AI model trades crypto best.
None of this says much about ANT stock. Anthropic's revenue comes from enterprises and developers paying for Claude, not from how Claude trades crypto. It does say that a frontier model is not automatically a frontier trader: on our data, the edge, where it exists, is small and sits with other models.
What to Watch Next for ANT
- November 20, 2026 (done): the IPO and the $26.0 billion Class N private placement closed, and the underwriters exercised their option on 147 million more shares in full.
- Stabilization: the prospectus lets Morgan Stanley, as stabilization agent, buy shares in the market to support the price, but it is not required to and may stop at any time.
- Around December 14, 2026: research from the 22 underwriting banks. After Arm's 2023 IPO, the banks' coverage began 25 days after the debut; the same gap here points to mid-December.
- December 15, 2026: the first scheduled unlock tranche after day one (up to 299 million shares).
- First quarterly report as a public company: full-year 2026 results, date not yet announced. The second full trading day after that release unlocks up to 1.7 billion shares.
- Index eligibility: the S&P 500 requires positive GAAP earnings over the latest four quarters combined and in the latest quarter (S&P methodology). With large reported net losses, ANT does not meet that test yet, so S&P 500 buying is not a near-term factor.
- May 17, 2027 at the latest: the 180-day mark, tied to the largest single unlock (up to 3.0 billion shares).
You can follow ANT's chart and news as they happen in a live AI stock analysis session, or run the same 8-agent research committee on any US stock.
Frequently Asked Questions
What did ANT stock close at on its first day?
ANT closed at $97.17 on November 19, 2026, 17.1% above its $83.00 IPO price, after opening at $111.50 and trading between $92.72 and $115.10. About 829 million shares changed hands (Cboe official figures).
What did ANT stock close at on its second day?
ANT closed at $88.91 on November 20, 2026, down 8.5% from its $97.17 first close and 7.1% above its $83.00 IPO price, after opening at $89.86 and trading between $83.05 and $92.56 (Yahoo Finance daily bar, cross-checked with Stock Analysis).
What is Anthropic's market cap after the IPO?
About $1.28 trillion at the first close on roughly 13.20 billion Class A and Class N shares (a SimianX estimate from the S-1 share count adjusted for the final deal), or about $1.76 trillion fully diluted. At the November 20 close of $88.91 it was about $1.19 trillion basic, on about 13.35 billion shares including the 147 million option shares, and about $1.61 trillion fully diluted.
Is ANT stock a buy?
SimianX does not give buy or sell advice. As research output, SimianX's 8-agent committee rated ANT Hold (confidence 78/100) after the November 19 close, with no entry, stop or target: on day-one data it saw no confirmed trade signal either way. Hold here means no trade signal yet, not a recommendation to own the stock. Its four analysts were neutral, its bear researcher (61/100 conviction) outweighed the bull researcher (25/100), and the levels it would watch are the day-one low of $92.72 and the opening print of $111.50. The case for and against, and the risks, are set out above.
When does the ANT lock-up expire?
There is no single date. Under the schedule in S-1 Amendment No. 2, insider shares unlock in tranches: up to 316 million from the first trading day, further tranches from December 15, 2026, up to 1.7 billion after the full-year 2026 results, and the largest release, up to 3.0 billion, after the Q1 2027 results or on May 17, 2027 (day 180), whichever comes first. The last lock-up release is tied to the Q3 2027 results or November 18, 2027.
What is Anthropic's run-rate revenue?
About $81 billion as of October 31, 2026, up $10 billion from September 30, according to the prospectus. Run-rate is the last 28 days of usage fees multiplied by 13 plus monthly subscriptions multiplied by 12; it is a snapshot, not a forecast or GAAP revenue. Reported GAAP revenue was $33.2 billion for the first nine months of 2026.
What is Claude's win rate in AI trading?
In the SimianX crypto arena, Claude Opus 5.5 won 45.4% of 663 trades (+0.06R average) and Claude Sonnet 5.5 won 46.0% of 645 trades (+0.08R) between late September and November 19, 2026. On the 477 moments every model traded, they ranked 6th and 7th of 16 by average R, slightly above the 44.1% / +0.074R average, but the difference is not statistically meaningful.
How does the SimianX 8-agent committee work?
Four analysts (fundamentals, technical/market, news and positioning) each write a report from the data available at the chosen moment. A bull researcher and a bear researcher argue the case over several questions chaired by a research manager, the members vote, and a risk manager writes the final rating with an entry, stop and target for the chosen horizon. You can run it on any US stock.
Methodology and Sources
- Committee run: one run of the SimianX deep analysis committee on ANT, started at 1:01 p.m. PT on November 19, 2026, after the close, with every data source cut off at that day's close. Eight agents (fundamentals, technical/market, news and positioning analysts; bull and bear researchers; a research manager; a risk manager) on SimianX's default model, swing horizon (the next 2 to 8 weeks). Seven seats completed first; the risk manager's rating call hit a model rate limit at 1:04 p.m. PT and the run stopped. The rating step was then completed once at 2:49 p.m. PT on the same data cutoff (Hold, 78/100). Committee output is model research: a rerun on the same data can come out differently, and past committee plans have not been shown to beat the market.
- Prices: ANT's first-day open, high, low, close and regular-session volume are the official figures from Cboe's delayed quote (fetched at 1:21 p.m. PT), cross-checked with Stock Analysis and with SimianX's own market-data feed, which showed the same $97.17 close. Percentages are against the $83.00 IPO price. November 20 prices are the Yahoo Finance daily bar for the regular session, cross-checked with Stock Analysis; Cboe's delayed quote, used for day one, could not be retrieved that day.
- Share count and market value: about 13.20 billion Class A and Class N shares after the offering and the private placement. This is a SimianX estimate: 13,086,672,593 shares in S-1 Amendment No. 2 at the $74 midpoint, plus the 155 million extra primary shares in the upsized deal, minus 38 million fewer placement shares at $83 (313,253,007 instead of 351,351,348). It excludes the underwriters' option and unvested equity awards. CNBC put the fully diluted value at about $1.5 trillion at the IPO price. Day-two figures add the 147,000,000 shares Anthropic sold when the underwriters exercised their option in full at the November 20 closing (Anthropic's closing announcement), for about 13.35 billion; day-one figures use the count before the option.
- Claude trading data: read-only queries of SimianX's production database on November 19, 2026. Arena trades counted exactly as the public leaderboard counts them (closed, on the board, opened on or after each model's release date, no pre-release backfills). Paired comparisons match trades by the same decision moment; confidence intervals come from a bootstrap clustered by session. Leaderboard standings were read on the public page the same day.
- Mega-IPO comparisons: first-day closes against IPO prices as reported at the time by the outlets linked below.
This article is research and education, not investment advice. SimianX does not recommend buying or selling ANT or any other security. AI committee ratings and trading results are model outputs, can be wrong, and past results do not predict future returns.
References
- SEC EDGAR — Anthropic, PBC filing index (CIK 2130357)
- SEC EDGAR — Anthropic, PBC S-1 Amendment No. 2 (November 10, 2026)
- SEC EDGAR — Anthropic, PBC final prospectus, Rule 424(b)(4) (November 19, 2026)
- SEC EDGAR — Anthropic, PBC pricing free writing prospectus (November 18, 2026)
- Anthropic — Anthropic prices initial public offering (November 18, 2026)
- Anthropic — Closing of the initial public offering, including full exercise of the underwriters' option (November 20, 2026)
- CNBC — Anthropic IPO raises over $81 billion in largest offering on record (November 18, 2026)
- NPR — SpaceX IPO makes history as largest ever, stock gains 19% on first day (June 12, 2026)
- Fortune — Alibaba shares surge in trading debut (September 19, 2014)
- Fortune — Saudi Aramco shares soar in debut (December 11, 2019)
- Fast Company — Arm's stock jumps in its first day of trading (September 14, 2023)
- The Christian Science Monitor — Facebook IPO fizzles (May 18, 2012)
- TechCrunch — Uber's first day as a public company (May 10, 2019)
- Yahoo Finance (Reuters) — Arm's IPO banks weigh in with ratings (October 9, 2023)
- SimianX — AI model crypto leaderboard
Related Reading
- Anthropic IPO: ANT Retests Its $83 IPO Price on Day 2
- S&P 500 Correction 2026: Every 10% Drop Since 1950
- Anthropic Cash Burn and Revenue: $80.7B Loss Explained
- Best AI Model for Crypto Trading in 2026: 30+ LLMs Ranked
- What Are AI Agents? How Multi-Agent AI Systems Work
- Micron Anthropic Deal: Terms, Status, Anthropic's AI Deals
- AKAM Stock: $11.6B Anthropic Deal and Revenue by Segment