
 By Muke
Anthropic's S-1: Revenue, Cash Flow and the Compute Bill
Quick answer: Anthropic reported an $80.748 billion net loss in the first half of 2026, but its operations generated $3.929 billion of cash. Deducting $482 million of cash equipment purchases gives $3.447 billion of free cash flow under the definition used here. Two noncash financing adjustments totaled $81.108 billion. That explains the headline loss; it does not settle the investment case. The harder test is whether customer cash receipts can keep pace with new compute payments and dilution.
Updated October 26, 2026 (U.S. Pacific). Source: Anthropic's first public Form S-1, filed October 26. Annual financial statements are audited; interim figures are unaudited. Dollar amounts are U.S. dollars. Calculations, scenarios and our assessments are identified below.
Anthropic cash burn, revenue and profitability answer different questions. Revenue reached $16.286 billion in six months, Q2 produced the first operating profit in the periods disclosed, and the company held $131.651 billion of cash and short-term investments at June 30. At the same time, management expects its infrastructure expansion to consume significant operating and investing cash for the foreseeable future.
Our assessment: the filing shows a real improvement in operating economics, with a financing structure and infrastructure program that can absorb much of that improvement. A rising private valuation created accounting losses; positive current cash flow cannot be assumed to fund the next buildout. Investors need a bridge between those two facts, followed by a schedule of future payments and shares issued.
Anthropic Financials at a Glance
| Question | Answer from the October 26 S-1 |
|---|---|
| How much revenue did Anthropic make? | $16.286B in H1 2026, versus $1.163B in H1 2025: approximately 1,300% growth |
| Was Anthropic profitable? | H1 operating loss of $693M and net loss of $80.748B; Q2 operating income of $974M |
| How much operating cash did it burn? | None on a net basis in H1 2026; operating cash inflow was $3.929B |
| Was free cash flow positive? | $3.447B, calculated as operating cash flow minus $482M of cash equipment purchases |
| How much liquidity did it have? | $112.389B cash and equivalents plus $19.262B short-term investments at June 30 |
| Is ANT trading? | Not under this preliminary filing. ANT is the proposed Nasdaq symbol; price, share count and proceeds remain blank |
| What is the central financial risk? | Usage-driven customer receipts must fund multiyear compute obligations as upfront investment increases |
The SEC filing index confirms the October 26 filing. The prospectus is preliminary: an S-1 is a registration step, not a completed IPO or a tradable stock. For listing dates and the separate OpenAI process, see our Anthropic and OpenAI IPO tracker. This article focuses on the financial statements, cash conversion and funding requirements.
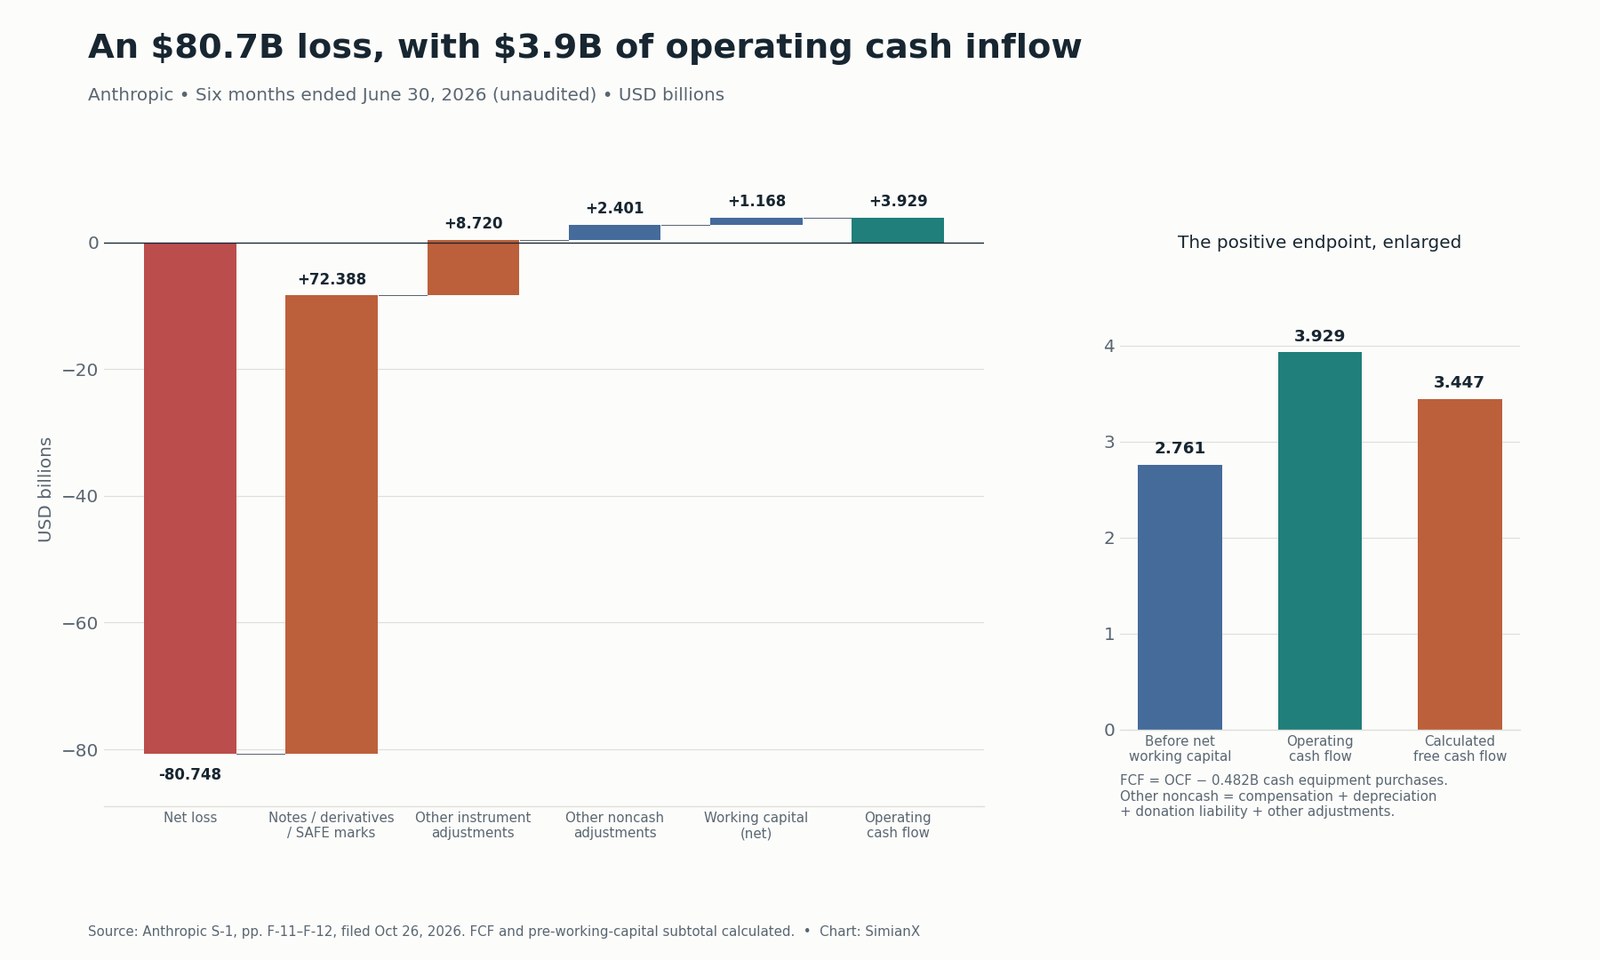
Why Did Anthropic Lose $80.7 Billion?
The largest charge was $72.388 billion from changes in the fair value of convertible notes, derivative liabilities and SAFEs, agreements for future equity. A second $8.720 billion adjustment involved recognition and fair-value changes in other financial instruments. Together, they exceed the reported net loss.
That happens because a financing claim can become more valuable as the company becomes more valuable. From the holder's perspective, that is an increase in the value of an asset. For Anthropic, remeasuring the corresponding obligation creates an expense. It does not require an equal cash payment during the period.
This is more concrete than a generic explanation of convertible debt. At June 30, the outstanding notes consisted entirely of Amazon notes with approximately $6.2 billion of principal, carried at $108.566 billion of fair value. The carrying value is an accounting valuation of the claim, not a statement that $108.566 billion of principal must immediately be repaid. The relevant conversion provisions and eventual share issuance determine the shareholder effect. The filing expects outstanding notes to convert in connection with the offering, while leaving important pro forma share figures blank.
The June quarter alone included a $59.597 billion financing fair-value charge. That quarter also contained the Series H round announced by Anthropic: $65 billion raised at a $965 billion post-money valuation on May 28. A financing announcement, the value assigned to a security and cash received during an accounting period have different scopes; they should not be treated as interchangeable totals.
Noncash does not mean costless. Financing can conserve cash today while giving another investor a larger claim on future value. The appropriate response to the loss is to examine cash flow and dilution together, not to dismiss either the financial statements or the financing terms. Sources: S-1 income statement, non-GAAP reconciliation and note disclosures, MD&A pp. 147–157 and 164–167; Notes 9 and 16.
The Full Bridge: Net Loss to Operating Cash Flow
Subtracting only $72.388 billion from the $80.748 billion loss leaves $8.360 billion. That remainder is not cash burn. It misses the second financial-instrument adjustment, compensation and other noncash items, and changes in operating assets and liabilities.
The following reproduces every reconciling line in the H1 2026 cash-flow statement. Amounts are USD millions; positive adjustments increase cash flow relative to net loss.
| Cash-flow reconciliation | H1 2026 |
|---|---|
| GAAP net loss | −80,748 |
| Stock-based compensation | +2,185 |
| Depreciation and amortization | +97 |
| Fair-value changes: convertible notes, derivatives and SAFEs | +72,388 |
| Donation matching program liability | +126 |
| Recognition and fair-value changes: other financial instruments | +8,720 |
| Other noncash adjustments | −7 |
| Accounts receivable | −4,982 |
| Prepaid expenses and other assets | +2,094 |
| Accounts payable, accrued expenses and other liabilities | +2,679 |
| Lease liabilities | −3 |
| Deferred revenue | +1,380 |
| Net cash provided by operating activities | +3,929 |
| Cash purchases of property and equipment | −482 |
| Free cash flow, calculated here | +3,447 |
Source: S-1 consolidated cash-flow statement, pp. F-11–F-12. The bridge sums exactly. −80,748 + 81,108 = +360 is only an intermediate subtotal after the two financing adjustments; it is neither operating profit nor operating cash flow. Anthropic's separate adjusted-net-income measure was $2.671 billion, after additional specified exclusions, and is also different from cash flow.
Free cash flow here means operating cash flow minus cash purchases of property and equipment. It is our calculation, not a claim that $3.447 billion was available for distribution to shareholders after all acquisitions, financing payments, leased equipment, restricted collateral and future commitments.
Did Working Capital Make Cash Flow Look Better?
Yes, but it did not account for the entire positive result. The five operating-asset and liability movements in the bridge contributed a net $1.168 billion. Before those movements, operating cash flow would have been $2.761 billion. This is a timing sensitivity, not a second reported cash-flow measure.
Each component needs its own explanation:
- Prepayments and other assets: +$2.094B. Cash can have been paid in an earlier period for services consumed now. A reduction supports current cash flow; future replenishment can reverse that benefit. The filing combines prepayments with other assets, so the entire line should not be described as prepaid compute consumption.
- Payables and accruals: +$2.679B. Expenses recognized before payment support cash flow today. Those liabilities still have to be settled. The line includes multiple obligations, not just cloud invoices.
- Deferred revenue: +$1.380B. Advance customer payments bring in cash before service is fully delivered. This helps fund operations, while creating future delivery obligations.
- Receivables: −$4.982B. Recognized revenue grew ahead of cash collection. Rapid growth can explain a large increase; slower collections would weaken the cash-conversion case. Review aging and cloud-marketplace remittances before judging it.
- Lease liabilities: −$3M. This completes the reported operating-asset and liability bridge; it is small in this period.
Our conclusion is narrower than either extreme: H1 cash generation survives removing the net timing benefit, but its quality still depends on collections and the next payment cycle. A financing-driven loss is a poor runway denominator, and one period of favorable working capital is a poor permanent cash-margin assumption.
Anthropic Revenue and Profitability by Quarter
The operating trend is stronger evidence than the net-loss headline. From Q1 2025 to Q2 2026, revenue rose from $376 million to $11.555 billion. Compute and infrastructure expense grew too, but fell sharply as a percentage of sales.
| Quarter | Revenue, USD M | Compute and infrastructure, USD M | Compute / revenue, calculated | GAAP operating income / loss, USD M |
|---|---|---|---|---|
| Q1 2025 | 376 | 944 | 251.1% | −935 |
| Q2 2025 | 787 | 1,390 | 176.6% | −1,200 |
| Q3 2025 | 1,382 | 2,047 | 148.1% | −3,089 |
| Q4 2025 | 2,040 | 2,945 | 144.4% | −2,836 |
| Q1 2026 | 4,731 | 3,387 | 71.6% | −1,667 |
| Q2 2026 | 11,555 | 5,558 | 48.1% | +974 |
Source: S-1 quarterly statements and MD&A, pp. 157–159. Figures are unaudited. Q3 2025 includes a $1.5 billion Bartz settlement expense. Q2 2026's operating margin was 8.4% by calculation; its adjusted operating margin was approximately 19%, after specified exclusions.
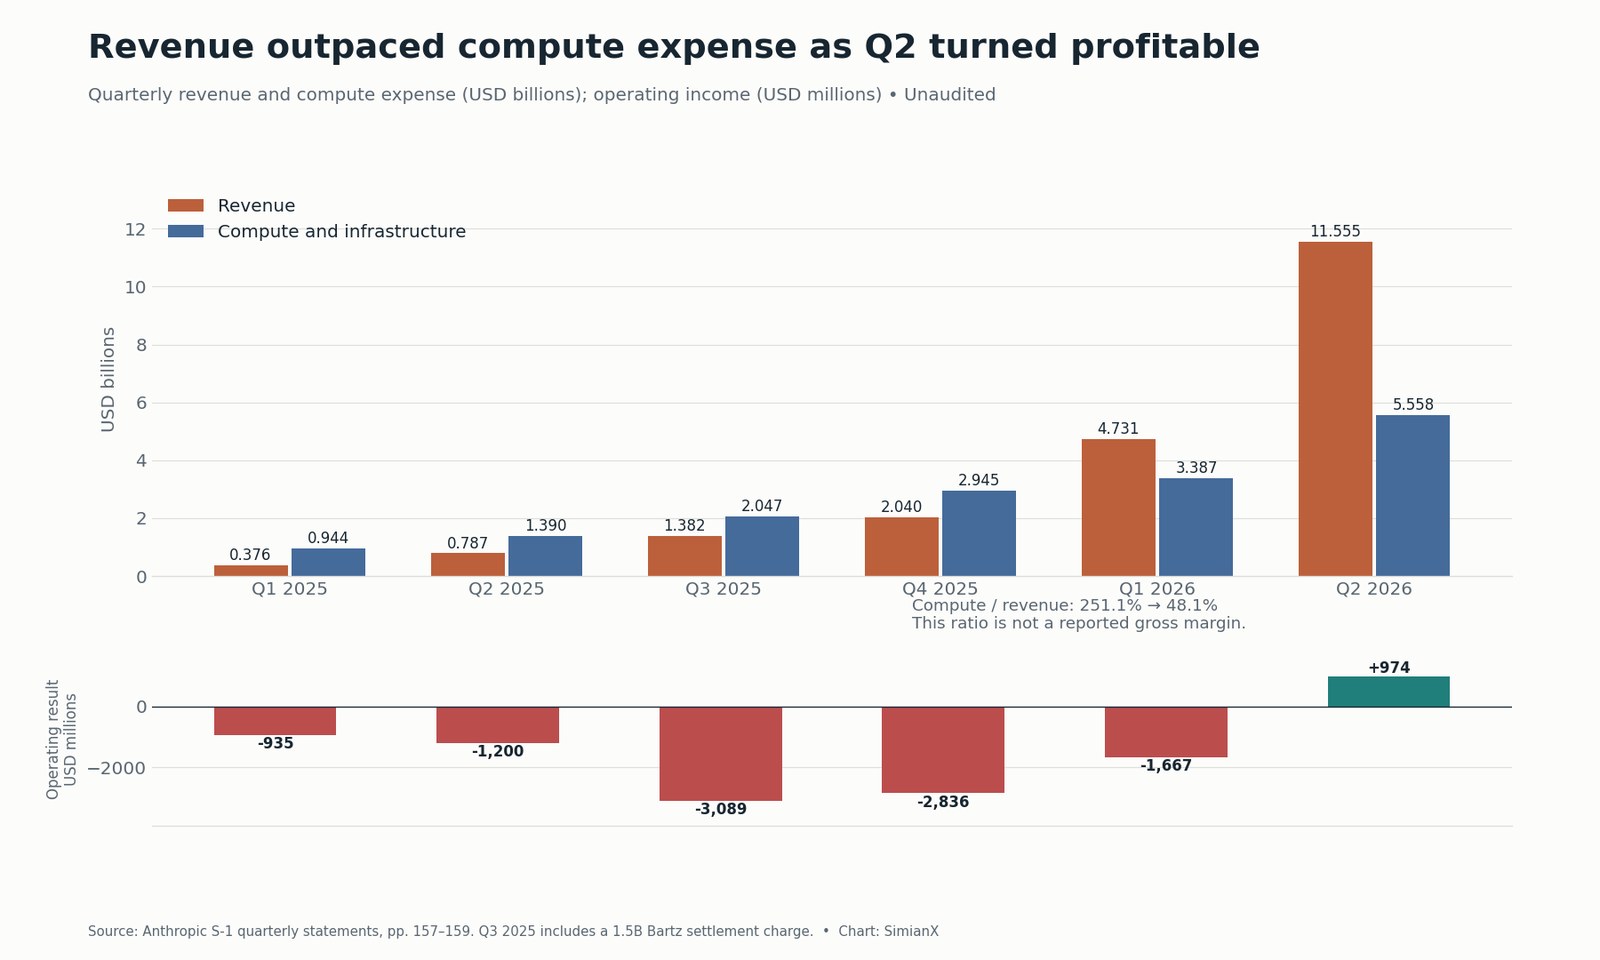
The positive argument is specific: Q2 revenue grew approximately 144% sequentially, versus approximately 64% growth in compute expense. That widening gap helped produce an operating profit even as absolute spending rose. It is evidence of operating leverage, not merely an adjusted-profit presentation.
The limit is equally specific. Management expects greater near-term use of more expensive short-term compute and warns of margin compression. New blocks of dedicated capacity can also begin costing money before utilization catches up. Extending Q2's margin in a straight line would ignore the company's own warning.
The H1 compute-expense ratio was 54.9%, leaving 45.1% of revenue before personnel, sales and partner fees, administration and other costs. That 45.1% is not a reported gross margin. Anthropic's compute category supports research, model development, customer serving and internal usage; this presentation does not supply a conventional inference-only gross margin.
Distribution also matters. Approximately 48% of H1 revenue came through cloud service providers. Anthropic reports these customer sales gross because it is the principal, while partner fees are expensed. Sales, marketing and partnerships expense was $3.168 billion, with much of the increase due to channel fees. A revenue multiple should be compared with peers only after checking whether similar distribution costs are grossed up or netted. See the related economics in our AWS quarterly reference and Alphabet Cloud and capex analysis.
Cash Burn by Year: Compare Matching Periods
| Period | Revenue, USD M | GAAP operating loss, USD M | GAAP net loss, USD M | Operating cash flow, USD M | Cash equipment purchases, USD M | Calculated free cash flow, USD M |
|---|---|---|---|---|---|---|
| FY2023 | 41 | −551 | −1,531 | −1,627 | 2 | −1,629 |
| FY2024 | 386 | −2,980 | −8,309 | −5,692 | 15 | −5,707 |
| FY2025 | 4,585 | −8,060 | −41,965 | −2,637 | 131 | −2,768 |
| H1 2025 | 1,163 | −2,135 | −12,969 | −1,513 | 18 | −1,531 |
| H1 2026 | 16,286 | −693 | −80,748 | +3,929 | 482 | +3,447 |
Source: S-1 annual and interim financial statements, pp. F-7 and F-11–F-12. Compare H1 2026 with H1 2025 when measuring year-over-year interim growth. Comparing a six-month result with a full year does not produce an annual growth rate.
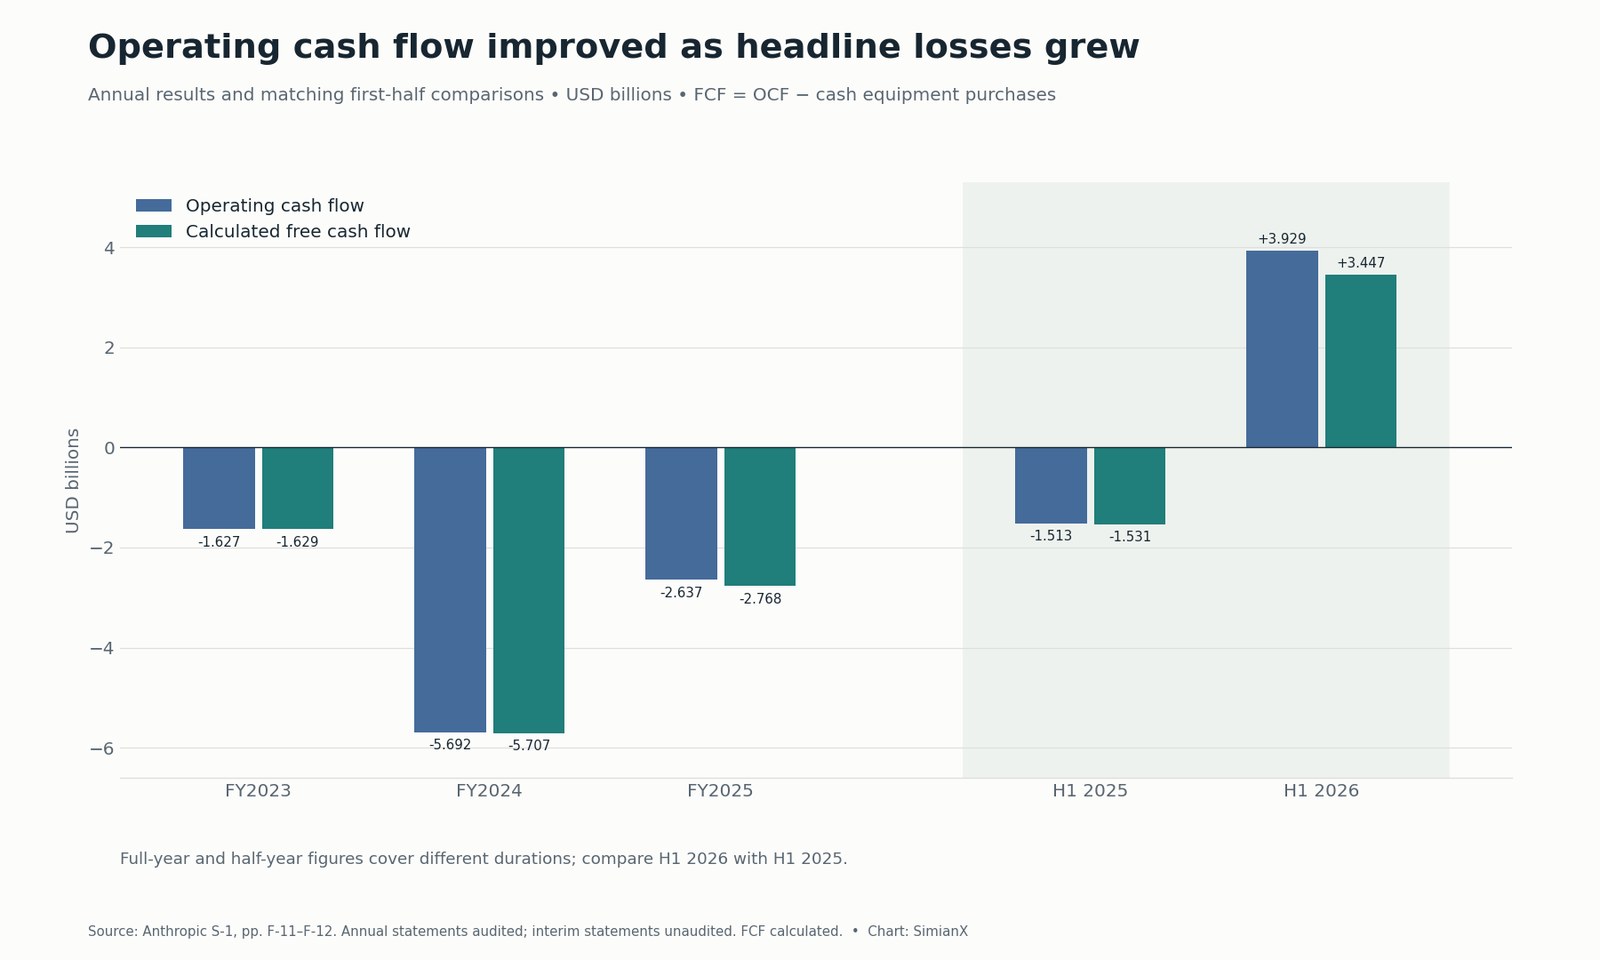
This history strengthens the case for an operating turn: cash flow improved while the financing-driven net loss grew. It also shows why a runway estimate based on the headline loss fails. Cash burn is a flow over a stated period; cash and investments are a balance on a stated date. Neither can be inferred from net loss when large noncash marks dominate.
Where Did the $131.7 Billion of Liquidity Come From?
H1 financing activities supplied $110.774 billion, including $110.432 billion of net preferred-stock proceeds. Operating activities supplied $3.929 billion. The liquidity cushion therefore reflects capital raising far more than accumulated operating cash generation.
Investing activities used $17.181 billion, but only $482 million was cash equipment purchases. The largest components were $18.972 billion of short-term investment purchases, offset by $2.610 billion of sales and maturities; other investing activities used $337 million. Moving money into securities changes the form of liquidity. Calling the entire investing outflow "capex" would misstate the physical investment.
The $131.651 billion combines cash and short-term investments. It excludes $2.529 billion of separately reported restricted cash. A large liquid balance is valuable, but it is not proof that every commitment is funded: payment dates, restrictions, new financing conditions and future customer receipts all matter. Source: S-1 balance sheet and cash-flow statement, pp. F-6 and F-11–F-12.
The Compute Bill: Obligations Are Bigger Than Current Capex
Two June 30 disclosures establish the scale:
| Disclosure at June 30, 2026 | Amount | What the number means |
|---|---|---|
| Fixed or minimum contractual commitments | Approximately $265.6B | Future purchases over one to 20 years; agreements without a determinable minimum are excluded |
| Leases not yet commenced | Approximately $321.4B | Estimated undiscounted future lease obligations; some depend on contractual conditions; commence in 2026–2028 |
| Sum of those two disclosed categories, calculated | Approximately $587.0B | A dated scope comparison, not a current bill or the final all-in compute total |
Sources: S-1 Notes 8 and 13, pp. F-36 and F-59. The initial prospectus leaves its broader September-and-subsequent aggregate committed-spend figure, the amount before 2030 and the next-12-month total blank. A precise near-term funding gap cannot be calculated from those blanks.
The contract descriptions provide more detail, but their dates and scopes differ from the June 30 notes. Read them individually; do not add them to $587 billion.
| Counterparty | Stated amount | Timing and payment terms that affect the risk |
|---|---|---|
| Broadcom TPU equipment leases | Approximately $161.2B of rent excluding interest | Five-year leases for capacity from 2026–2027; not cancelable except on default |
| Google Cloud | At least approximately $114.5B | April 2026–July 2033; minimum payments regardless of usage, with contractual remedies for breach |
| Amazon AWS | At least $110.0B | May 2026–April 2036; minimum payments regardless of usage |
| Microsoft Azure | At least $44.9B | November 2026–May 2033; remedies include uncured breach or undelivered tranches |
| SpaceXAI GPU capacity | Up to $120.5B | Into 2029; 90-day cancellation after initial periods ending in January and March 2027 |
| Nscale GPU capacity | Up to approximately $44.6B | Into 2033; billed as capacity is delivered and accepted; financing and delivery conditions matter |
| Lambda GPU capacity | Approximately $41.3B | Into 2034; billed on acceptance; the $34.9B August agreement has a facility-lease condition |
Source: S-1 contractual obligations, pp. 171–173. These amounts mix minimums, lease rent, ceilings and conditional delivery. Additional TPU capacity estimated at $125–150 billion and AMD systems expected to exceed $20 billion if fully procured are not fixed-dollar commitments in that table.
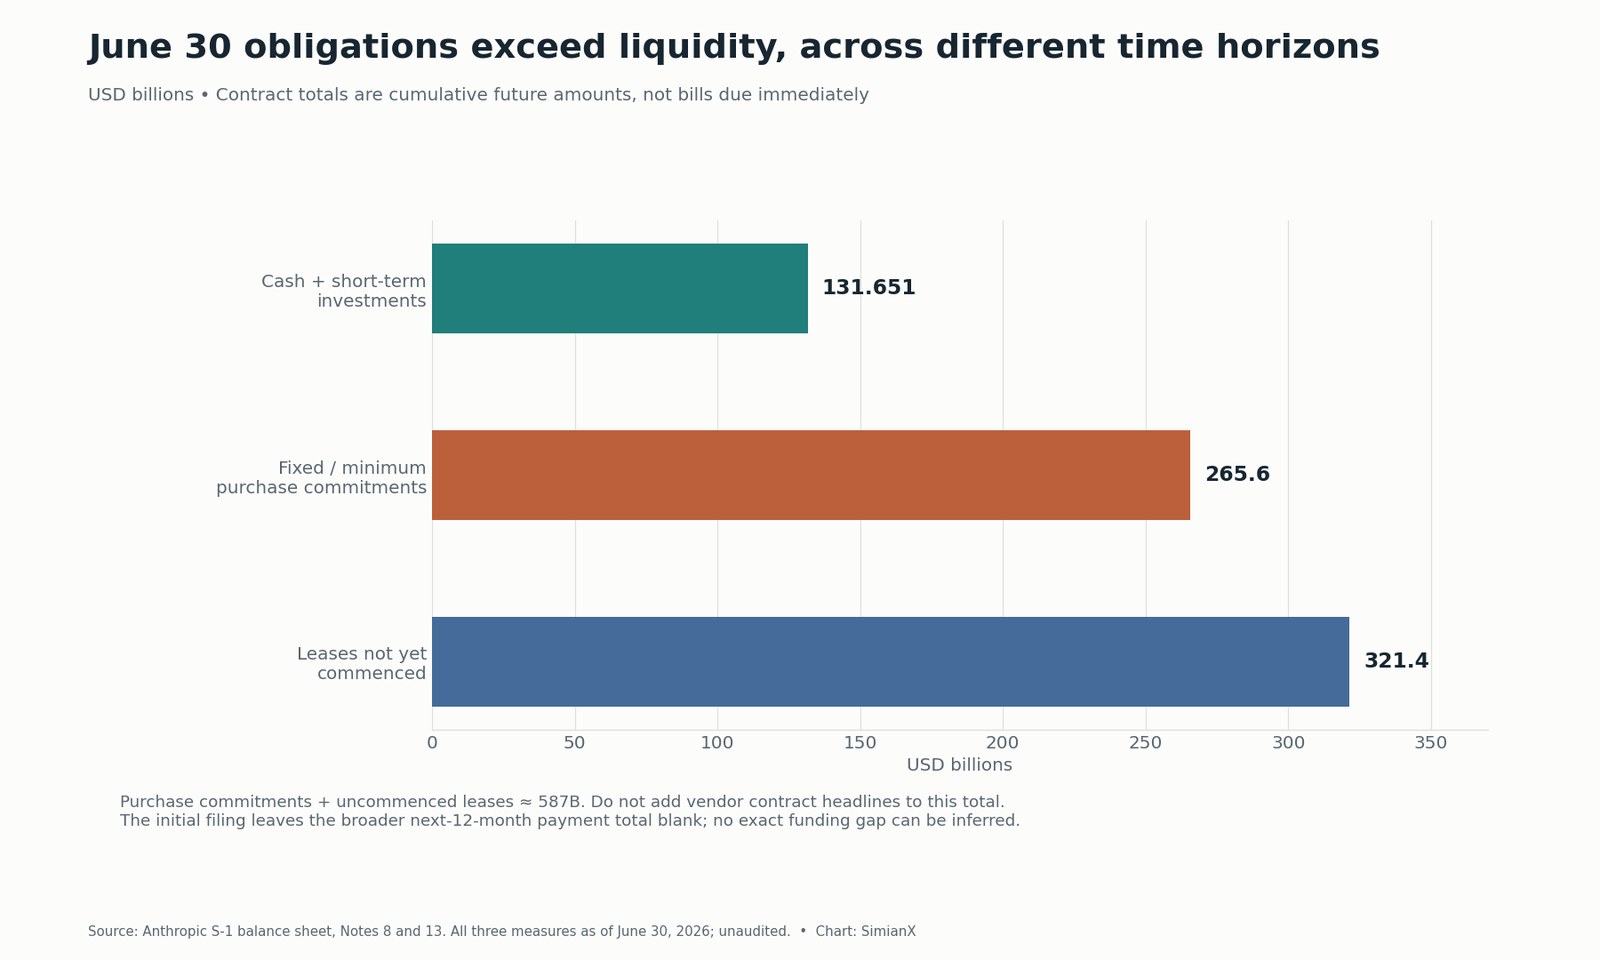
The core risk is a mismatch in duration: much customer revenue is usage based and lacks comparable long-term commitments, while capacity payments extend for years. Demand can adjust faster than the cost base. Conversely, securing capacity early can enable growth that a compute-constrained business would otherwise lose. Utilization, pricing and cancellation rights decide which effect dominates.
Supplier funding cushions the timing but does not erase the cost. The June 30 note arrangements provided up to $77 billion of potential financing, subject to conditions: Google $20 billion, Amazon $15 billion and Broadcom $42 billion, the last specifically for lease rent. These are not $77 billion of unrestricted cash already in the bank. AMD's separate up-to-$5 billion equity commitment depends on deliveries and deployment. Track cash draws, conversions and shares issued instead of subtracting every announced funding ceiling from every spending headline.
Our Broadcom AI revenue reference, Micron–Anthropic deal analysis and Akamai contract analysis examine the supplier side. A supplier's contracted revenue is the customer's payment obligation; neither automatically establishes profitable utilization.
How Easily Could Free Cash Flow Turn Negative?
Hold H1 operating cash flow constant at $3.929 billion and vary six-month cash equipment purchases:
| Six-month operating cash flow | Six-month cash equipment purchases | Free cash flow under this definition |
|---|---|---|
| $3.929B | $0.482B | +$3.447B |
| $3.929B | $5.000B | −$1.071B |
| $3.929B | $10.000B | −$6.071B |
| $3.929B | $20.000B | −$16.071B |
Only the first row is reported-period data; the others are sensitivities, not forecasts. The cash-equipment breakeven is $3.929 billion under the fixed-OCF assumption. Actual operating cash flow will change with collections, model pricing, usage, payroll and infrastructure costs.
Leasing adds another reason to examine more than conventional capex. Finance-lease principal can appear in financing cash flow, and equipment can arrive through noncash arrangements. A business that rents accelerators may report little upfront equipment capex while owing years of fixed payments. Anthropic's warning about substantial future upfront investment is therefore more relevant to funding than extrapolating the first-half $482 million.
For a listed comparison, see Tesla's free-cash-flow history and CoreWeave's backlog and debt table. Their business models differ; the common question is how investment, contractual receipts and financing fit together.
Stock Compensation: Positive Cash Flow Can Still Dilute Owners
H1 stock-based compensation was $2.185 billion, approximately 13.4% of revenue and 63.4% of the $3.447 billion calculated free cash flow. Subtracting it mechanically would leave $1.262 billion. That is a sensitivity to the economic cost of equity awards, not an additional cash outflow or a reported cash-flow measure.
At June 30, Anthropic disclosed $26.6 billion of unrecognized RSU compensation. If the offering had closed on that date, $2.9 billion would have been recognized cumulatively; the remaining $23.7 billion would be recognized over a weighted-average 2.1 years. The filing also identifies $3.1 billion of unrecognized compensation for other outstanding equity awards. These amounts should not all be treated as an immediate cash bill or an immediate share issuance.
Sources: S-1 stock-based compensation disclosures, pp. 64–65, 174 and Note 10. Effectiveness satisfies the performance condition for a significant portion of RSUs; service conditions, settlement and tax withholding still affect timing.
The shareholder test is cash generation per fully diluted share, after the IPO share issuance, note conversions and employee awards. Basic weighted-average shares in a loss period are not a substitute for a final fully diluted IPO capitalization. Some instruments are excluded from diluted loss-per-share calculations because their effect would be antidilutive. Wait for completed offering terms before claiming a precise post-IPO per-share value.
Does Better Cash Flow Justify a $1.5–2 Trillion Valuation?
The $1.5–2 trillion valuation range is reported context, not a price range in the S-1. AP's filing-day report makes clear that final terms have not been established. Only shares sold by the company bring new cash into its treasury; secondary shares sold by existing holders do not.
Using those hypothetical equity values:
| Revenue base | Revenue denominator, calculated | $1.5T equity value / revenue | $2.0T equity value / revenue |
|---|---|---|---|
| FY2025 actual | $4.585B | 327.2× | 436.2× |
| H1 2026 × 2 | $32.572B | 46.1× | 61.4× |
| Q2 2026 × 4 | $46.220B | 32.5× | 43.3× |
These are equity-value-to-revenue illustrations, not enterprise-value multiples or forecasts. They exclude final IPO proceeds, debt, conversion terms and subsequent balance-sheet changes. The contrast shows how much the conclusion depends on the growth denominator. Annualizing a rapidly growing quarter can help frame expectations, but it does not establish next year's sales.
A second sensitivity makes the eventual cash requirement explicit. At a hypothetical $2 trillion equity value and 40 times sustainable annual free cash flow, the business would need $50 billion of annual FCF. At a 25% FCF margin, that implies $200 billion of annual revenue. Change the multiple, margin or valuation and the requirement changes. This is not a price target; it is a way to test whether the assumed future business matches the price paid today.
The Investment Thesis: What Would Prove or Break It?
| Question | Evidence supporting the positive case | Evidence that would weaken it |
|---|---|---|
| Does operating leverage persist? | Revenue grows faster than delivery and recurring research costs across multiple quarters | Short-term compute and new capacity reverse the margin gain |
| Does revenue become cash? | Receivables are collected and cash generation survives prepayment replenishment | Collection slows or suppliers must be paid ahead of customer receipts |
| Is capacity productive? | New deployments gain profitable utilization before large payments peak | Committed capacity arrives before demand or pricing falls |
| Is financing sustainable? | Conditional funding becomes available when payments fall due | Delivery conditions, collateral or capital-market access restrict funding |
| Does the owner benefit? | Sustainable cash per diluted share grows after conversions and awards | Cash growth is absorbed by dilution or an excessive entry valuation |
The positive case rests on observed operating leverage and demand: Q2 operating profit was real under GAAP, not just the result of removing financing marks. The negative case rests on a different time horizon: multiyear obligations and upfront spending are growing beyond the asset-light cash profile of the reported half.
The decisive evidence will be repeated cash generation after new infrastructure begins to consume cash. Removing an accounting misconception improves the analysis. It cannot answer whether the eventual IPO price leaves an adequate return for the funding, execution and competitive risks.
A Practical Filing-Update Checklist
- Read each S-1 amendment. Replace blank price, proceeds and pro forma capitalization fields with actual terms; separate primary and secondary shares.
- Rebuild the full cash bridge. Reconcile net loss, noncash financing marks, compensation and every working-capital movement.
- Track collections and prepayments. Compare receivable aging, customer advances and supplier payment timing with revenue growth.
- Map payments by date. Separate minimums, ceilings, optional capacity and conditions; remove overlapping contract disclosures.
- Measure returns per share. Incorporate note conversions, employee awards and new financing before evaluating sustainable shareholder cash generation.
SimianX's stock-analysis workflow can organize research across listed cloud providers and infrastructure suppliers. A live analysis session can compare the operating, valuation and risk arguments for a supported ticker. The Amazon CTA on this page is a listed counterparty proxy; buying AMZN does not provide direct ownership of ANT shares or replicate Anthropic's returns.
Frequently Asked Questions
How much cash did Anthropic burn in H1 2026?
On a net operating basis it generated $3.929 billion, rather than consuming cash. After $482 million of cash equipment purchases, free cash flow under the definition used here was positive $3.447 billion. That result does not include all future contractual payments.
Why was Anthropic's net loss $80.7 billion?
The $80.748 billion loss included $72.388 billion of financing fair-value expense and $8.720 billion of other financial-instrument adjustments. These noncash items explain most of the divergence between earnings and cash. Their economic effects can still appear through dilution or settlement terms.
Was the $8.36 billion left after removing the biggest charge cash burn?
No. The second financial-instrument adjustment and the rest of the cash-flow reconciliation must also be included. Only the full bridge reaches the reported $3.929 billion operating cash inflow.
Is Anthropic profitable?
It reported $974 million of GAAP operating income in Q2 2026, but a $693 million operating loss and $80.748 billion net loss for H1. Operating profit, adjusted profit and positive cash flow describe different measures and periods.
How much revenue does Anthropic make?
The S-1 reports $4.585 billion for FY2025 and $16.286 billion for H1 2026, including $11.555 billion in Q2. Multiplying the latest quarter by four gives a $46.220 billion annualized pace, not a reported annual result or forecast.
Are the $587 billion of commitments due immediately?
No. That is the sum of two June 30 disclosures covering future purchases and uncommenced leases over multiple years. Conditions and payment dates matter. The broader next-12-month total is blank in the initial prospectus; contract headline amounts must not be added to the notes again.
Does ANT have an IPO price or confirmed trading date?
The October 26 filing proposes ANT on Nasdaq but leaves the price range and offering share count blank. It does not establish a completed offering. Check the SEC amendments and final prospectus for actual terms.
How This Reference Will Be Updated
The next substantive update should follow an S-1 amendment that supplies offering terms, September financials or the missing payment schedule. We will add the new quarter, reconstruct its cash bridge, revise the commitment map and calculate dilution using the actual capitalization. Calculated FCF will retain the stated definition so readers can compare periods. Scenarios will remain labelled separately from reported results.
Related Reading
- Anthropic IPO Date: S-1 Filed, Ticker ANT; OpenAI IPO 2027
- Amazon AWS Revenue by Quarter: Q2 2026 +37% vs $54B Capex
- Alphabet Q2 2026 Earnings: Capex Guidance, Cloud by Quarter
- Broadcom AI Revenue by Quarter: Why AVGO Fell After Beats
- Micron Anthropic Deal: Terms, Status, Anthropic's AI Deals
- AKAM Stock: $11.6B Anthropic Deal and Revenue by Segment
- CoreWeave Stock 2026: $104B Backlog vs $35B Debt by Quarter
- Tesla Free Cash Flow by Year: Q3 2026's $1.5B vs AI Capex
References
- SEC EDGAR — October 26, 2026 S-1 filing index
- Anthropic Form S-1 — income statements, cash flows, quarterly results and non-GAAP reconciliations
- Anthropic Form S-1 — MD&A contractual obligations, financing agreements and financial-statement Notes 8–10 and 13
- Anthropic — May 28, 2026 Series H funding announcement
- Associated Press — preliminary IPO valuation context and filing-day financial overview