
 By Muke
Caterpillar After Q3 2026: Record Backlog, a 41% Drawdown and the Q4 Math
Quick answer: Caterpillar stock is down because the Q3 2026 report did not raise the outlook it needed to raise. Sales rose 17% to $20.7 billion and backlog hit a record $78.1 billion, but management kept full-year growth at "mid to high teens" and guided Q4 to only "moderate" growth, while tariff recoveries supplied about $0.21 of the $7.20 adjusted EPS. CAT closed at $647.39 on October 29 (−9.25%) and $622.75 on October 30, which is 41.5% below its June 30 closing high of $1,064.90.
The headline "sales up 17%, stock down 9%" makes the reaction look irrational. It looks less so once you add three facts that the headline leaves out. The stock had already lost a third of its value before the report. Reaching the 18% full-year growth analysts wanted would have needed about $21.1 billion of Q4 revenue, and management's language pointed lower. And the EPS beat was smaller than the tariff recovery inside it.
This reference sets out the price record, every earnings-day reaction since 2019, the Q4 arithmetic, the backlog ladder and the valuation at $622.75. Company-reported figures come from Caterpillar's Q3 earnings release, slide deck and earnings call. Our own calculations are labeled as such. Data is as of the October 30, 2026 close.
How Far Has Caterpillar Stock Fallen?
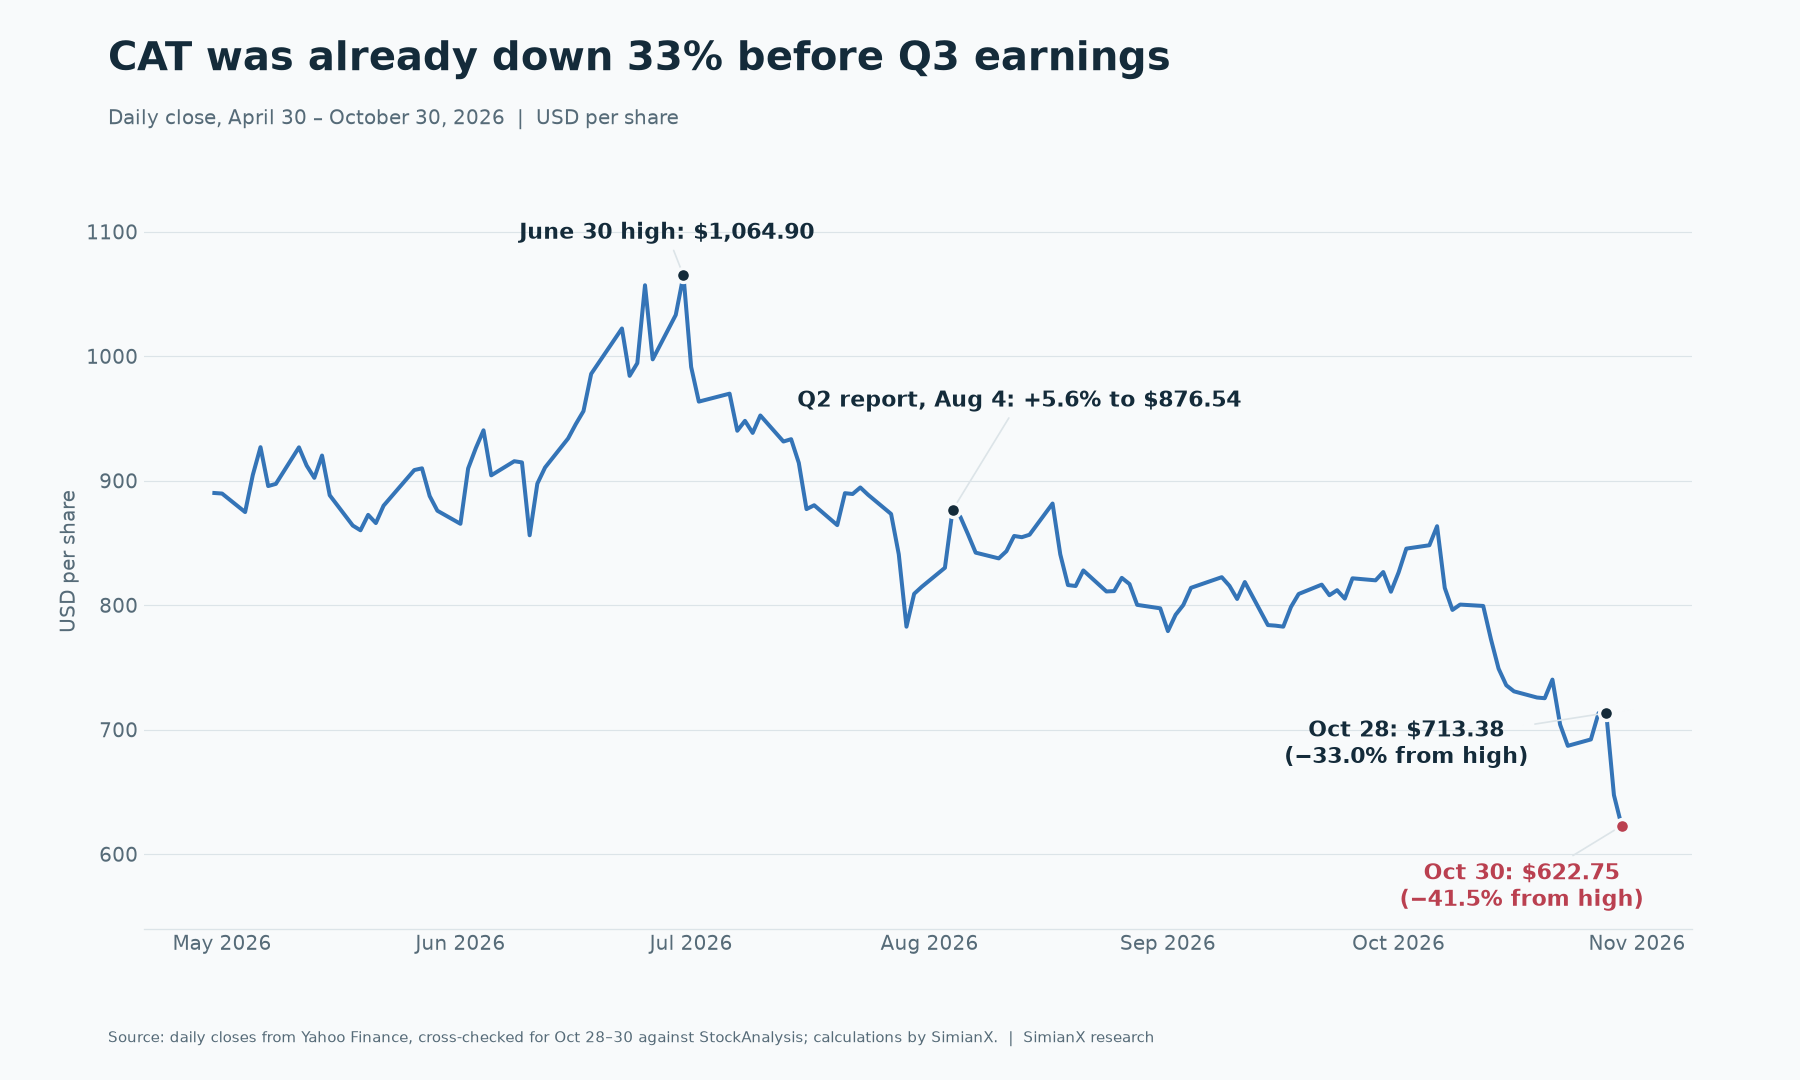
The two-day post-earnings drop was the last stage of a decline that began four months earlier.
| Date | Close | Move | From the June 30 high |
|---|---|---|---|
| June 30, 2026 | $1,064.90 | Closing high in the period | 0.0% |
| August 4, 2026 (Q2 report) | $876.54 | +5.60% on the day | −17.7% |
| October 28, 2026 | $713.38 | Last close before Q3 | −33.0% |
| October 29, 2026 (Q3 report) | $647.39 | −9.25% on the day | −39.2% |
| October 30, 2026 | $622.75 | −3.81% on the day | −41.5% |
The comparison with similar stocks separates what was specific to Caterpillar from what was not.
| Stock | June 30 to Oct 28 | Oct 28 to Oct 30 | June 30 to Oct 30 |
|---|---|---|---|
| Caterpillar (CAT) | −33.0% | −12.7% | −41.5% |
| GE Vernova (GEV) | −25.3% | −2.3% | −27.0% |
| Cummins (CMI) | −25.5% | −5.9% | −29.9% |
| Deere (DE) | +1.0% | +5.4% | +6.5% |
| SPDR S&P 500 ETF (SPY) | +3.4% | −2.1% | +1.2% |
Two different things appear in this table. From June to late October, the stocks most linked to power generation fell together while the broad market rose, so much of that slide belongs to the AI-power trade rather than to Caterpillar alone. That reading is our inference; the price data does not prove the cause. The two days after the report were different. CAT fell far more than GE Vernova and Cummins, and Deere rose, so that part of the move was mostly about Caterpillar's own report. October 30 was also a weak day for the whole market, with SPY down about 1.8%, so not all of that day's 3.81% decline was company-specific.
Every Caterpillar Earnings-Day Reaction Since 2019
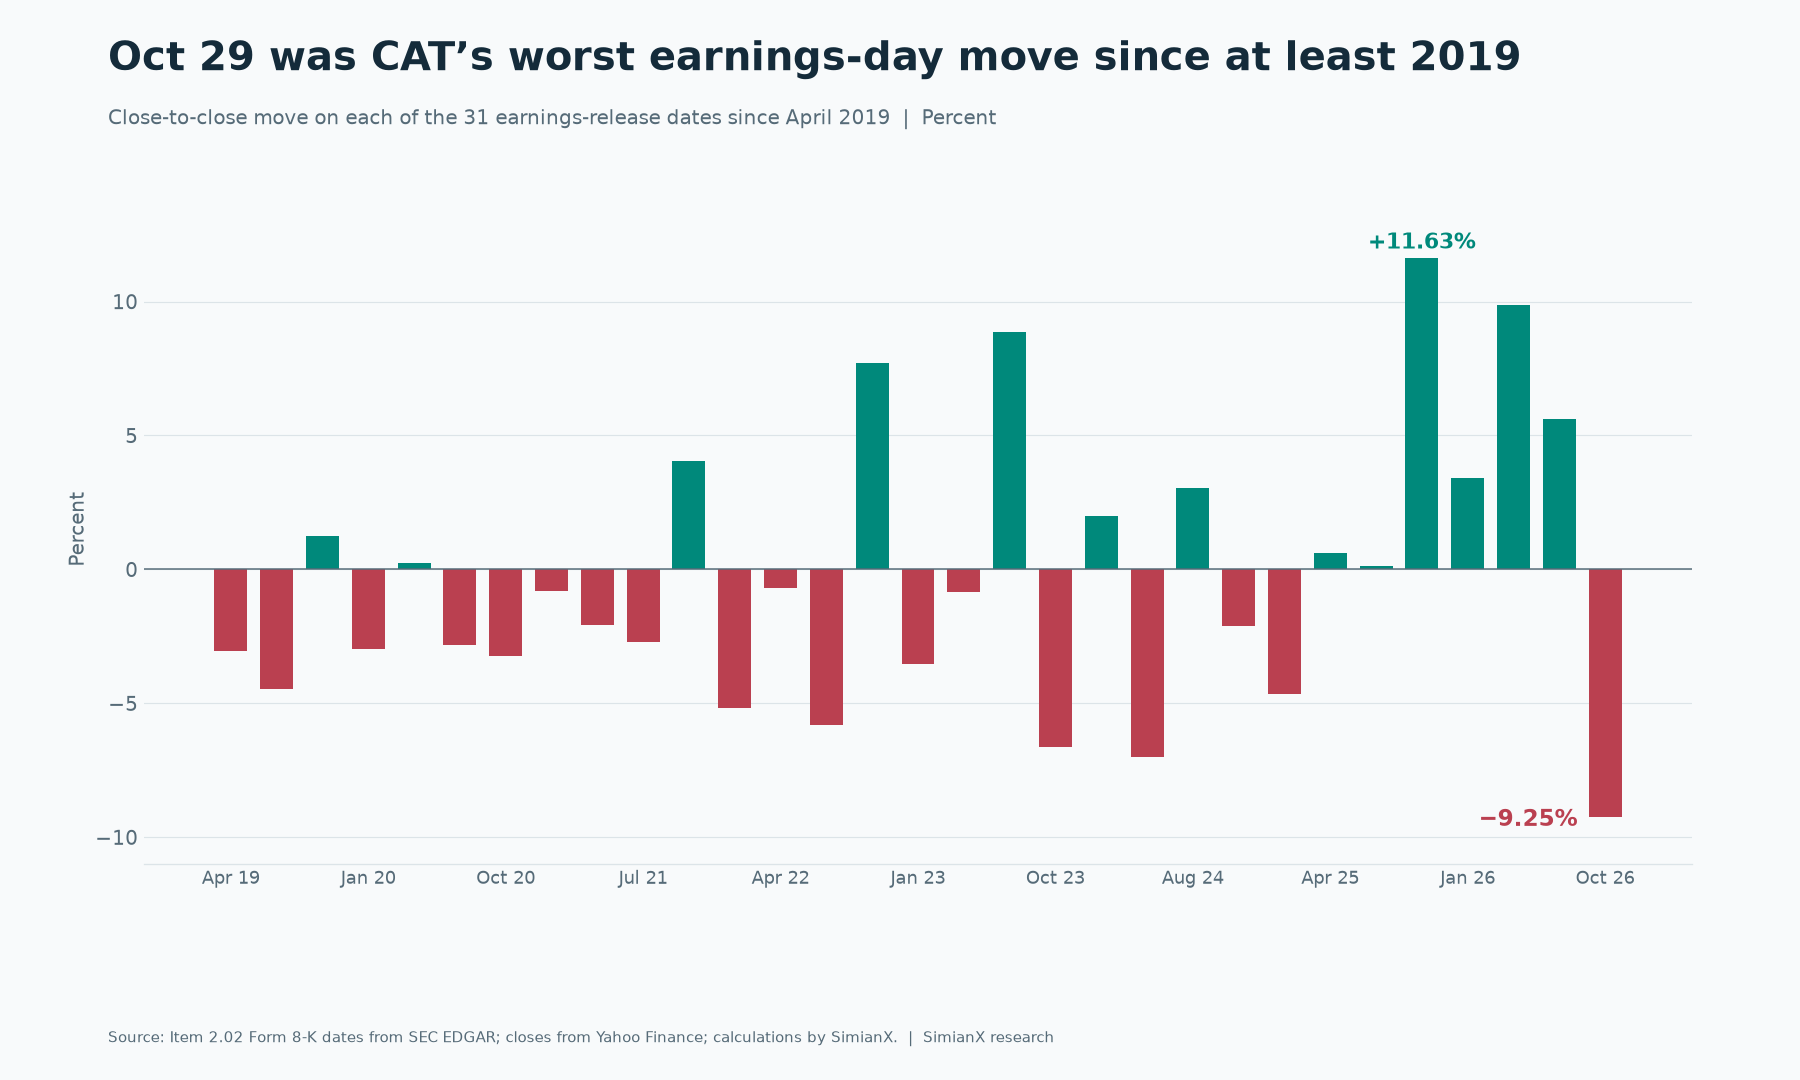
The October 29 move was the largest earnings-day decline in the 31 quarterly reports we measured since April 2019. The previous largest was −7.02% in April 2024.
| Report date | Previous close | Close | Move |
|---|---|---|---|
| Oct 29, 2026 | $713.38 | $647.39 | −9.25% |
| Aug 4, 2026 | $830.03 | $876.54 | +5.60% |
| Apr 30, 2026 | $810.05 | $890.11 | +9.88% |
| Jan 29, 2026 | $643.28 | $665.24 | +3.41% |
| Oct 29, 2025 | $524.47 | $585.49 | +11.63% |
| Aug 5, 2025 | $433.70 | $434.23 | +0.12% |
| Apr 30, 2025 | $307.40 | $309.27 | +0.61% |
| Jan 30, 2025 | $393.23 | $374.98 | −4.64% |
| Oct 30, 2024 | $387.51 | $379.24 | −2.13% |
Across all 31 reports the stock fell on 18 and rose on 13, with an average absolute move of about 4.1%. Before October 29 it had risen on six straight report days, and those gains had taken it from $307 to as much as $1,065. A market used to large beats reacts differently to a modest one.
Dates come from Item 2.02 Form 8-K filings on SEC EDGAR, and we excluded one October 11, 2024 filing that fell outside the quarterly earnings calendar. Caterpillar releases results before the U.S. open, so the same day's close captures the reaction.
What Did Caterpillar Report for Q3 2026?
| Metric | Q3 2026 | Q3 2025 | Change |
|---|---|---|---|
| Sales and revenues | $20.682B | $17.638B | +17% |
| Operating profit | $4.214B | $3.052B | +38% |
| Operating margin | 20.4% | 17.3% | +3.1 points |
| Adjusted operating margin | 20.6% | 17.5% | +3.1 points |
| Profit per share | $7.13 | $4.88 | +46% |
| Adjusted profit per share | $7.20 | $4.95 | +45% |
| MP&E free cash flow | $3.8B | $3.2B | +19% |
| Order backlog | $78.1B | $39.9B | +96% |
The revenue increase came mainly from $2.2 billion of higher sales volume and $663 million of favorable price realization. MP&E means Machinery, Power & Energy, the industrial business excluding the finance arm.
| Segment | Sales | Growth | Segment profit | Margin | Margin in Q3 2025 |
|---|---|---|---|---|---|
| Power & Energy | $8.784B | +18% | $2.143B | 24.4% | 21.9% |
| Construction Industries | $7.983B | +18% | $1.831B | 22.9% | 20.4% |
| Resource Industries | $4.615B | +15% | $622M | 13.5% | 13.6% |
Power Generation is the strongest line inside the largest segment. Its external sales rose 30% to $3.421 billion, driven by turbines and large reciprocating engines, primarily for data centers. Oil and Gas rose 13% and Industrial 4%.
North America provided most of the growth, with revenue up 24% to $12.017 billion. Asia/Pacific was the only region to shrink, down 2%.
Why Did CAT Stock Fall After Strong Results?
Reuters gave the clearest expectations gap: analysts wanted about 18% full-year growth, LSEG's adjusted EPS consensus was $7.08, and J.P. Morgan described $80 billion as the bullish backlog expectation. Against each of those, the report was fine but not enough.
The Q4 math: what 18% growth needed
This is the part most post-earnings summaries skip. Caterpillar's 2025 sales and revenues were $67.589 billion, and the first nine months of 2026 brought $58.640 billion. Q4 2025 was $19.133 billion. Those three figures set what the guidance implies. The table below is our calculation, not company guidance.
| Q4 2026 growth vs Q4 2025 | Implied Q4 revenue | Change from Q3 2026 | Implied full-year growth |
|---|---|---|---|
| +3% | $19.71B | −4.7% | +15.9% |
| +5% | $20.09B | −2.9% | +16.5% |
| +8% | $20.66B | −0.1% | +17.3% |
| +10% | $21.05B | +1.8% | +17.9% |
| +10.4% (needed for 18%) | $21.12B | +2.1% | +18.0% |
Management guided to "moderate" Q4 sales growth, so the 18% that analysts wanted sat at or beyond the top of what that word seems to allow. An analyst on the call pressed the same point, saying that even after adding back the dealer inventory headwind, the guide implied revenue "barely up sequentially". For comparison, Q4 revenue rose from Q3 in each of the past five years, according to Caterpillar's SEC filings.
| Year | Q3 revenue | Q4 revenue | Q3 to Q4 |
|---|---|---|---|
| 2021 | $12.397B | $13.798B | +11.3% |
| 2022 | $14.994B | $16.597B | +10.7% |
| 2023 | $16.810B | $17.070B | +1.5% |
| 2024 | $16.106B | $16.215B | +0.7% |
| 2025 | $17.638B | $19.133B | +8.5% |
Management gave three reasons for the soft Q4:
- A tough comparison. Q4 2025 was a strong quarter.
- Dealer destocking. Construction dealers are expected to cut inventory by about $1.6 billion, compared with $600 million a year earlier. That is roughly a $1 billion headwind to sales volume, and Construction sales are expected to be about flat.
- Capacity. Power & Energy growth is "paced by capacity", so strong orders cannot simply be shipped sooner.
Management also held back on 2027, saying it would discuss the year in January. Investors therefore left the call with a softer Q4 and no new number for next year.
How Much Did Tariff Recoveries Help Earnings?
The company's own slides put the effect of IEEPA (International Emergency Economic Powers Act) tariff recoveries at about $0.21 per share in Q3, from $128 million in operating profit. Adjusted EPS does not exclude them, because the adjustment covers only restructuring costs.
| EPS measure | Q3 2026 | Compared with $7.08 (LSEG) | Compared with $7.03 (S&P) |
|---|---|---|---|
| Adjusted EPS as reported | $7.20 | +$0.12 | +$0.17 |
| Excluding about $0.21 of recoveries | About $6.99 | −$0.09 | −$0.04 |
The S&P figure is as cited by StockStory. We cannot tell how many analysts included recoveries in their estimates, so the second row shows sensitivity. It does not prove a true miss.
Q2 tells the same story at a larger scale. That quarter included $392 million of recoveries, which is about $0.65 per share on our estimate (23% tax rate and about 463 million diluted shares). Adjusted EPS fell from $8.17 in Q2 to $7.20 in Q3. Excluding recoveries, the fall was from about $7.52 to about $6.99.
| Quarter | Adjusted operating profit | Recoveries | Margin as reported | Margin excluding recoveries |
|---|---|---|---|---|
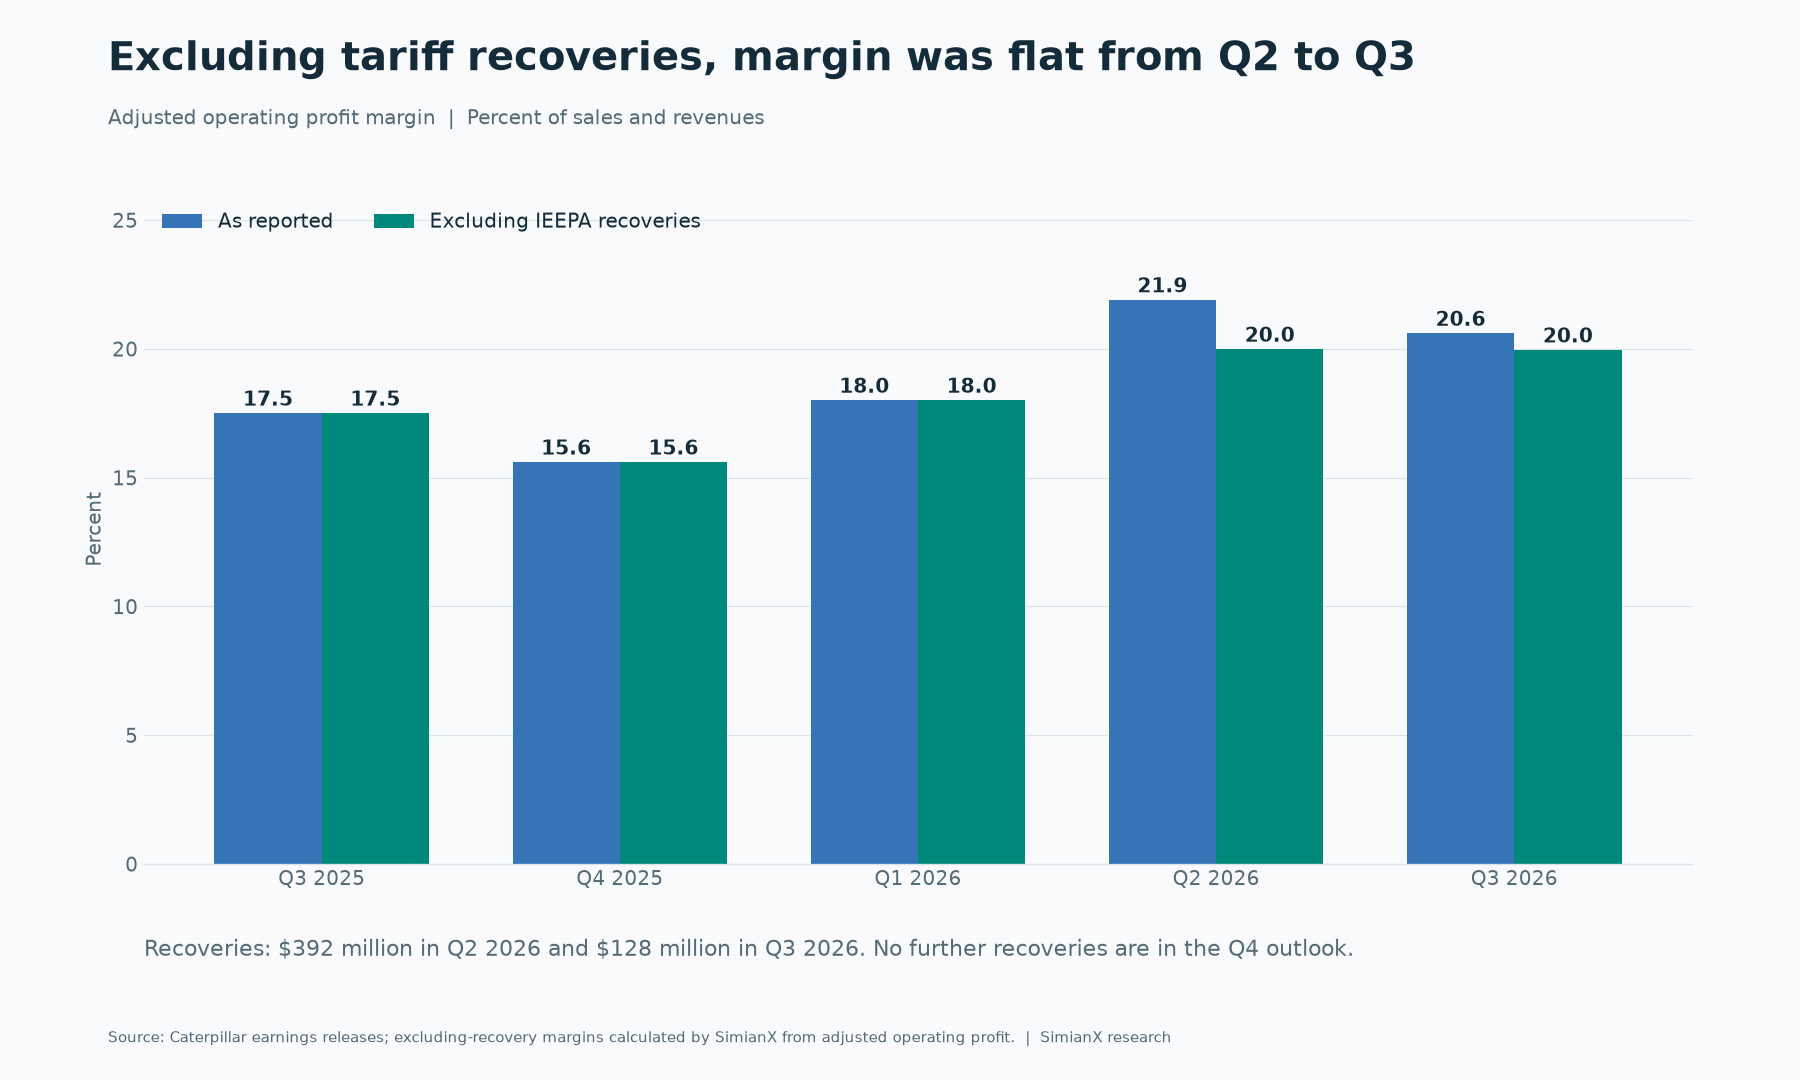
| Q2 2026 | $4.497B | $392M | 21.9% | 20.0% |
| Q3 2026 | $4.255B | $128M | 20.6% | 20.0% |
The year-over-year improvement is real without the recoveries: 20.0% compared with 17.5%. It also did not come from lower tariffs, because Q3 tariff costs of about $600 million were flat from a year earlier. For how these refunds appear across other companies, see our IEEPA tariff refund tracker.
The forward problem is that the recoveries stop while the tariffs do not. Recoveries total about $520 million so far this year and the outlook includes none for Q4, against about $600 million of Q4 tariff costs and about $2.2 billion for the full year. Excluding recoveries, management expects the full-year adjusted margin to be "near the bottom" of its target range. The Investor Day range is 18–22% at $72 billion of revenue and 21–25% at $100 billion, so the floor rises as sales grow. On the call, management said it expects to "start to claw our way off the bottom" of the range as it moves forward, with more detail on 2027 to come.
Is the $78.1 Billion Backlog as Good as It Looks?
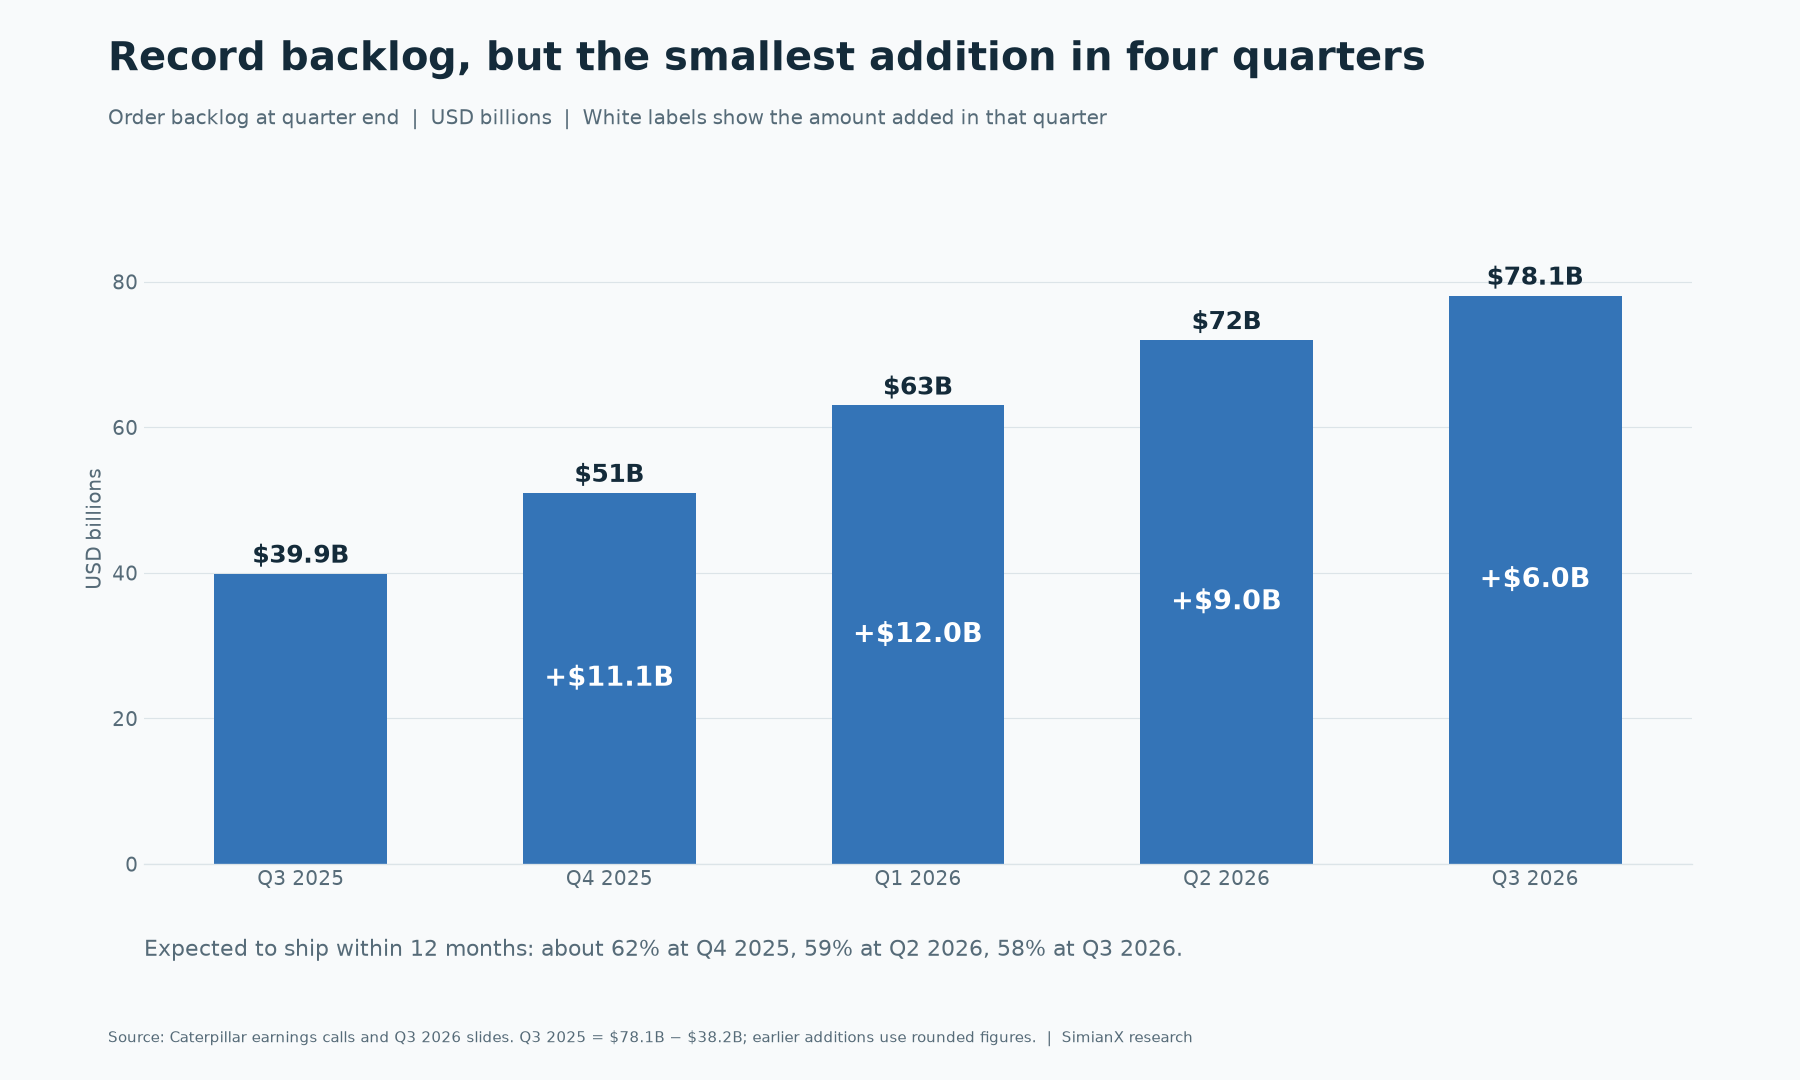
Backlog nearly doubled in a year. It also grew more slowly than in the previous three quarters, and more of it now sits further out.
| Quarter end | Backlog | Added in the quarter | Share expected to ship within 12 months |
|---|---|---|---|
| Q3 2025 | $39.9B | +$2.4B | — |
| Q4 2025 | $51B | About +$11B | About 62% |
| Q1 2026 | $63B | About +$12B | — |
| Q2 2026 | $72B | About +$9B | 59% |
| Q3 2026 | $78.1B | +$6.0B | 58% |
At 58%, about $45 billion should ship within a year and about $33 billion after that (our calculation). Management said large reciprocating engine orders now reach out to 2029 and turbine orders into 2030.
That has three consequences:
- Longer duration. Revenue that arrives in 2029 is worth less today than revenue that arrives next quarter, and its costs are less certain.
- Lumpiness. Management described prime power and mining orders as large, individually negotiated and lumpy. A $6.0 billion quarter does not by itself signal weaker demand, and the same applies to any later quarter that looks strong.
- A gap on contract terms. Caterpillar does not publish cancellation or price-escalation terms for the backlog.
One cash item supports the backlog's quality. Customer advances added $4.0 billion to operating cash flow in the first nine months, compared with $1.6 billion a year earlier. Customers are putting more money down. Over the same period inventories absorbed $4.1 billion, up from $2.0 billion, so customer money is covering much of the inventory build. That is our reading of the cash flow statement, not a company statement.
Are Sales Keeping Up With Real End Demand?
Caterpillar's retail statistics measure sales to end users, while reported sales measure shipments to dealers and others. The two can diverge, and that gap carries useful information. They are compiled on different bases, and Caterpillar calls the retail data an approximate indication, so compare the direction rather than the exact difference.
| Segment | Reported sales growth | Sales to users growth | What it suggests |
|---|---|---|---|
| Power & Energy | +18% | +36% | Demand well ahead of shipments; capacity is the limit |
| Power Generation only | +30% | +75% | The same gap, wider |
| Construction Industries | +18% | +20% | Broadly matched, helped by rental fleets |
| Resource Industries | +15% | +4% | Shipments ahead of end sales |
Two details change how these should be read.
Resource Industries is the weak link. Its 4% was below management's expectations, and mining sales to users fell because of shipping and commissioning delays. The release says sales in Mining, Heavy Construction and Quarry & Aggregates rose primarily because of changes in dealer inventories. Management expects the delayed commissioning to catch up in Q4. Rail sales to users fell 70%, though that line swings widely from quarter to quarter.
Construction had an unusual helper. Dealer rental fleet loading was "exceptionally strong", partly because of the new Major Projects rental venture. Management expects it to contribute less in Q4. North American sales to users rose 27%, and management said growth was strong even without rental fleets, but this is still a tailwind that fades.
How Much of Caterpillar Is an AI Power Stock?
Power Generation's $3.421 billion was about 17% of Q3 sales and revenues (our calculation), though data centers are only part of that line. That matters because a stock can be priced like its fastest-growing 17%. If you want the original bull case, our earlier Caterpillar AI data center power trade piece covers it. Generac's Amazon order shows how the same theme looks at a smaller company.
The dependency runs through customer spending. Caterpillar's data center orders ultimately rest on whether hyperscalers keep building, which is why big tech's AI capex against its cash flow matters here. Projects can also slip because of grid connections, gas supply, permits or financing, even when demand is intact.
Capacity is the second constraint. Caterpillar plans to raise large reciprocating engine capacity to nearly three times the 2024 level by 2030, and will use part of its Winston-Salem, North Carolina plant as a second assembly and test site for 3600 Series engines. Those expansions raise depreciation and manufacturing costs before they raise shipments, and management cited both as margin pressures.
One common confusion: the $1 billion investment in Sanford, North Carolina is for Cat Compact track loaders and telehandlers. It is a Construction Industries project, not a data center one.
2026 capital spending is now expected to be about $3.3 billion, down from the prior $3.5 billion. Free cash flow is still guided to the top half of the $6–15 billion annual range.
What Does Cat Financial Say About Customers?
Customer credit does not show stress, which argues against reading the selloff as a demand scare.
| Cat Financial | Q3 2026 | Comparison |
|---|---|---|
| Past dues | 1.31% | 1.47% a year earlier |
| Net write-offs | $28M | $40M a year earlier |
| Allowance for credit losses | $332M, 0.91% of receivables | $294M, 0.84% at June 30 |
| Retail new business volume | +6% year over year | Per the earnings call |
Management said past dues are the lowest since 1998. The allowance did rise, and the provision for credit losses was $34 million higher than a year earlier, so it is worth watching. Credit is a lagging signal, though: a customer usually delays a purchase long before missing a payment.
Is CAT Stock Cheap at $622.75?
It is cheaper, but not obviously cheap. These are our calculations, using adjusted EPS from the last four reported quarters: $5.16 (Q4 2025), $5.54, $8.17 and $7.20, a total of $26.07.
| Earnings basis | EPS | P/E at $622.75 |
|---|---|---|
| Trailing 12 months, adjusted | $26.07 | 23.9× |
| Same, excluding Q2 and Q3 recoveries (about $0.86) | About $25.21 | 24.7× |
| Next-12-month consensus (S&P, via StockStory) | $30.56 | 20.4× |
At about 461 million diluted shares, $622.75 equals a market value of roughly $287 billion.
The table below shows what different combinations imply. These are hypothetical inputs for testing assumptions, not forecasts or price targets.
| Annual EPS | 18× P/E | 22× P/E | 26× P/E |
|---|---|---|---|
| $25 | $450 | $550 | $650 |
| $30 | $540 | $660 | $780 |
| $35 | $630 | $770 | $910 |
At $622.75, the price sits near $30 of EPS at about 21 times. In other words, the market is still paying for earnings that are not yet in the trailing numbers. The main downside risk is both inputs falling together, which is what happens when a stock priced for structural growth starts being valued as a cyclical manufacturer again. This is a framework, not a recommendation.
For other cases where strong results met a falling stock, compare TSMC's Q3 reaction and Alphabet's cash flow.
What to Watch in Caterpillar's Next Report
Management said it will talk more about 2027 in January. These are the items that would confirm or challenge the current reading.
| Item | Marker from this report | What would change the view |
|---|---|---|
| Q4 revenue | $21.12B needed for 18% full-year growth | Well above "moderate" growth |
| Full-year margin excluding recoveries | Near the bottom of the target range | Any progress off the bottom in the 2027 outlook |
| Construction dealer inventory | About $1.6B reduction in Q4 | A bigger cut, or weaker sales to users |
| Backlog | $78.1B, +$6.0B in Q3 | A second smaller addition, or a share within 12 months below 58% |
| Resource Industries | Sales to users +4% | Delayed commissioning not catching up in Q4 |
| Tariffs | About $600M in Q4 | Any further recoveries or changed rates |
| Customer advances | +$4.0B in nine months | Advances falling while inventories keep rising |
| Cat Financial | Past dues 1.31%, allowance 0.91% | Past dues rising with the allowance |
You can track the stock's fundamentals on the SimianX CAT page, and test your own read in a live analysis session.
FAQ About Caterpillar Stock and Q3 2026 Earnings
Why is Caterpillar stock down?
There are two separate moves. From June 30 to October 28, CAT fell 33%, alongside other power-related stocks, while the broad market rose. It then fell another 12.7% in two days after the Q3 report, because the full-year outlook stayed at mid to high teens, Q4 was guided to moderate growth and the EPS beat was smaller than the tariff recoveries inside it.
What was Caterpillar's Q3 2026 EPS?
Profit per share was $7.13 and adjusted profit per share was $7.20, compared with $4.88 and $4.95 a year earlier. The slides state that both include about $0.21 per share from IEEPA tariff recoveries.
How big is Caterpillar's backlog?
It was a record $78.1 billion at the end of Q3 2026, up $6.0 billion from Q2 and $38.2 billion from a year earlier. Management expects 58% of it to ship within 12 months.
What is Caterpillar's guidance for 2026?
Management expects mid-to-high-teens sales and revenues growth, moderate Q4 sales growth, an adjusted margin near the bottom of its target range excluding recoveries, about $2.2 billion of tariff costs excluding recoveries, MP&E free cash flow in the top half of $6–15 billion and about $3.3 billion of capital spending.
What are IEEPA tariff recoveries?
They are amounts Caterpillar recognized as recoverable on tariffs imposed under the International Emergency Economic Powers Act. It booked $392 million in Q2 and $128 million in Q3, and its Q4 outlook includes no more. See our refund tracker for other companies.
Is Caterpillar an AI stock?
Partly. Power Generation, the line that includes data center demand, was about 17% of Q3 sales and revenues. Most of the business is still construction, mining, oil and gas, industrial and finance.
How far is CAT below its high?
At $622.75 on October 30, 2026, it was 41.5% below its closing high of $1,064.90 on June 30, 2026. That June close is also the highest in the 12 years of daily closes we reviewed.
Conclusion
Caterpillar's Q3 did not show a broken business. Demand, margins and customer credit were all healthy. It did show that growth is limited by capacity, that Q4 will be softer than the backlog suggests, and that recoveries made the quarter look better than the underlying run rate. For a stock that had priced in a faster path, that was enough for the worst earnings-day move in at least seven years.
The next test is January, when the Q4 result and the first detail on 2027 arrive. To check the numbers yourself, start from the sources below, and use SimianX AI to follow how the thesis develops.
Related Reading
- Caterpillar Stock 2026: AI Data Center Power Trade
- IEEPA Tariff Refunds: 78 Stocks That Got Paid and How Much
- AI Capex 2026: Big Tech Now Spends 96% of Its Cash Flow
- Generac-Amazon Deal: $2.4B Order Behind an $8B Headline
- Why TSMC Stock Fell After Q3 2026: Every Earnings Reaction
- Alphabet Free Cash Flow: Q3 2026 Earnings and AI Capex
References
- Caterpillar: Q3 2026 earnings release (SEC Form 8-K, Exhibit 99.1)
- Caterpillar: Q3 2026 retail sales statistics (Exhibit 99.2)
- Caterpillar: Q3 2026 analyst slide deck
- Caterpillar: Q2 2026 earnings release (Exhibit 99.1)
- Caterpillar Q3 2026 earnings call transcript (StockAnalysis)
- Reuters via MarketScreener: Caterpillar third-quarter profit rises on power equipment demand
- StockStory: Caterpillar Q3 2026 and S&P consensus figures
- Caterpillar: $1 billion North Carolina Cat Compact investment
- SEC EDGAR: Caterpillar filings and XBRL financial data
- CAT historical share prices (StockAnalysis)