
 By Marcus Reeve
The Nasdaq's Biggest One-Day Drops Since 1971, Ranked With What Followed
Quick answer: The worst day in Nasdaq Composite history was March 16, 2020, a 12.32% close-to-close fall. The Nasdaq-100's worst was Black Monday, October 19, 1987, at −15.08%. October 30, 2026 is nowhere near either list: the Nasdaq-100 fell 3.46% (rank 247 of 10,350 sessions) and the Composite 2.86% (rank 304 of 14,051). After the Composite's 20 worst days, the index was higher the next session in 14 cases and higher a year later in 13, but all seven that were lower a year later came from the 2000–01 dot-com bust. This is a record of what happened, not a forecast.
Updated October 30, 2026 (U.S. Pacific), after the U.S. close. October 30 figures are same-day closing prints from Yahoo Finance and can be revised by the vendor; everything older comes from settled daily histories.
Nasdaq worst days are the sessions people search for when the tape turns red, and the honest way to read them is with two numbers side by side: how big the drop was, and how the index behaved afterward compared with an ordinary day. This reference does both. It ranks the 20 largest one-day percentage declines in the Nasdaq Composite since 1971 and the 10 largest in the Nasdaq-100 since 1985, names the trigger behind each, and shows the return over the next session, week, month, three months and year.
It is the Nasdaq companion to The 20 Worst Days in S&P 500 History. The two lists overlap less than you might expect, because the Nasdaq has its own disasters. Seven of its 20 worst days belong to the dot-com bust, an episode that does not appear on the S&P 500's list at all. For the longer view, the year-by-year record is in Nasdaq Returns by Year.
Where October 30, 2026 Ranks
October 30 is a large drop by recent standards and a small one by historical standards. Here are the closing figures from Yahoo Finance's daily data and its live market coverage:
- Nasdaq-100: −3.46%, to 28,384.85
- Nasdaq Composite: −2.86%, to 25,437.00
- S&P 500: −1.82%, to 7,580.07
- Dow Jones Industrial Average: −1.09%, to 51,770.31
- PHLX Semiconductor Index: −7.20%, to 10,688.80
Ranked honestly, that means:
- All time: rank 247 of 10,350 sessions for the Nasdaq-100, and rank 304 of 14,051 for the Composite. Each sits in roughly the worst 2% of days, but the 20th-worst day is −7.30% on the Nasdaq-100 and −6.30% on the Composite, more than twice as deep.
- The 3% line: the Nasdaq-100 crossed it and the Composite did not. A headline saying "the Nasdaq fell more than 3%" is true of only one of the two indexes.
- Since January 2023: the ninth-largest of 12 Nasdaq-100 drops of 3% or more, and the 13th-worst day for the Composite.
- In 2026: the second-largest fall of the year on both indexes, after June 5, 2026 (−4.77% and −4.18%).
| Date | Nasdaq-100 | Composite | Trigger | +1 session | +1 week | +1 month | +3 months | +1 year |
|---|---|---|---|---|---|---|---|---|
| July 24, 2024 | −3.65% | −3.64% | Tesla and Alphabet results disappoint | −1.1% | +1.7% | +2.4% | +7.1% | +22.0% |
| September 3, 2024 | −3.15% | −3.26% | Nvidia −9.5%; weak manufacturing data | −0.2% | −0.7% | +4.5% | +11.6% | +23.5% |
| December 18, 2024 | −3.60% | −3.56% | Fed signals fewer 2025 rate cuts | −0.5% | +2.6% | +3.0% | −4.9% | +18.0% |
| March 10, 2025 | −3.81% | −4.00% | Tariff and recession worries | −0.3% | +2.0% | −12.0% | +12.2% | +28.4% |
| April 3, 2025 | −5.41% | −5.97% | "Liberation Day" tariffs | −6.1% | −1.0% | +7.8% | +22.5% | +30.6% |
| April 4, 2025 | −6.07% | −5.82% | China retaliates | +0.2% | +7.4% | +13.8% | +30.5% | +39.1% |
| April 10, 2025 | −4.19% | −4.31% | Tariff whiplash after a record rally | +1.9% | −0.5% | +13.8% | +24.6% | +36.9% |
| April 16, 2025 | −3.04% | −3.07% | Nvidia export curbs; Powell on tariffs | +0.0% | +5.2% | +17.4% | +26.3% | +44.2% |
| October 10, 2025 | −3.49% | −3.56% | Trump threatens more China tariffs | +2.2% | +2.5% | +5.7% | +6.5% | +26.6% |
| June 5, 2026 | −4.77% | −4.18% | Strong jobs report lifts rate-hike fears | +1.6% | +2.3% | +1.0% | +2.0% | Not yet |
| June 23, 2026 | −3.29% | −2.21% | AI spending doubts; rate-hike worries | −0.4% | +3.2% | −3.0% | +4.7% | Not yet |
| October 30, 2026 | −3.46% | −2.86% | Intel outlook; AI spending worries | Not yet | Not yet | Not yet | Not yet | Not yet |
Forward returns are Nasdaq-100 price returns from the drop-day close. "Not yet" means the window has not finished. 2025 was the busiest recent stretch, with six such days, four of them in April's tariff shock.
What drove the day, briefly. Intel closed at $65.76, down 28.58% from $92.07, the largest one-day fall in Yahoo's daily Intel history, which begins in March 1980. The previous record in that history was −26.06% on August 2, 2024, a day Reuters described as Intel's worst since 1974. The 1974 comparison has also been attached to October 30, but we could not confirm it against a final source, so we state only what the data shows. Intel's October 29 earnings release reported third-quarter revenue of $16.5 billion and guided the fourth quarter to $15.0–16.0 billion, with non-GAAP gross margin falling to 38.0% from 44.1% and non-GAAP EPS to $0.25 from $0.52. CFO David Zinsner said: "we see the PC slowdown continuing at least through the first half of next year."
Amazon and Alphabet were part of the story without being the day's largest movers. Yahoo's coverage calls both results "rare earnings misses" and ties the selloff to worries about the cost of the AI boom. Alphabet's big move came a day earlier, at −12.64% on October 29; on October 30 it fell 1.40% and Amazon 1.41%, both less than the Nasdaq-100. The company-by-company scorecard lives in our Magnificent 7 earnings tracker, so we don't repeat it here. Those explanations come from same-day coverage, and no single cause can be proven for a market move.
The 20 Worst Days in the Nasdaq Composite
Ranked by percentage decline in the closing level, since the index began on February 5, 1971. The Nasdaq-100 and S&P 500 columns show the same session for comparison; all 20 rows match the published Wikipedia compilation.
Rows 6 and 7 are effectively tied: one vendor has October 26, 1987 at −9.01%, another at −8.99%. Row 16 uses −7.02%; see Methodology for why one vendor's −7.16% was rejected.
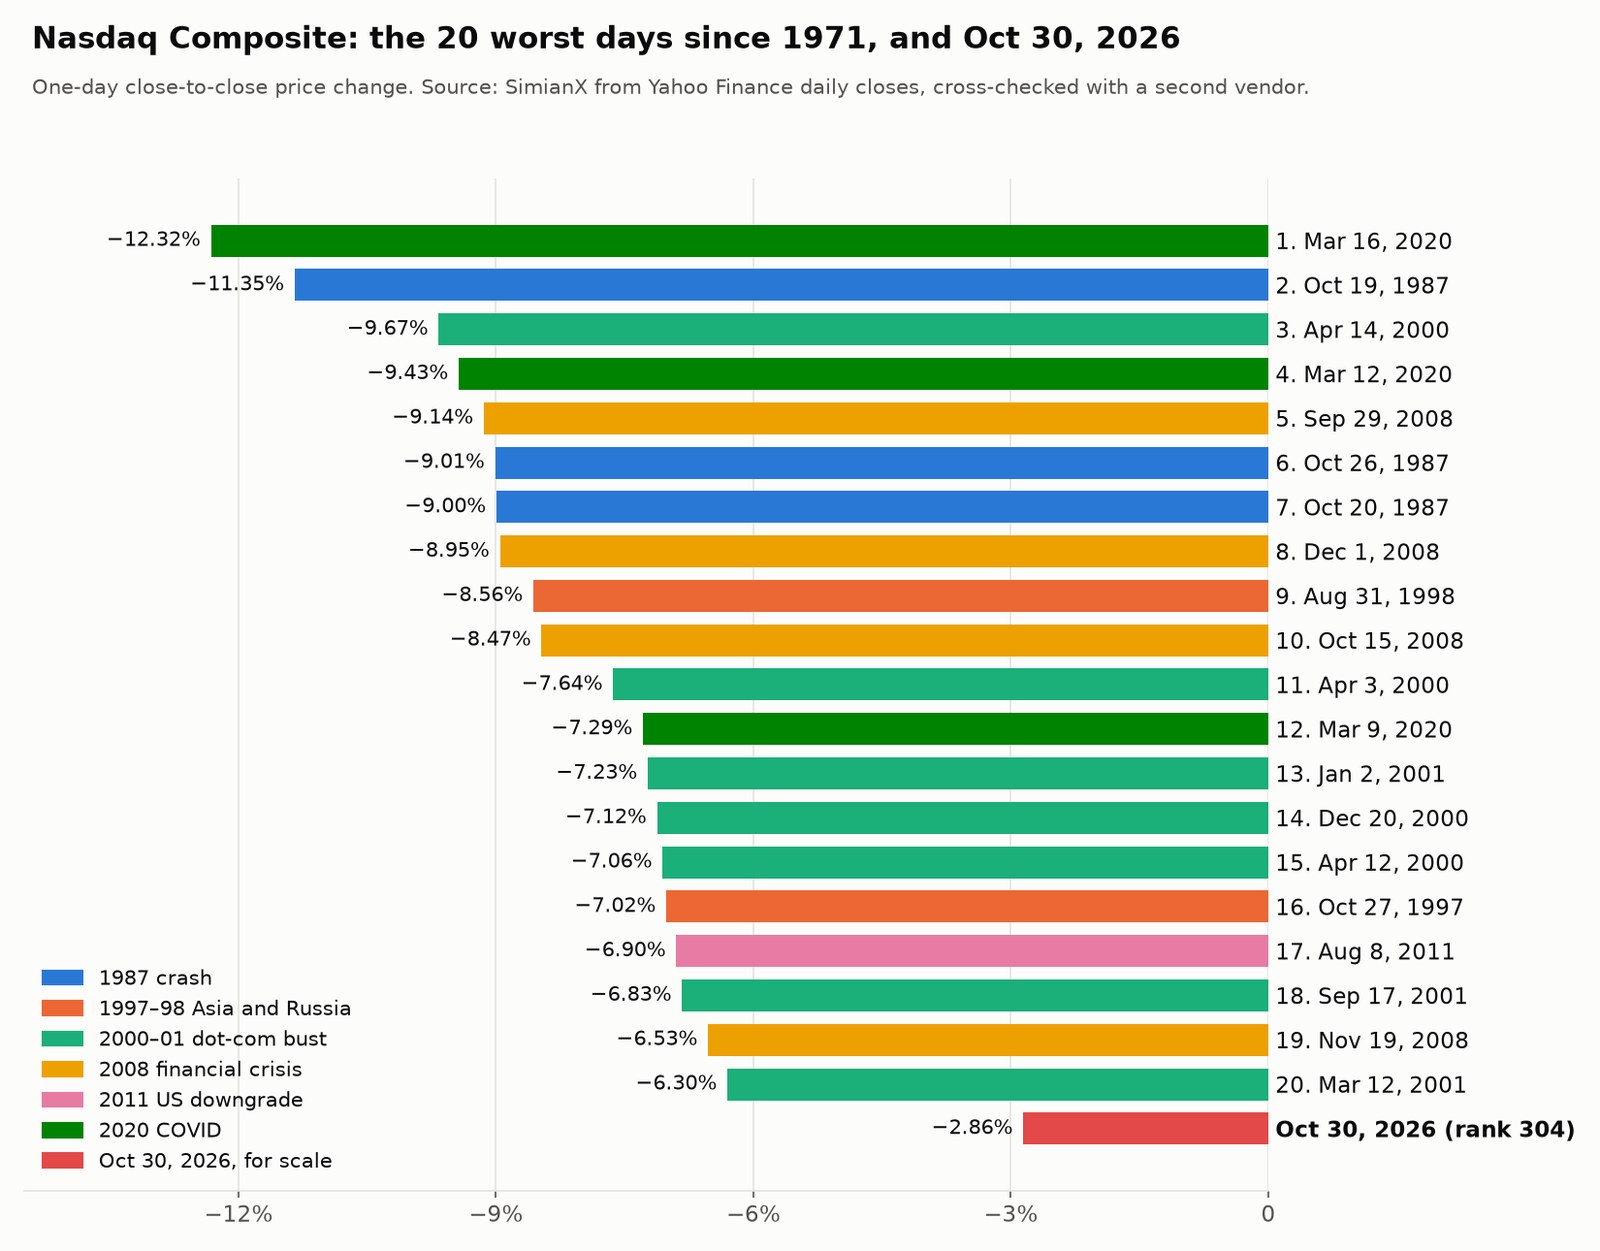
Two things stand out when you compare this with the S&P 500. First, the Nasdaq's worst day is not Black Monday. On October 19, 1987 the Composite fell 11.35% against the S&P 500's 20.47%. Then on October 20, while the S&P 500 rebounded 5.33%, the Composite lost another 9.00%. Second, on April 3, 2000, the Composite fell 7.64% while the S&P 500 rose 0.49%, because the collapse of Microsoft's antitrust settlement talks was a technology problem and not a market-wide one.
What Came Next After Each Drop
All figures are Composite price returns measured from the close on the day of the drop.
| Date | Composite | +1 session | +1 week | +1 month | +3 months | +1 year |
|---|---|---|---|---|---|---|
| March 16, 2020 | −12.32% | +6.2% | −0.6% | +21.6% | +40.9% | +95.1% |
| October 19, 1987 | −11.35% | −9.0% | −17.0% | −12.0% | −5.5% | +7.1% |
| April 14, 2000 | −9.67% | +6.6% | +4.9% | +11.9% | +28.7% | −42.5% |
| March 12, 2020 | −9.43% | +9.3% | −0.7% | +13.8% | +31.8% | +85.0% |
| September 29, 2008 | −9.14% | +5.5% | −6.1% | −16.9% | −23.9% | +7.1% |
| October 26, 1987 | −9.01% | −0.9% | +9.8% | +6.0% | +13.5% | +28.9% |
| October 20, 1987 | −9.00% | +7.4% | −9.6% | −2.9% | +1.8% | +18.5% |
| December 1, 2008 | −8.95% | +3.7% | +12.4% | +12.8% | −3.2% | +55.6% |
| August 31, 1998 | −8.56% | +5.1% | +10.8% | +13.0% | +30.0% | +82.7% |
| October 15, 2008 | −8.47% | +5.5% | −0.8% | −1.9% | −7.2% | +33.5% |
| April 3, 2000 | −7.64% | −1.8% | −0.8% | −12.2% | −5.5% | −60.4% |
| March 9, 2020 | −7.29% | +5.0% | −13.2% | −0.8% | +24.8% | +64.4% |
| January 2, 2001 | −7.23% | +14.2% | +6.5% | +21.4% | −27.0% | −13.6% |
| December 20, 2000 | −7.12% | +0.3% | +9.6% | +21.8% | −17.3% | −17.8% |
| April 12, 2000 | −7.06% | −2.5% | −1.7% | −6.4% | +10.7% | −48.0% |
| October 27, 1997 | −7.02% | +4.3% | +6.2% | +3.5% | +4.9% | +11.9% |
| August 8, 2011 | −6.90% | +5.3% | +8.4% | +8.1% | +13.9% | +27.7% |
| September 17, 2001 | −6.83% | −1.5% | −5.1% | +9.0% | +23.7% | −20.2% |
| November 19, 2008 | −6.53% | −5.1% | +10.5% | +12.8% | +0.1% | +55.6% |
| March 12, 2001 | −6.30% | +4.8% | +1.4% | −3.7% | +12.9% | −1.4% |
Across these 20 days, the index was higher after one session in 14 cases (median +4.9%), after one week in 10 (median +0.4%), after one month in 12 (median +7.0%), after three months in 13 (median +7.8%) and after one year in 13 (median +15.2%).
That one-year median needs context, because the Composite's median one-year return from any day since 1971 is +15.1%. On this list, a crash day has led to about the same year as an ordinary day, with a far wider spread: from −60.4% after April 3, 2000 to +95.1% after March 16, 2020.
The Nasdaq-100's 10 Worst Days
The Nasdaq-100 holds about 100 of the largest non-financial Nasdaq companies, so it falls harder than the Composite when mega-cap technology leads the selling. Its data begins in October 1985 in the history we use.
| Rank | Date | Nasdaq-100 | +1 session | +1 week | +1 month | +3 months | +1 year |
|---|---|---|---|---|---|---|---|
| 1 | October 19, 1987 | −15.08% | −7.5% | −17.5% | −7.8% | +1.5% | +13.7% |
| 2 | March 16, 2020 | −12.19% | +6.5% | −0.2% | +22.4% | +39.3% | +87.3% |
| 3 | October 26, 1987 | −11.69% | +1.1% | +18.5% | +12.6% | +20.9% | +37.3% |
| 4 | September 29, 2008 | −10.52% | +6.6% | −5.7% | −13.3% | −21.6% | +14.8% |
| 5 | August 31, 1998 | −9.86% | +6.6% | +12.8% | +18.0% | +36.6% | +110.2% |
| 6 | April 14, 2000 | −9.73% | +10.0% | +4.5% | +13.7% | +26.6% | −48.6% |
| 7 | March 12, 2020 | −9.27% | +10.1% | +0.3% | +14.7% | +32.0% | +78.1% |
| 8 | January 2, 2001 | −9.09% | +18.8% | +8.6% | +22.5% | −34.3% | −24.4% |
| 9 | October 15, 2008 | −8.82% | +5.5% | −0.6% | −0.3% | −4.9% | +40.9% |
| 10 | September 17, 2001 | −8.25% | −2.2% | −4.9% | +12.1% | +28.2% | −28.4% |
Black Monday heads this list at −15.08%. The biggest next-session rebound here is +18.8% on January 3, 2001, the day the Federal Reserve cut rates between meetings. That index was still 24.4% lower a year after the January 2 drop, which shows how little a one-day bounce can settle.
Do Big Drops Predict Rebounds? The Base Rates
The tables above invite an easy conclusion: buy the crash. The fuller record does not support it. This table compares every drop of 3%, 5% and 7% or more with all sessions in each index. Each cell shows the median return, with the share of cases that finished higher in parentheses.
| Index | Group | Days | +1 session | +1 week | +1 month | +3 months | +1 year |
|---|---|---|---|---|---|---|---|
| Composite | All days | 13,800 | +0.1% (56%) | +0.4% (58%) | +1.5% (61%) | +3.6% (66%) | +15.1% (76%) |
| Composite | Drop of 3%+ | 264 | −0.1% (48%) | +0.5% (54%) | +1.4% (56%) | +5.0% (61%) | +18.7% (64%) |
| Composite | Drop of 5%+ | 48 | +0.3% (54%) | +1.4% (54%) | +5.4% (60%) | +5.6% (60%) | +17.8% (60%) |
| Composite | Drop of 7%+ | 16 | +5.0% (75%) | −0.7% (44%) | +4.7% (56%) | +3.4% (56%) | +15.2% (69%) |
| Nasdaq-100 | All days | 10,099 | +0.1% (55%) | +0.5% (58%) | +1.7% (63%) | +4.7% (70%) | +17.7% (82%) |
| Nasdaq-100 | Drop of 3%+ | 353 | +0.2% (56%) | +0.7% (56%) | +0.8% (54%) | +5.9% (61%) | +18.3% (62%) |
| Nasdaq-100 | Drop of 5%+ | 69 | +0.2% (52%) | +1.8% (62%) | +3.2% (57%) | +4.6% (59%) | +12.3% (54%) |
| Nasdaq-100 | Drop of 7%+ | 22 | +4.4% (73%) | +3.4% (59%) | +11.6% (68%) | +8.8% (68%) | −4.8% (45%) |
The "Days" column counts cases with a complete one-year window.
Three findings hold up:
- Ordinary big drops show no reliable next-day bounce. After a Composite drop of 3% or more, the median next session was −0.1%, and only 48% of cases were higher, below the 56% for all days.
- Only the most extreme days bounce, and it fades. After drops of 7% or more, the next session was higher about three times in four (median +5.0% on the Composite, +4.4% on the Nasdaq-100). Yet one week later the Composite was higher in only 44% of cases.
- A year later the odds were lower, not higher. On the Nasdaq-100, 82% of all days were followed by a higher index a year on. After drops of 7% or more that fell to 45%, with a median of −4.8%. On the Composite the figures were 76% and 69%.
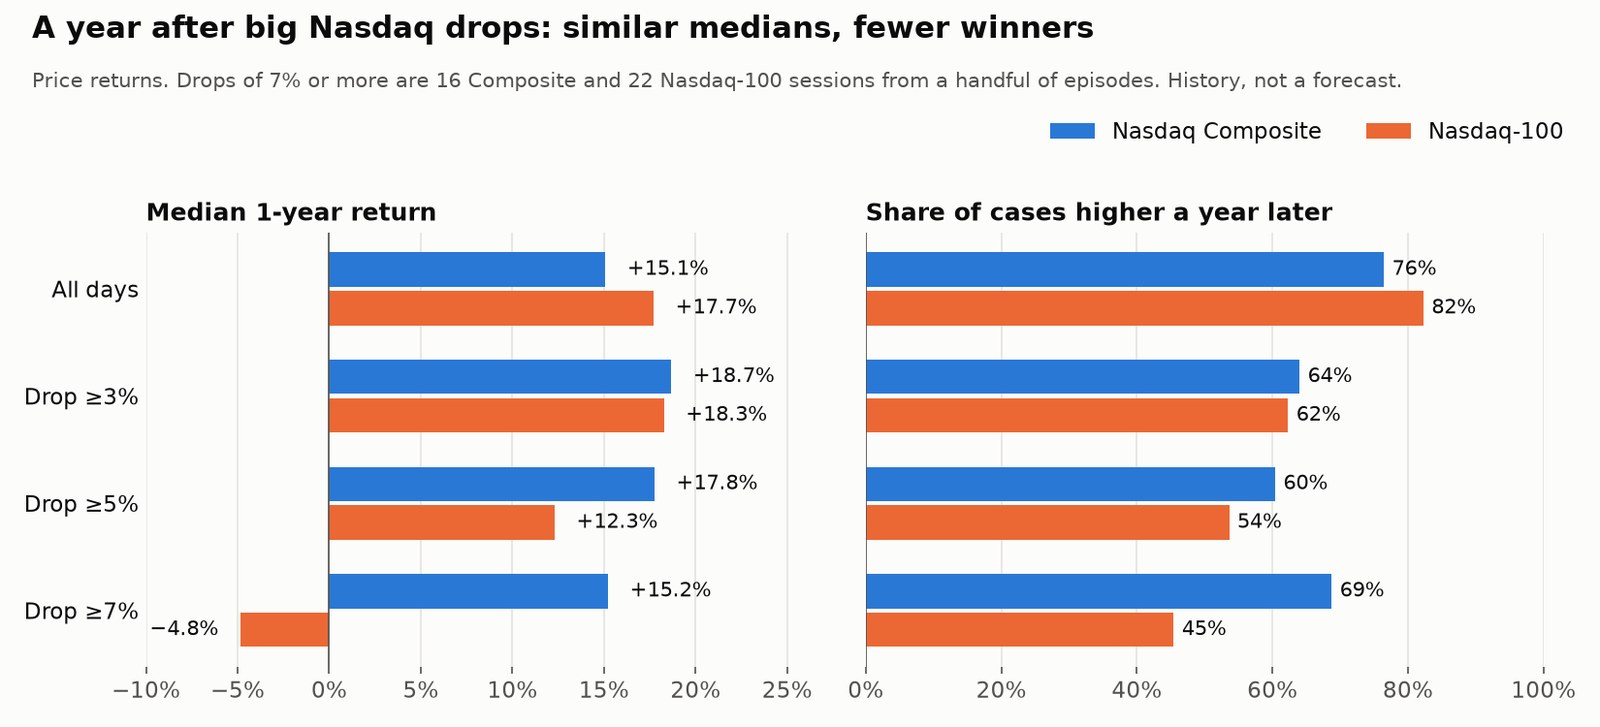
The small-sample caveat matters here. Those 16 Composite and 22 Nasdaq-100 sessions come from only a handful of separate episodes, mainly 1987, 2000–01, 2008 and 2020. Days in the same episode share the same future, so their forward windows overlap and they do not count as independent tests. The Nasdaq-100 result in particular leans heavily on the dot-com bust, which supplied 12 of its 22 drops of 7% or more. Two or three more episodes could change these percentages noticeably.
Crash Days Cluster, and the Episode Decides What Follows
The drops are not spread evenly across time. Well over a third of all Nasdaq-100 sessions with a drop of 3% or more happened in just three years: 56 in 2000, 50 in 2001 and 43 in 2002. There were none in 2023.
| Decade | Composite 3%+ | Composite 5%+ | Composite 7%+ | Nasdaq-100 3%+ | Nasdaq-100 5%+ | Nasdaq-100 7%+ |
|---|---|---|---|---|---|---|
| 1970s | 6 | 0 | 0 | — | — | — |
| 1980s | 15 | 4 | 3 | 16 | 6 | 3 |
| 1990s | 25 | 3 | 2 | 58 | 9 | 2 |
| 2000s | 137 | 31 | 8 | 194 | 43 | 15 |
| 2010s | 32 | 3 | 0 | 35 | 1 | 0 |
| 2020s | 50 | 7 | 3 | 53 | 10 | 2 |
The 1970s begin in February 1971 for the Composite. The Nasdaq-100 count begins in October 1985. The 2020s run through October 30, 2026.
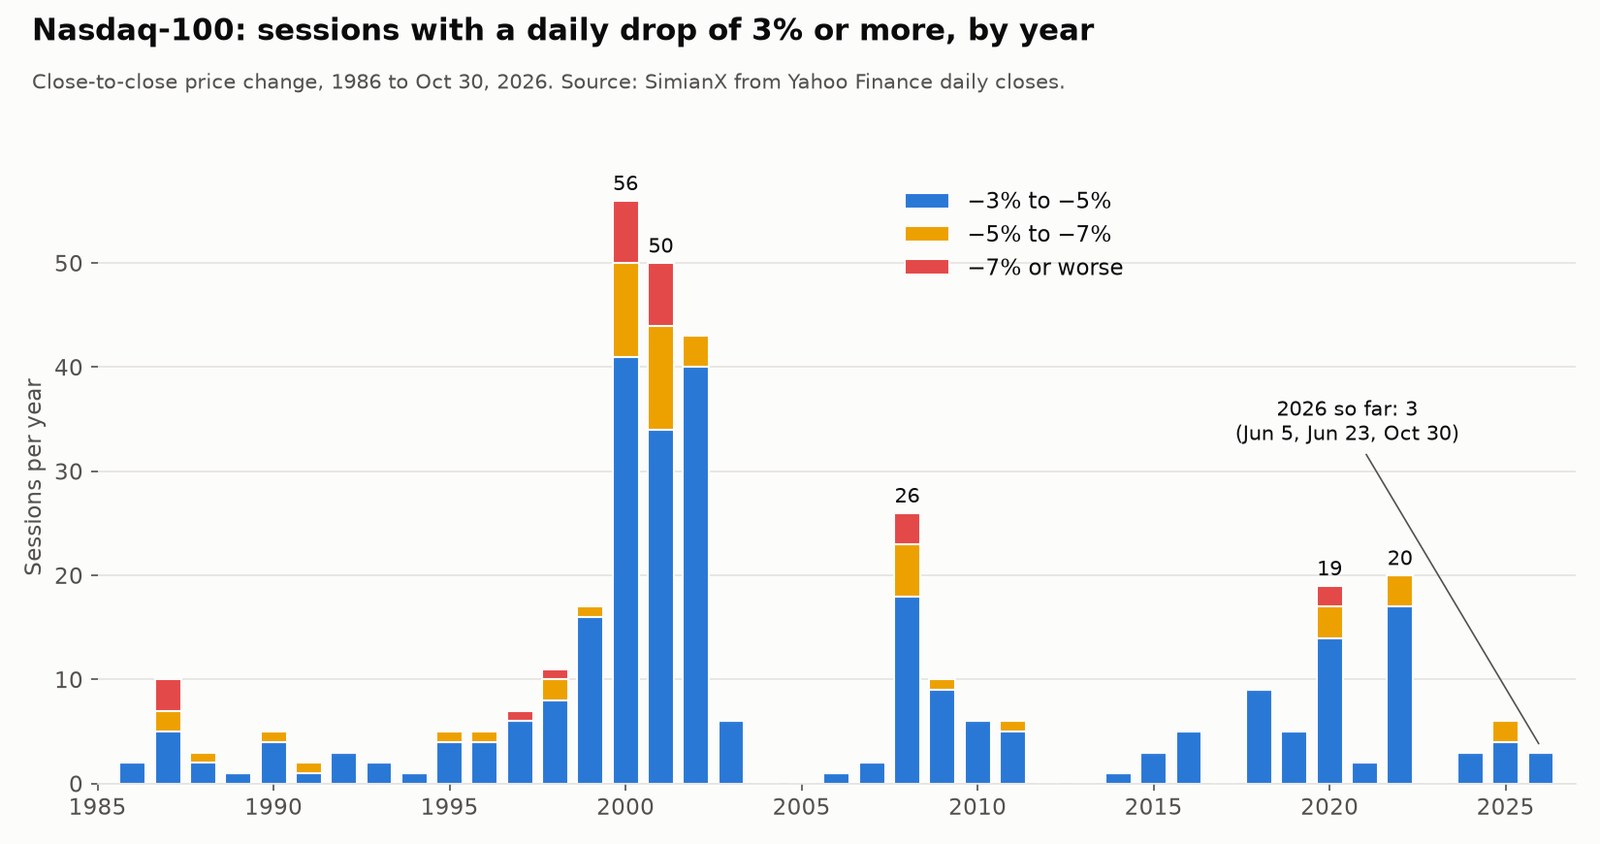
What followed depended on the episode far more than on the size of the drop:
- The dot-com bust (seven of the 20 days). All seven were lower a year later, by 1.4% to 60.4%. The bounces were real but brief. A peak-to-trough decline that long overwhelms any single-day reading.
- The 2008 financial crisis (four days). All four were higher a year later, by 7.1% to 55.6%, but three months later three of the four were lower or flat, including −23.9% after the failed TARP vote. The wider decline is in Every S&P 500 Bear Market Since 1929, and the VIX history tracks the same stress.
- The 1987 crash (three days). All three were higher a year later, by 7.1% to 28.9%, even though the Composite was still falling a week after Black Monday (−17.0%).
- COVID in 2020 (three days). The fastest recoveries on the list, at +64.4% to +95.1% after a year, though all three were lower one week later.
- One-offs in 1997, 1998 and 2011. Each was higher a year later, by 11.9%, 82.7% and 27.7%.
The current episode's closest relatives are recorded in our reference on every SOX semiconductor crash and the study of the 2026 AI momentum unwind. How long full recoveries took is covered in How Long Every Bear Market Took to Recover.
You can follow outsized moves as they happen on Market Pulse, or run a live AI analysis on a ticker to test a view against current data. Neither tells you what the market will do next.
Methodology and Data Sources
- Indexes. The Nasdaq Composite covers common stocks listed on Nasdaq and starts February 5, 1971 at 100 in our data. The Nasdaq-100 starts October 1, 1985 in the Yahoo Finance history used here. They are different indexes and we label every figure.
- Return type. Price return, close to close. Dividends are excluded, so long-window figures understate total return slightly. Intraday lows are ignored.
- Windows. One week is five sessions, one month 21 sessions, three months 63 sessions. One year is the first close on or after the same calendar date a year later, matching the S&P 500 companion table. "Median" and "higher" include all windows that have finished as of October 30, 2026.
- Sources. Primary series are daily closes from Yahoo Finance (Composite, Nasdaq-100). Every ranked row was compared with a second independent vendor's daily history, and the Composite top 20 with the Wikipedia compilation. The Federal Reserve's FRED copies of these series could not be downloaded when we built this table, so they were not part of the check.
- Discrepancies. (1) For October 27, 1997, Yahoo shows a Composite close of 1,532.75 (−7.16%) and October 28 at 1,603.02, while the second vendor and the Wikipedia table show 1,535.09 (−7.02%) and a +4.25% next day. We use the latter two closes, which moves that row from rank 14 to rank 16. (2) October 26, 1987: −9.01% versus −8.99%, which would swap ranks 6 and 7. (3) Nasdaq-100, April 14, 2000: −9.73% (Yahoo) versus −9.80%, with no rank change; forward returns differ by about 0.1 point. (4) Nasdaq-100, October 27, 1997: −7.49% versus −7.42%, outside the top 10. (5) October 30, 2026 was first published from same-day prints; the second vendor's completed daily bar has since posted and matches both index closes.
- Triggers. Causes come from contemporaneous reports and reference sources linked in the tables. They describe what was reported at the time, and markets rarely have one cause.
- Intel's "since 1974" claim. Yahoo's daily Intel data begins in March 1980, so it cannot test a 1974 comparison.
This is historical analysis for education and is not investment advice.
Frequently Asked Questions
What was the worst day in Nasdaq history?
For the Nasdaq Composite, March 16, 2020, at −12.32%, as COVID-19 lockdowns spread. For the Nasdaq-100, October 19, 1987, at −15.08%. Percentages are the fair comparison, because the largest point declines are all recent and the index level is far higher now.
How does October 30, 2026 rank among the Nasdaq's worst days?
It is not close to the all-time list. The Nasdaq-100's −3.46% ranks 247th of 10,350 sessions and the Composite's −2.86% ranks 304th of 14,051. It is the second-largest fall of 2026 on both indexes and the ninth-largest of 12 Nasdaq-100 drops of 3% or more since January 2023.
What happened to the Nasdaq after Black Monday?
It kept falling at first. The Composite lost 9.00% the next day, even as the S&P 500 rose 5.33%, and was 17.0% lower a week later and 12.0% lower a month later. A year after Black Monday it was up 7.1%.
Does the Nasdaq go up after a big drop?
Sometimes, and less reliably than people assume. After the Composite's 20 worst days it was higher the next session 14 times and a year later 13 times. But the median one-year return was about the same as from any day (+15.2% versus +15.1%), and on the Nasdaq-100 only 45% of drops of 7% or more were higher a year later, against 82% of all days. These samples are small and come from few episodes.
What is the difference between the Nasdaq Composite and the Nasdaq-100?
The Composite covers the broad list of Nasdaq-listed common stocks, including financial companies. The Nasdaq-100 tracks about 100 of the largest non-financial names, so it is more concentrated in mega-cap technology. On October 30, 2026 that gap showed up as −3.46% against −2.86%.
How often does the Nasdaq fall 3% in a day?
The Composite has done so on 265 of 14,051 sessions (1.9%) and the Nasdaq-100 on 356 of 10,350 (3.4%). They come in clusters: the 2000s account for 137 and 194 of those days, while 2023 had none.
Should I sell after a big Nasdaq drop?
We can't answer that for you, and this table isn't personal financial advice. What it does show is that the outcome depended mainly on the wider episode, and that a single day's size says little about the months after it. The same pattern on the S&P 500 is covered in the companion table, and Do AI Models Panic-Sell in a Crash? looks at how trading models behave under the same stress.
Related Reading
- The 20 Worst Days in S&P 500 History and What Came Next
- Nasdaq Returns by Year: Every Year 1972–2026 Table
- Magnificent 7 Earnings Dates and Results: Q3 2026 Tracker
- Every S&P 500 Bear Market Since 1929: When Was the Last?
- How Long Every Bear Market Took to Recover: 1929-2022
- VIX Spikes History: Every Major Volatility Spike Since 1990
- Semiconductor Bear Markets: Every SOX Crash, 1995–2026
- AI Momentum Unwind 2026: Why Semiconductor Stocks Fall
- Nasdaq Up, Most Stocks Down: Narrow Rally Days 2019–2026
- Do AI Models Panic-Sell in a Crash? What 31 Bots Reveal
- 9/11 & Early War on Terror: S&P 500 -14%, 4-Month Recovery
References
- Yahoo Finance — Nasdaq Composite daily history
- Yahoo Finance — Nasdaq-100 daily history
- Yahoo Finance — live market coverage, October 30, 2026
- Intel — third-quarter 2026 results, October 29, 2026 (SEC filing)
- Reuters via The Star — Intel's fall on August 2, 2024
- Nasdaq Global Indexes — Nasdaq Composite overview
- Nasdaq Global Indexes — Nasdaq-100 overview
- Wikipedia — largest daily changes in the Nasdaq Composite
- Federal Reserve History — the stock market crash of 1987
- Federal Reserve — rate decision of January 3, 2001
- NBER — recession announcement of December 1, 2008