
 By Marcus Reeve
Every VIX Spike Since 1990: Peaks, Triggers and What the S&P 500 Did Next
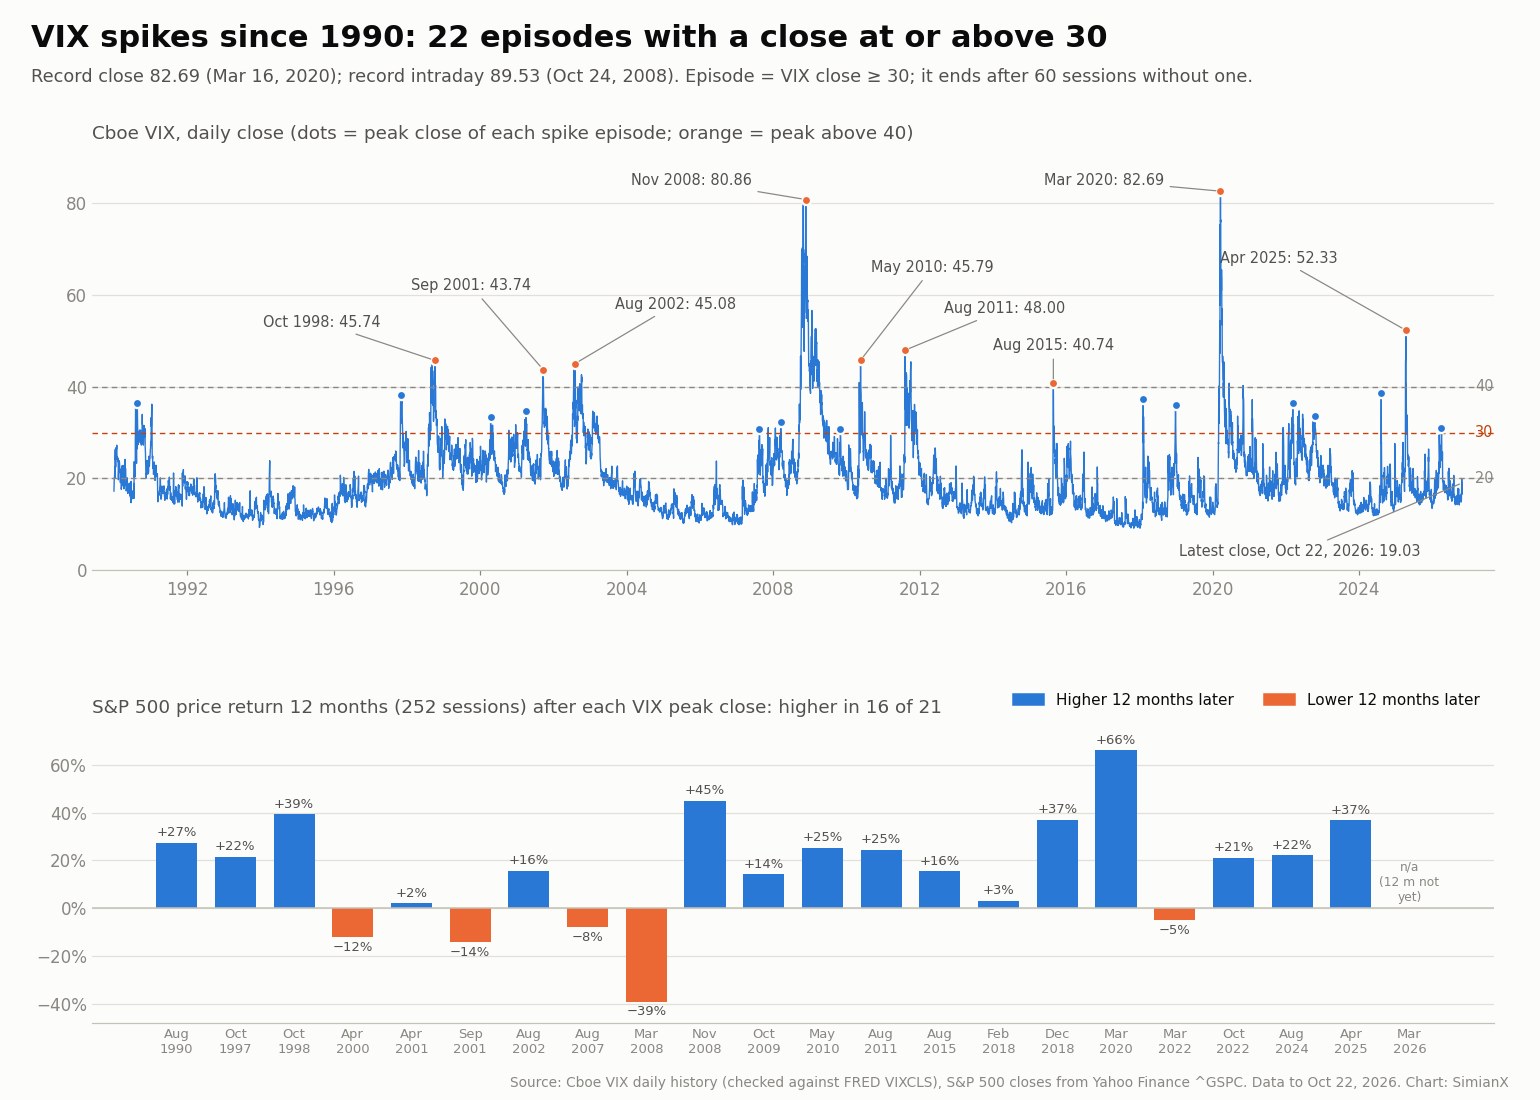
Quick answer: Since 1990 the Cboe Volatility Index (VIX) has gone through 22 separate spikes with a close at or above 30, and 9 of them peaked above 40. The highest close on record is 82.69 (March 16, 2020) and the highest intraday reading is 89.53 (October 24, 2008). Measured from the VIX peak close, the S&P 500's median price return was +7.4% after one month, +10.5% after three months and +21.2% after twelve months, and stocks were higher twelve months later in 16 of 21 completed cases. The median spike took 40 trading sessions to close back below 20. The VIX closed at 19.03 on October 22, 2026.
Updated October 23, 2026. Data through the October 22, 2026 close. How this page is updated: the current VIX level is refreshed weekly, and the table is recomputed from Cboe's official daily file whenever a new spike begins or a pending column (such as the 12-month return of the March 2026 spike) can be filled in. See the method at the end.
The VIX is Wall Street's "fear gauge": a number, published by Cboe, that shows how much movement the options market expects from the S&P 500 over the next 30 days. When it jumps, it is because investors are paying up for protection all at once. This page is a reference table of every major VIX spike since 1990, built from Cboe's official daily history. For each spike it records the peak close, the intraday high, what triggered it, how far the S&P 500 had already fallen, what the index did one, three and twelve months later, and how long the VIX needed to calm back down below 20.
Every number below comes from the data files listed in the method section. Nothing is estimated or rounded from memory.
How this table defines a VIX spike
A list of "VIX spikes" is only useful if the rule is clear, so here it is:
- Start: a spike begins on the first day the VIX closes at or above 30.
- End: the spike ends once the VIX has gone 60 trading sessions in a row (about three months) without another close at or above 30. Any close at or above 30 inside that window belongs to the same spike, so a crisis with several waves, such as 2008, counts once.
- Peak: the highest close within the spike. All forward returns are measured from the S&P 500 close on that peak date.
Why 30? The VIX's long-run average since 1990 is 19.42 and its median is 17.56. Only 7.9% of the 9,300 trading sessions since January 2, 1990 closed at or above 30, and only 2.2% closed at or above 40. A close of 30 is roughly where volatility moves from "nervous" to "stressed", and it captures the events most investors remember without drowning the table in minor wobbles. We use closing values for the rule because the intraday high can be distorted by a few minutes of thin trading; the intraday high is shown separately.
Every VIX spike since 1990: the reference table
Peak closes of 40 or higher are in bold. "Drawdown" is the S&P 500 close on the VIX peak date versus its highest close of the previous 12 months (252 sessions). Forward returns are S&P 500 price returns (no dividends) over the next 21, 63 and 252 trading sessions. The last column counts trading sessions from the VIX peak until its first close below 20.
| Peak close date | Trigger | VIX peak close | Intraday high | S&P 500 drawdown | S&P 500 +1 month | +3 months | +12 months | Sessions until VIX < 20 |
|---|---|---|---|---|---|---|---|---|
| Aug 23, 1990 | Iraq invades Kuwait, Gulf War oil shock | 36.47 | n/a | −16.8% | −0.8% | +2.9% | +27.4% | 122 |
| Oct 30, 1997 | Asian financial crisis, Oct 27 mini-crash | 38.20 | 48.64 | −8.1% | +7.9% | +10.8% | +21.6% | 70 |
| Oct 8, 1998 | Russian default and LTCM collapse | 45.74 | 49.53 | −19.2% | +18.9% | +32.9% | +39.2% | 183 |
| Apr 14, 2000 | Dot-com bubble bursts | 33.49 | 34.31 | −11.2% | +8.1% | +11.3% | −12.1% | 52 |
| Apr 3, 2001 | Dot-com bear market, 2001 recession | 34.72 | 35.45 | −27.2% | +12.8% | +11.6% | +2.2% | 43 |
| Sep 20, 2001 | September 11 attacks | 43.74 | 49.35 | −32.8% | +9.0% | +16.8% | −14.1% | 111 |
| Aug 5, 2002 | WorldCom and accounting scandals | 45.08 | 48.46 | −31.6% | +7.0% | +8.0% | +15.7% | 192 |
| Aug 16, 2007 | Subprime credit crunch begins | 30.83 | 37.50 | −9.1% | +4.6% | +4.2% | −8.0% | 25 |
| Mar 17, 2008 | Bear Stearns collapse | 32.24 | 37.57 | −18.4% | +6.9% | +6.5% | −39.0% | 28 |
| Nov 20, 2008 | Lehman failure, global financial crisis | 80.86 | 89.53 | −50.4% | +15.8% | +2.8% | +45.0% | 273 |
| Oct 30, 2009 | Post-crisis pullback | 30.69 | 31.59 | −5.6% | +7.0% | +6.5% | +14.3% | 36 |
| May 20, 2010 | Flash Crash, Greek debt crisis | 45.79 | 48.20 | −12.0% | +3.9% | +0.4% | +25.4% | 99 |
| Aug 8, 2011 | US credit downgrade, euro crisis | 48.00 | 48.00 | −17.9% | +4.1% | +12.7% | +24.5% | 113 |
| Aug 24, 2015 | China yuan devaluation selloff | 40.74 | 53.29 | −11.2% | +2.4% | +10.4% | +15.5% | 29 |
| Feb 5, 2018 | "Volmageddon" short-volatility unwind | 37.32 | 50.30 | −7.8% | +2.9% | +0.9% | +3.1% | 7 |
| Dec 24, 2018 | Fed tightening, US–China trade war | 36.07 | 36.20 | −19.8% | +13.3% | +19.3% | +37.1% | 10 |
| Mar 16, 2020 | COVID-19 crash | 82.69 | 85.47 | −29.5% | +16.6% | +28.5% | +66.1% | 231 |
| Mar 7, 2022 | Fed tightening, Russia invades Ukraine | 36.45 | 38.94 | −12.4% | +7.7% | −1.9% | −5.0% | 15 |
| Oct 11, 2022 | 2022 bear market, Fed hikes, UK gilt crisis | 33.63 | 34.88 | −25.2% | +4.5% | +10.6% | +21.2% | 37 |
| Aug 5, 2024 | Yen carry-trade unwind | 38.57 | 65.73 | −8.5% | +6.4% | +10.5% | +22.2% | 6 |
| Apr 8, 2025 | "Liberation Day" tariff shock | 52.33 | 60.13 | −18.9% | +13.7% | +26.0% | +36.8% | 23 |
| Mar 27, 2026 | Iran war, Strait of Hormuz oil shock | 31.05 | 31.65 | −8.7% | +12.1% | +16.8% | pending | 8 |
Intraday high = the highest intraday VIX reading at any point during the spike, from Cboe's file; Cboe's daily file has no intraday range before 1992, so the 1990 row shows n/a. The 12-month return of the March 2026 spike will be known after March 2027.
Summary statistics: what usually happened next
| Group | Spikes | Median +1 month | Median +3 months | Median +12 months | Higher 12 months later | Median S&P 500 drawdown at peak | Median sessions until VIX < 20 |
|---|---|---|---|---|---|---|---|
| All spikes | 22 | +7.4% | +10.5% | +21.2% | 16 of 21 | −17.3% | 40 |
| Peak close 40 or higher | 9 | +9.0% | +12.7% | +25.4% | 8 of 9 | −19.2% | 113 |
| Peak close 30 to 40 | 13 | +7.0% | +10.5% | +8.7% | 8 of 12 | −11.2% | 28 |
Three patterns stand out:
- The first month was almost always positive. The S&P 500 was higher one month after the VIX peak close in 21 of 22 spikes; the only exception was August 1990 (−0.8%). Three months later it was also higher in 21 of 22; the exception was March 2022 (−1.9%).
- Bigger fear came with a bigger rebound on average, and a slower calm-down. Spikes that peaked at 40 or higher had a median 12-month return of +25.4%, against +8.7% for spikes that peaked between 30 and 40. But the VIX also needed far longer to settle: a median of 113 sessions to close below 20, against 28.
- Twelve months later, stocks were higher in 16 of 21 completed cases. The mean 12-month return was +16.1%. The best was +66.1% after March 2020 and the worst was −39.0% after March 2008.
These are historical observations from 22 episodes, not a trading rule. A small sample and very different causes mean any single spike can behave differently.
The two biggest spikes: 2008 and 2020
Only twice has the VIX closed above 80.
The global financial crisis (2008). The VIX first closed above 30 on September 15, 2008, the day Lehman Brothers filed for bankruptcy, and stayed in the same spike until July 2009, with 186 closes at or above 30. It printed the highest intraday reading in its history, 89.53, on October 24, 2008, and its peak close of 80.86 came on November 20, 2008, when the S&P 500 was 50.4% below its high of the prior 12 months. Stocks were still not at the bottom: the S&P 500 fell another 10.1% to its March 9, 2009 low, 72 sessions later. From the VIX peak, the index was up 2.8% after three months and 45.0% after twelve. The VIX needed 273 sessions, until December 22, 2009, to close below 20 again, the longest wait in the table. For the full context of that crash see every S&P 500 bear market since 1929.
The COVID-19 crash (2020). The VIX closed at its all-time record of 82.69 on March 16, 2020, with the S&P 500 29.5% below its 12-month high. The index made its low just five sessions later, on March 23, 6.2% lower, and then rebounded fast: +16.6% one month after the VIX peak, +28.5% after three months and +66.1% after twelve, the best result in the table. Even so, the VIX did not close below 20 until February 12, 2021, 231 sessions after the peak.
The VIX peak is rarely the exact bottom
A common belief is that "the VIX peak marks the low". The data says it usually doesn't, at least not exactly. In 18 of 22 spikes the S&P 500 made a lower close at some point in the 12 months after the VIX peak close. The median additional decline was 4.2%, which is small, but the worst cases were not:
- March 2008 (Bear Stearns): the S&P 500 fell another 47.0%, to the March 9, 2009 low, 246 sessions after the VIX peak.
- September 2001 (9/11): another 19.0%, to July 23, 2002. Our story on 9/11 and the early war on terror covers that shock in detail.
- April 2000 (dot-com bust): another 18.7%, to April 4, 2001.
- March 2022 (Fed tightening and the Russian invasion of Ukraine): another 14.9%, to the October 12, 2022 low. See the Russia–Ukraine war stock market impact.
Only four times was the VIX peak day also the lowest S&P 500 close of the following year: October 1997, October 1998, December 2018 and April 2025. In other words, a VIX spike tells you fear is extreme; it does not tell you the selling is over.
When stocks were lower 12 months later
Five spikes were followed by a lower S&P 500 a year later: April 2000 (−12.1%), September 2001 (−14.1%), August 2007 (−8.0%), March 2008 (−39.0%) and March 2022 (−5.0%). They share one feature: each happened while a longer bear market was still unfolding, the 2000–2002 dot-com bear market, the 2007–2009 financial crisis and the 2022 bear market. The 2001 and 2007–2009 cases also overlapped US recessions as dated by the NBER.
Spikes caused by a sudden shock inside an otherwise healthy economy, such as the 1998 LTCM crisis, the 2010 Flash Crash, the 2015 yuan devaluation or the 2024 yen carry-trade unwind, all ended with the S&P 500 higher a year later. That is why it helps to pair the VIX with a recession lens such as the yield curve inversion record, and with the timelines in how long every bear market took to recover.
How long it takes the VIX to fall back below 20
A VIX close below 20 is a reasonable "back to normal" marker, because it sits close to the long-run average. Across all 22 spikes the median wait was 40 trading sessions, but the range is wide:
- Fastest: August 2024, 6 sessions (back below 20 on August 13, 2024); February 2018, 7 sessions; March 2026, 8 sessions; December 2018, 10 sessions.
- Slowest: November 2008, 273 sessions; March 2020, 231 sessions; August 2002, 192 sessions; October 1998, 183 sessions.
The pattern is intuitive. Spikes driven by a positioning accident, such as the 2018 short-volatility unwind or the 2024 yen carry trade, fade in days. Spikes driven by a real economic or financial crisis keep volatility high for months, even while stocks recover.
Intraday spikes vs closing spikes
Several famous VIX moments look far bigger intraday than at the close:
- August 5, 2024: the VIX hit 65.73 intraday during the yen carry-trade unwind but closed at 38.57, and it was back below 20 six sessions later.
- August 24, 2015: 53.29 intraday during the China selloff, 40.74 at the close.
- February 2018 ("Volmageddon"): the peak close was 37.32 on February 5, and the intraday high reached 50.30 the next day.
- April 2025: 60.13 intraday on April 7 after the tariff announcement, then a peak close of 52.33 on April 8.
If you see a headline about "the VIX above 60", check whether it refers to an intraday print. This table uses closes for the rule and shows the intraday high for context.
War and geopolitical shocks in the table
Geopolitics appears in the table less often than you might expect. Iraq's invasion of Kuwait (1990), the September 11 attacks (2001), Russia's invasion of Ukraine (2022, inside a Fed-driven selloff) and the 2026 Iran war are the clear cases. Most of the biggest spikes were financial: credit crises, crashes and policy shocks. Our Buy the Invasion study of 12 wars shows the same thing from the stock side: wars often caused a short drawdown followed by recovery.
2026 so far. This year has had one spike: the VIX closed at 31.05 on March 27, 2026, as the Iran war and the threat to oil tankers in the Strait of Hormuz pushed the S&P 500 to its fifth straight weekly loss. The S&P 500 closed at 6,368.85 that day, 8.7% below its 12-month high. The VIX was back below 20 on April 9, 2026, just eight sessions later, and the S&P 500 was up 12.1% one month after the peak and 16.8% after three months. For the oil and sector side of that episode see Iran war impact on stocks and how the S&P 500 performs during oil shocks.
What is the VIX today?
The VIX closed at 19.03 on October 22, 2026, according to Cboe's daily history, just below its long-run average of 19.42 and well below the 30 level that starts a spike in this table. The S&P 500 closed at 7,663.43 the same day. There is currently no open spike.
Fear gauges outside the US
The VIX measures expected volatility of the S&P 500 only, but it moves with global markets, and most large markets have their own version built on local index options: the VSTOXX for the Euro Stoxx 50, the Nikkei Stock Average Volatility Index in Japan, the VKOSPI for Korea's KOSPI 200, India VIX for the Nifty 50, the Hang Seng Volatility Index (VHSI) in Hong Kong, the TAIFEX VIX in Taiwan and the RVI on the Moscow Exchange. Their levels are not directly comparable with the VIX because they are based on different indexes, but their spikes tend to cluster around the same global events. For a local example of how a crash plays out outside the US, see every KOSPI crash since 1990.
How to use this table
- As context, not a signal. A VIX close above 30 says the market is stressed. On its own it does not tell you whether the cause is a short-lived shock or the start of a long bear market.
- Look at the horizon. In this sample, one-month and three-month returns after a peak were positive in 21 of 22 cases, but the twelve-month outcome depended on whether a recession or bear market followed.
- Check corroborating signals. Breadth, credit spreads and earnings revisions help separate a liquidity panic from a fundamental repricing. Our Wall Street drawdown watch and Dow Jones risk pulse explain which ones matter. For the worst single sessions in the same crises, see the 20 worst days in S&P 500 history.
- Compare with calendar-year results. Many spike years still ended positive; see S&P 500 returns by year for every year since 1928.
If you want to watch volatility, breadth and sentiment together, SimianX's AI analyst agents track these signals in real time and can run around the clock on autopilot. This page is educational and is not investment advice.
Frequently asked questions
What is the highest VIX ever? The highest close is 82.69 on March 16, 2020, during the COVID-19 crash. The highest intraday reading is 89.53 on October 24, 2008, during the global financial crisis.
What is considered a high VIX? The VIX has averaged 19.42 since 1990. Readings above 20 are elevated, a close above 30 is the threshold for a spike in this table, and closes above 40 have happened in only 2.2% of sessions since 1990.
How often does the VIX close above 30? There have been 22 separate spikes with a close at or above 30 since 1990, and 7.9% of all trading sessions since then closed at or above 30, most of them inside the 2008–2009 and 2020 episodes.
Does a VIX spike mean the stock market has bottomed? Not necessarily. In 18 of 22 spikes the S&P 500 made a lower close within the following 12 months; in March 2008 it fell another 47.0%. The median additional decline was 4.2%.
How do stocks perform after a VIX spike? Measured from the VIX peak close, the S&P 500's median return was +7.4% after one month, +10.5% after three months and +21.2% after twelve months, and it was higher a year later in 16 of 21 completed cases.
What was the VIX in 2026? The only close at or above 30 in 2026 so far was 31.05 on March 27 (followed by 30.61 on March 30), during the Iran war. The latest close is 19.03 on October 22, 2026.
Method and sources, and how this page is updated
- VIX: daily open, high, low and close from Cboe's official VIX historical data file (VIX_History.csv), January 2, 1990 to October 22, 2026. Cross-checked against FRED VIXCLS (identical on every common date) and CNBC's .VIX history (identical). The VIX was launched in 1993 and its current method, based on S&P 500 options, dates from 2003; Cboe calculates the series back to 1990.
- S&P 500: daily closes from Yahoo Finance ^GSPC, cross-checked against FRED SP500 for the last ten years and CNBC's .SPX history (largest gap 0.12% on a single day). Returns are price returns without dividends.
- Rule: spike = VIX close at or above 30; the spike ends after 60 consecutive sessions without such a close; peak = highest close. 1 month = 21 sessions, 3 months = 63, 12 months = 252. Drawdown = S&P 500 close on the peak date versus its highest close of the previous 252 sessions.
- Updates: the "What is the VIX today?" section and the quick answer are refreshed weekly; the table and statistics are recomputed whenever a new spike starts, when a pending column can be filled (the March 2026 12-month return after March 2027), and at least once a quarter. The "Updated" date at the top shows the last refresh.
By Marcus Reeve
Related Reading
- Every S&P 500 Bear Market Since 1929: When Was the Last?
- How Long Every Bear Market Took to Recover: 1929-2022
- The 20 Worst Days in S&P 500 History and What Came Next
- S&P 500 Returns by Year: Every Year 1928–2026 Table
- South Korea Stock Market Crash 2026 vs Every KOSPI Crash
- Buy the Invasion 2026: 9 of 12 Wars Saw S&P 500 Rally
- 9/11 & Early War on Terror: S&P 500 -14%, 4-Month Recovery
- Iran War Impact: Stocks Risk-Off, Oil $100-$120, VIX Spike
- Yield Curve Inversions and US Recessions: A Reference Table
- How the S&P 500 Performs During Oil Shocks: 1973–2026
More reference tables in the Market history topic hub.
References
- Cboe — VIX Index overview
- Cboe — VIX historical data (VIX_History.csv, daily since 1990)
- FRED — CBOE Volatility Index: VIX (VIXCLS)
- FRED — S&P 500 (SP500)
- Yahoo Finance — S&P 500 (^GSPC) historical prices
- NBER — US business cycle expansions and contractions
- Wikipedia — VIX
- Wikipedia — Long-Term Capital Management
- Wikipedia — 2010 flash crash
- Wikipedia — 2008 financial crisis
- Wikipedia — 2020 stock market crash
- Wikipedia — 2015–2016 Chinese stock market turbulence
- Wikipedia — 2025 stock market crash
- AP via WBTV — Stocks fall as oil rises on the Iran war (March 27, 2026)