
 By Muke
Reading Coca-Cola’s Volume, Cash Flow and Valuation Together
Coca-Cola’s Q3 2026 results strengthen the business case more than the consumer-recovery case. Global unit case volume rose 5%, but North America was flat and Asia Pacific’s price/mix fell 2%. The company is selling more beverages; the evidence does not establish a synchronized recovery in household purchasing power.
For KO shareholders, the harder question is what that improvement is worth. At the October 27 close of $91.18, the stock cost approximately 27.4 times the implied 2026 comparable EPS floor. A durable franchise can still deliver a disappointing investment return when its valuation assumes too much.
This reference separates three tests: physical demand, conversion into cash, and the price paid for that cash. The regional and quarterly tables below explain why those tests produce different answers.
Updated October 28, 2026. Results cover the quarter ended October 2 and were released October 27. Market-price calculations use the October 27 regular-session close, not an intraday quote. Company-reported figures, guidance and SimianX calculations are identified separately. Scenario values illustrate assumptions rather than forecast prices.
Coca-Cola Q3 2026 Earnings at a Glance
| Metric | Q3 2026 | Q3 2025 / comparison |
|---|---|---|
| Net revenue | $13,380 million | $12,455 million; +7% reported |
| Global unit case volume | +5% | Year-over-year growth |
| Organic revenue growth | +7% | Non-GAAP |
| Concentrate sales growth | +7% | 2 percentage points ahead of unit cases |
| Price/mix | +1% | Pricing partly offset by unfavorable mix |
| Operating income | $4,465 million | $3,982 million; +12% reported |
| GAAP operating margin | 33.4% | 32.0% |
| Comparable operating margin | 32.9% | 31.9%; non-GAAP |
| GAAP diluted EPS | $0.93 | $0.86; +8% reported |
| Comparable EPS | $0.91 | $0.82; +11% reported |
| Comparable currency-neutral operating income growth | +8% | Non-GAAP |
Source: October 27 earnings release and financial reconciliations. Company growth rates use unrounded amounts; rounded components need not add exactly.
The strongest evidence is that demand and margins improved together. Yet the 12% reported operating-income increase includes currency and comparability effects: the company’s currency-neutral comparable measure grew 8%. Likewise, comparable EPS benefited from a 2-point currency tailwind. An improvement remains after those effects, but its size matters when valuing repeatable growth.
Quarterly Results: Is Volume Growth Accelerating?
A quarter becomes more useful when compared with the preceding reports. All growth rates below are year over year, not sequential changes.
| Quarter | Net revenue, rounded | Unit cases | Concentrate sales | Price/mix | Organic revenue | Comparable EPS |
|---|---|---|---|---|---|---|
| Q1 2026 | $12.5 billion | +3% | +8% | +2% | +10% | $0.86 |
| Q2 2026 | $13.4 billion | +5% | +4% | +2% | +6% | $0.97 |
| Q3 2026 | $13.4 billion | +5% | +7% | +1% | +7% | $0.91 |
Sources: Q1 results, Q2 results and Q3 results. Comparable EPS and organic growth are non-GAAP.
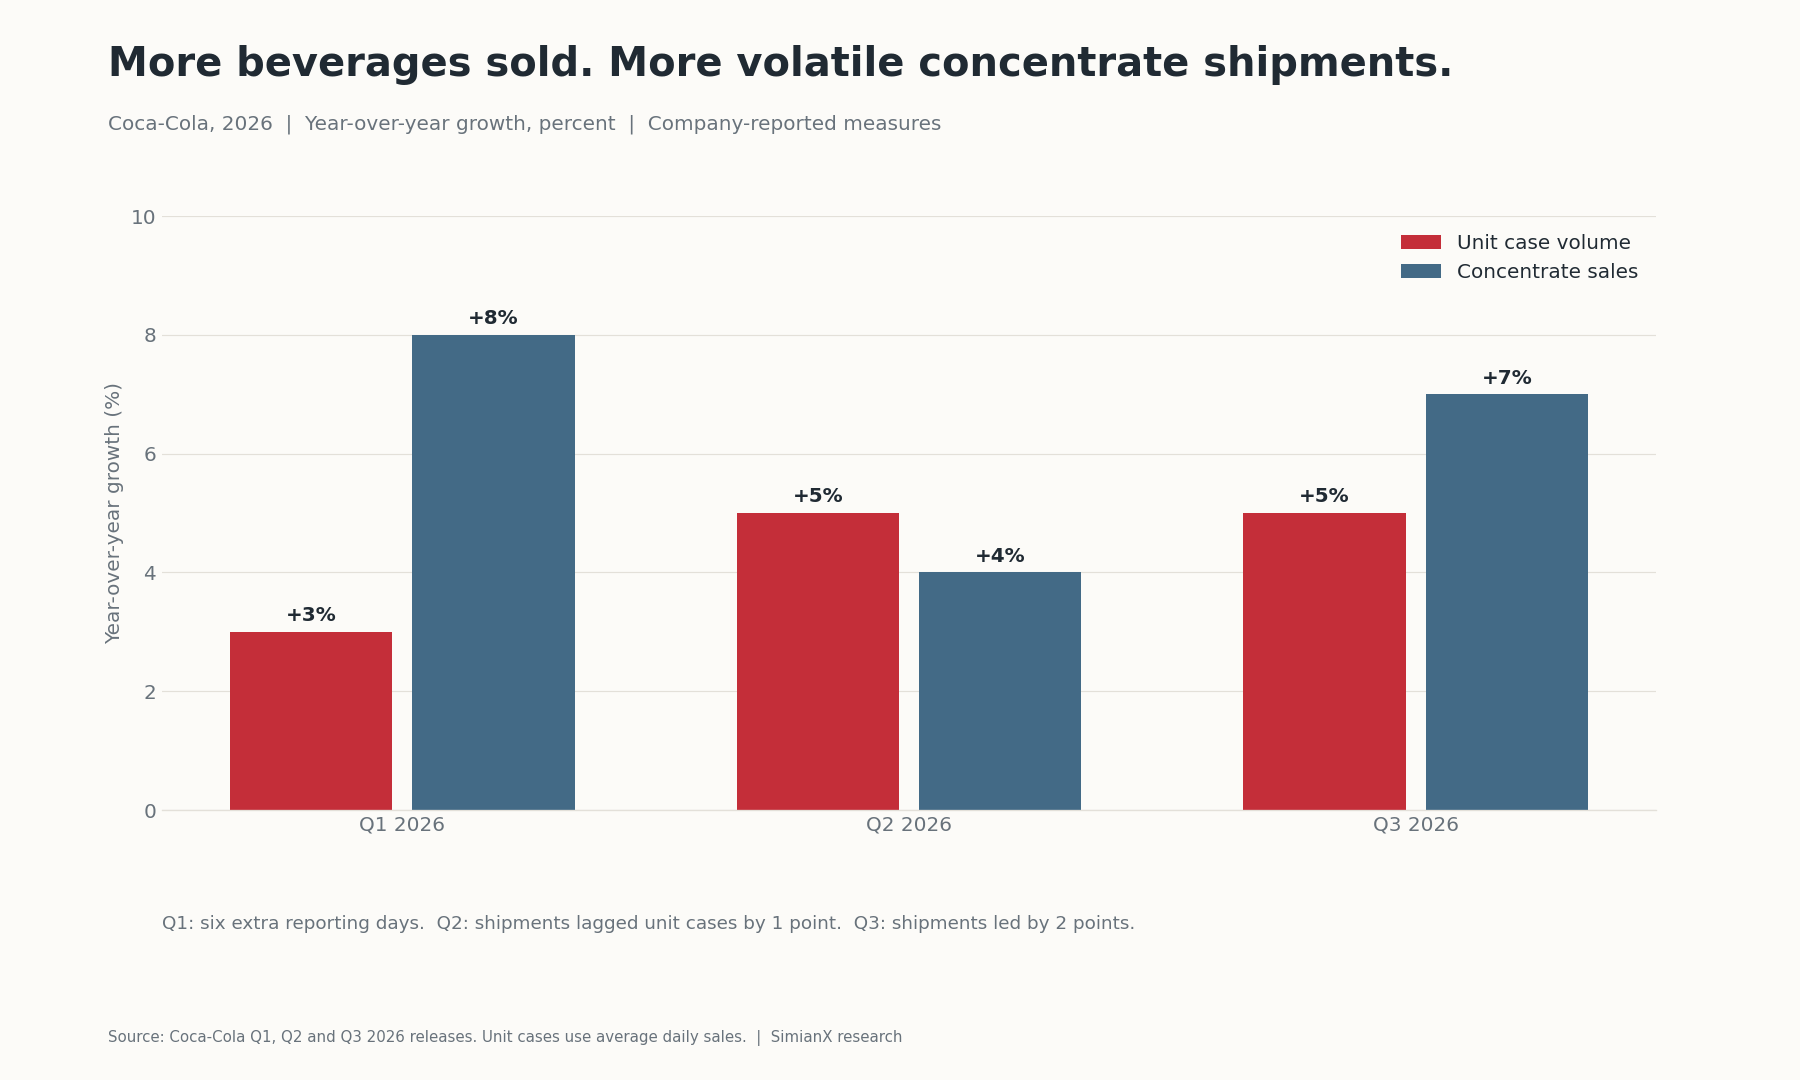
Volume growth accelerated from Q1 to Q2, then held at 5% in Q3. Calling the latest quarter a fresh acceleration would overstate the sequence. Pricing contributed less, suggesting a healthier balance between physical growth and monetization, while also making profitable mix more important.
Concentrate sales tell a noisier story: +8%, +4%, then +7%. Q1 had six additional reporting days, Q2 shipments lagged unit cases by 1 point, and Q3 shipments led by 2 points. Averaging the three percentages would not produce a valid annual growth rate because the quarterly bases and calendar effects differ.
Why Concentrate Shipments Are Not Consumer Purchases
Coca-Cola’s parent company sells concentrates and syrups while bottling partners perform much of the manufacturing and distribution. The Coca-Cola system therefore has two operating clocks.
Concentrate purchases reflect bottlers’ ordering and inventory decisions. Unit case volume measures finished beverage volume sold through the system and is calculated using average daily sales. It is closer to underlying demand, but it is not a comprehensive checkout-by-checkout measure of household spending.
If bottlers order ahead of a promotion, parent-company shipments can rise before the corresponding beverage sales. Later inventory consumption can weaken concentrate orders even when demand remains healthy. The Q3 release explicitly attributes the 2-point shipment lead to timing. It does not establish that the same boost will recur.
The analytical rule is simple: compare shipments with unit cases across several periods, then examine profit and cash conversion. A shipment reversal alone does not disprove demand strength; persistent shipment growth without corresponding unit cases is a reason to investigate inventory.
Regional Demand: Four Different Consumer Stories
| Region | Unit case growth | Price/mix | Organic revenue growth | Value-share disclosure |
|---|---|---|---|---|
| Europe, Middle East & Africa | +5% | +1% | +7% | Lost share overall |
| Latin America | +6% | +7% | +16% | Gained share |
| North America | 0% | +1% | +3% | Gained share |
| Asia Pacific | +6% | −2% | +6% | Gained share |
Source: Q3 regional operating review. Organic revenue also reflects concentrate shipments; it is not simply unit case growth plus price/mix. Rounded figures need not reconcile arithmetically.
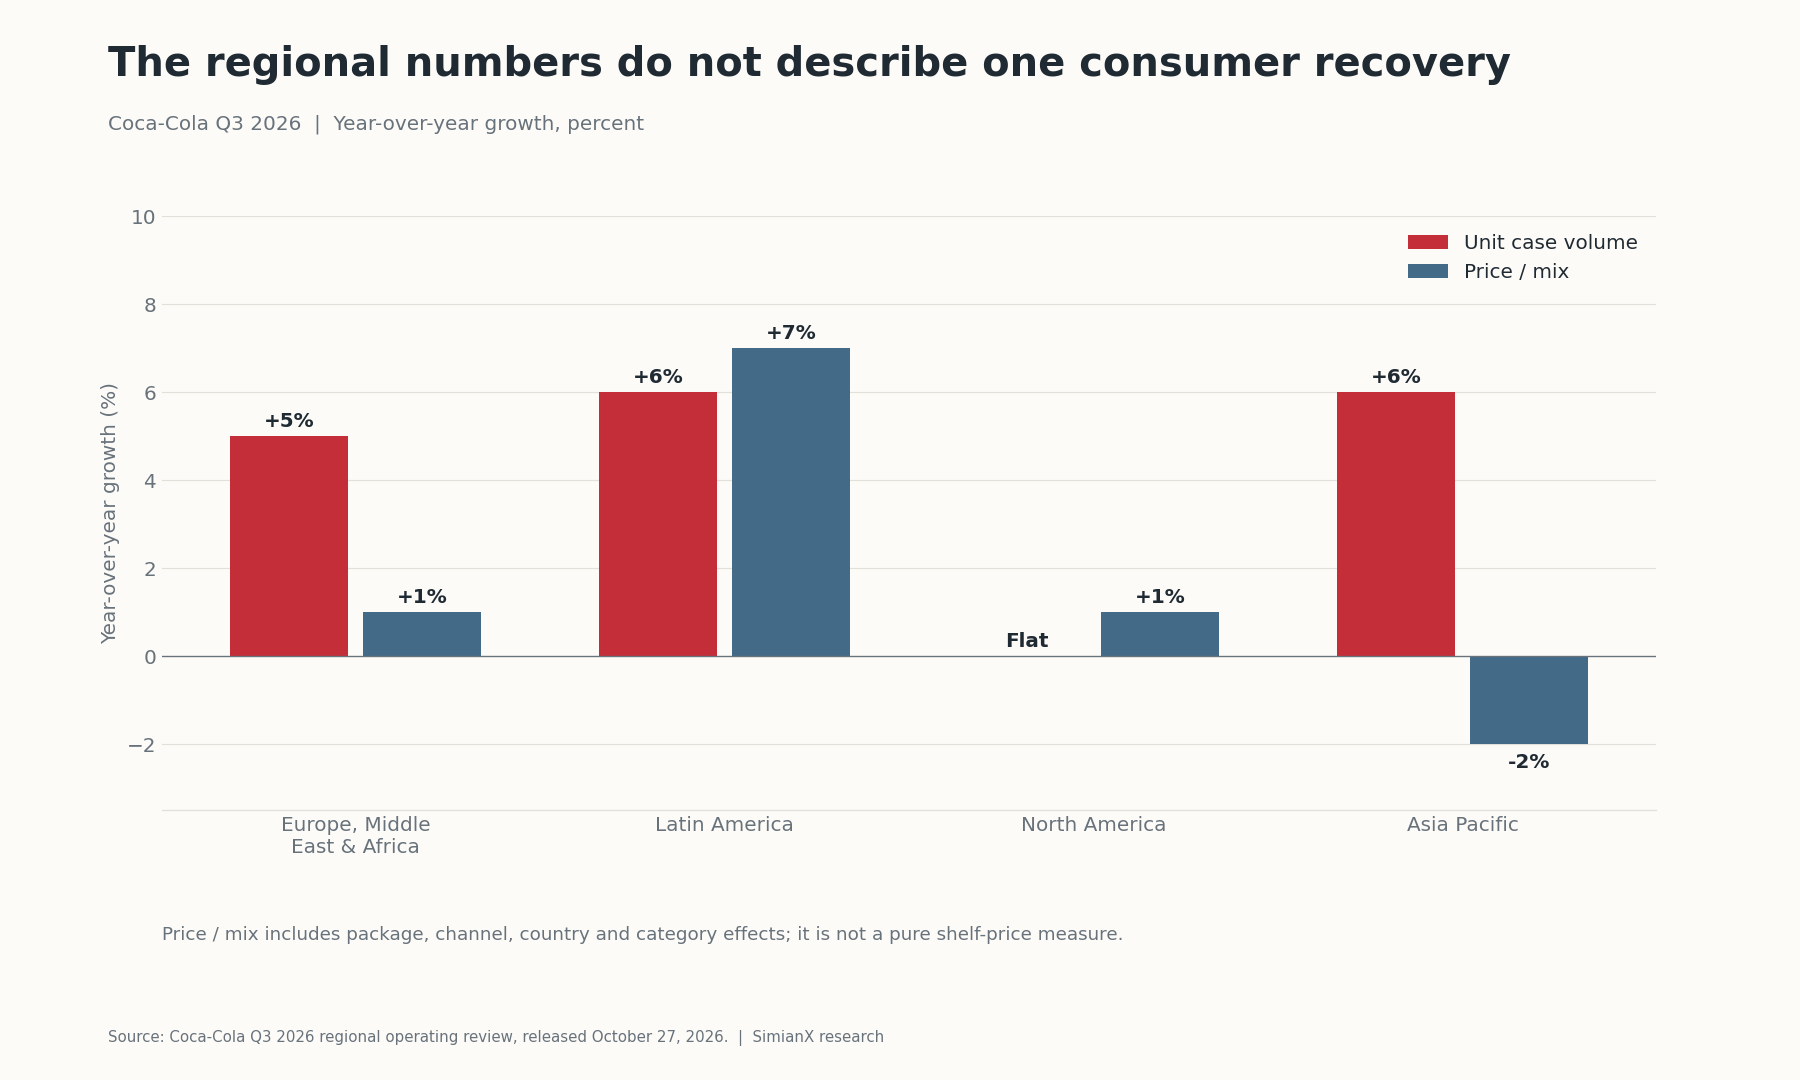
North America is the most direct objection to a broad U.S. recovery claim: volume was flat even as Coca-Cola gained value share. The company can outperform competitors without the category or household budgets expanding rapidly. The Walmart and Target consumer-stress framework explains why company results need to be checked against traffic, mix and spending capacity.
Asia Pacific combines strong unit case growth with negative price/mix. That can reflect country, package, category or channel composition; it does not prove a uniform cut in shelf prices. Affordability initiatives may retain customers while reducing revenue per unit. The next test is whether the additional volume produces attractive system profit after marketing and distribution costs.
Latin America combines volume and pricing strength, but local inflation and currency translation complicate any inference about real purchasing power. Its 25% reported revenue increase included a 9-point currency tailwind; organic growth was 16%.
EMEA shows the opposite attribution problem: volume rose 5%, yet value share declined overall, with losses in France and the United Kingdom outweighing gains in Nigeria and Morocco. Growth is not automatically evidence of share gains, just as share gains are not automatically evidence of category growth.
Brand Power: Availability, Affordability and Zero Sugar
Brand recognition earns consideration; cold availability, reliable replenishment, restaurant relationships and suitable packaging turn it into purchases. A challenger needs access to those occasions as well as consumer awareness. That distribution network is a plausible explanation for company-specific resilience, rather than proof that every consumer feels wealthier.
Small packages can lower the cash required for a purchase while carrying a higher price per liter. Premium offerings serve different occasions. Both can coexist, but neither guarantees profitable growth: bottlers and retailers also need adequate returns to maintain equipment, routes and shelf space.
Coca-Cola Zero Sugar grew 16%, compared with 5% for Trademark Coca-Cola. Water grew 8%, sports drinks declined 3%, and coffee and tea were flat. Those differences matter more than a generic claim that every category is booming. Source: company brand and category disclosures.
Zero Sugar can protect the franchise when an existing customer changes formulation; it can also recruit new consumers. Public growth figures do not isolate those effects. Its success supports adaptation, while total portfolio volume, margins and cash flow determine whether adaptation creates incremental shareholder value.
What Would Establish a Broader Consumer Recovery?
The evidence should come from independent sources rather than repeated observations of one company.
| Test | Evidence favoring broad recovery | Evidence favoring company execution |
|---|---|---|
| Category demand | Beverage volumes rise across suppliers | Coca-Cola grows while peers stagnate |
| Household finances | Sustained improvement in real spending power | Growth relies on smaller entry-price packages |
| Consumption occasions | Restaurant and convenience traffic broadens | Gains concentrate in selected channels |
| Pricing economics | Volume and profitable mix improve together | Volume requires heavier promotions |
| Geography | Improvement spans mature and emerging markets | Growth remains regionally uneven |
This is an analytical checklist, not a statistical decomposition. Company growth can reflect category growth and share changes simultaneously. Relevant U.S. cross-checks include BEA personal income and outlays and Census retail sales. Their periods and definitions must match the claim being tested; Coca-Cola’s results cannot substitute for them.
The comparison with P&G’s earnings and volume history is useful because both companies sell recurring consumer products. Different categories, regional exposure and reporting calendars prevent a direct one-for-one comparison.
The Guidance Upgrade: Earnings and Cash Matter Most
| Full-year 2026 measure | Previous outlook | October 27 outlook |
|---|---|---|
| Organic revenue growth | Approximately 5% | At least 5% |
| Comparable currency-neutral EPS growth excluding acquisitions/divestitures | 7%–8% | At least 9% |
| Comparable EPS growth | 9%–10% | At least 11% |
| Underlying effective tax rate | 19.9% | 19.7% |
| Operating cash flow | Approximately $14.6 billion | At least $15.2 billion |
| Capital expenditures | Approximately $2.2 billion | Approximately $2.2 billion |
| Free cash flow | Approximately $12.4 billion | At least $13.0 billion |
Source: current-versus-prior guidance table. Growth measures other than operating cash flow are presented on the company’s stated non-GAAP bases where applicable.
The revenue change mainly strengthens the floor. Underlying EPS and cash-flow upgrades carry more weight because they indicate improvement beyond currency translation. The tax-rate reduction also helps earnings, so the entire increase should not be attributed to operating leverage.
The $0.6 billion increase in the cash-flow floor comes from higher expected operating cash flow, with capital expenditure guidance unchanged. The company’s $3.00 comparable EPS in 2025 implies a 2026 floor of $3.33 = $3.00 × 1.11. This is a calculation from guidance, not a separate management EPS target or 2027 consensus. Source: 2025 results.
Cash Flow and Dividends: Coverage With Limits
Through nine months, operating cash flow was $12.471 billion and property, plant and equipment purchases were $1.063 billion. Subtracting them gives $11.408 billion of free cash flow, matching the rounded $11.4 billion headline. Nine-month cash flow must not be compared directly with a full-year dividend requirement without identifying the different periods. Source: cash-flow statement.
The year-over-year comparison also needs care. Full-year 2025 free cash flow was $5.3 billion, but $11.4 billion excluding the fairlife contingent consideration payment. Comparing the 2026 floor with the unadjusted 2025 number would exaggerate recurring growth. Even the adjusted comparison is not a clean forecast of sustainable growth because working capital and other timing effects can change.
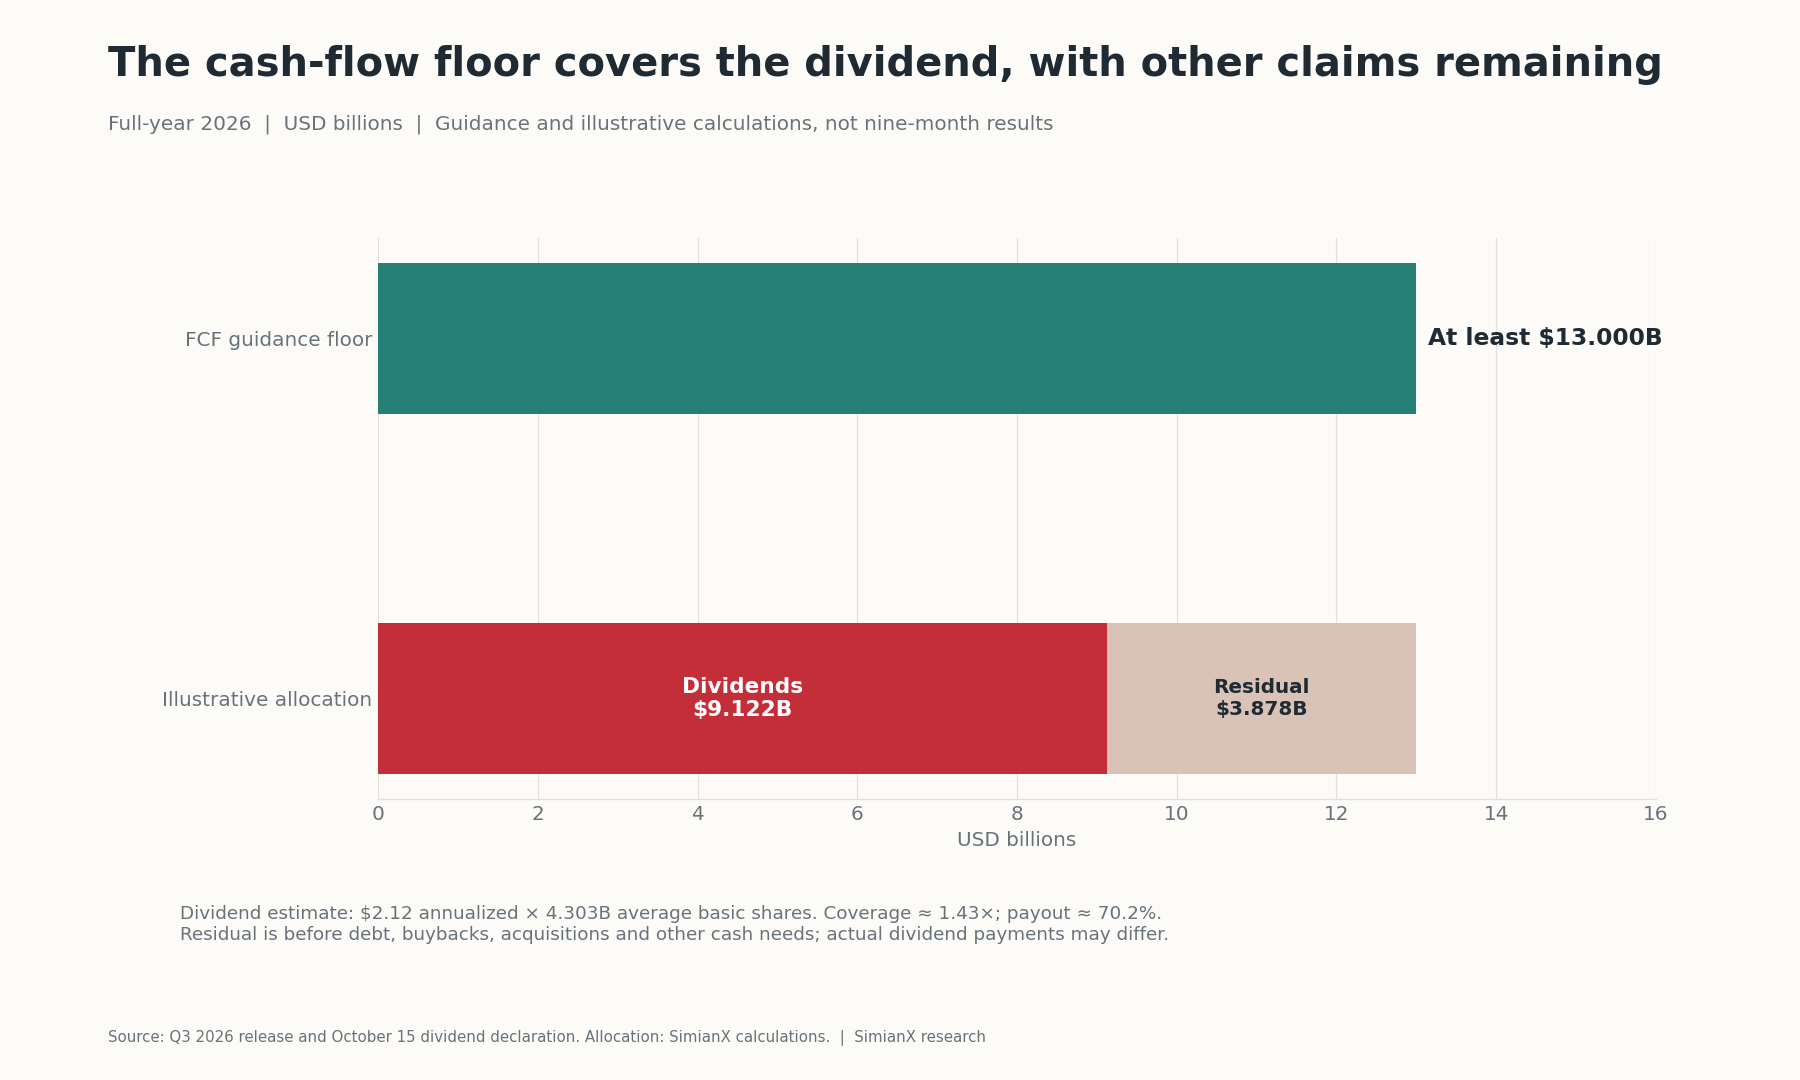
The October dividend declaration maintains $0.53 quarterly, or $2.12 annualized. Using Q3’s 4.303 billion average basic shares as an approximate share base:
| Calculation | Result | Interpretation |
|---|---|---|
| Annualized dividend × share base | $9.122 billion | Estimated annual cash requirement |
| Dividend requirement / $13.0B FCF floor | 70.2% | Approximate cash payout |
| $13.0B FCF floor / dividend requirement | 1.43× | Approximate coverage |
| FCF floor less dividend requirement | $3.878 billion | Before other uses of cash |
| $2.12 / $91.18 | 2.33% | Starting dividend yield |
These are calculations, not company dividend-spending guidance. The average share base differs from the actual shares entitled to each payment. Residual cash must accommodate debt, buybacks, acquisitions and other commitments. Dividend coverage supports durability; it does not establish that the stock is cheap.
KO Valuation: What Does $91.18 Already Assume?
KO closed at $91.18 on October 27, down 1.64% from $92.70. That price is the dated input for the following calculations. The decline does not identify a single market motive or prove that investors rejected the operating results. Source: historical closes.
| Valuation measure | Calculation | Result |
|---|---|---|
| Current-year comparable P/E at guidance floor | $91.18 / $3.33 | 27.4× |
| Comparable earnings yield | $3.33 / $91.18 | 3.65% |
| Approximate equity value | $91.18 × 4.303B shares | $392.35 billion |
| Equity FCF yield at guidance floor | $13.0B / $392.35B | 3.31% |
The equity-value estimate uses average basic shares, not the precise closing shares outstanding; it is suitable for an approximate yield calculation. Equity free-cash-flow yield is not enterprise-value yield. The earnings multiple uses adjusted current-year guidance, not trailing GAAP earnings.
A premium may be defensible for brand durability and relatively modest parent-company capital needs. But the bottling model does not remove production and distribution costs from the economic system; it places many of them at partners. Comparisons with PepsiCo need to account for its food businesses and different consolidation structure.
At this starting valuation, growth must compensate for the possibility of a lower future multiple.
Three-Year Return Scenarios: Growth Can Lose to Valuation
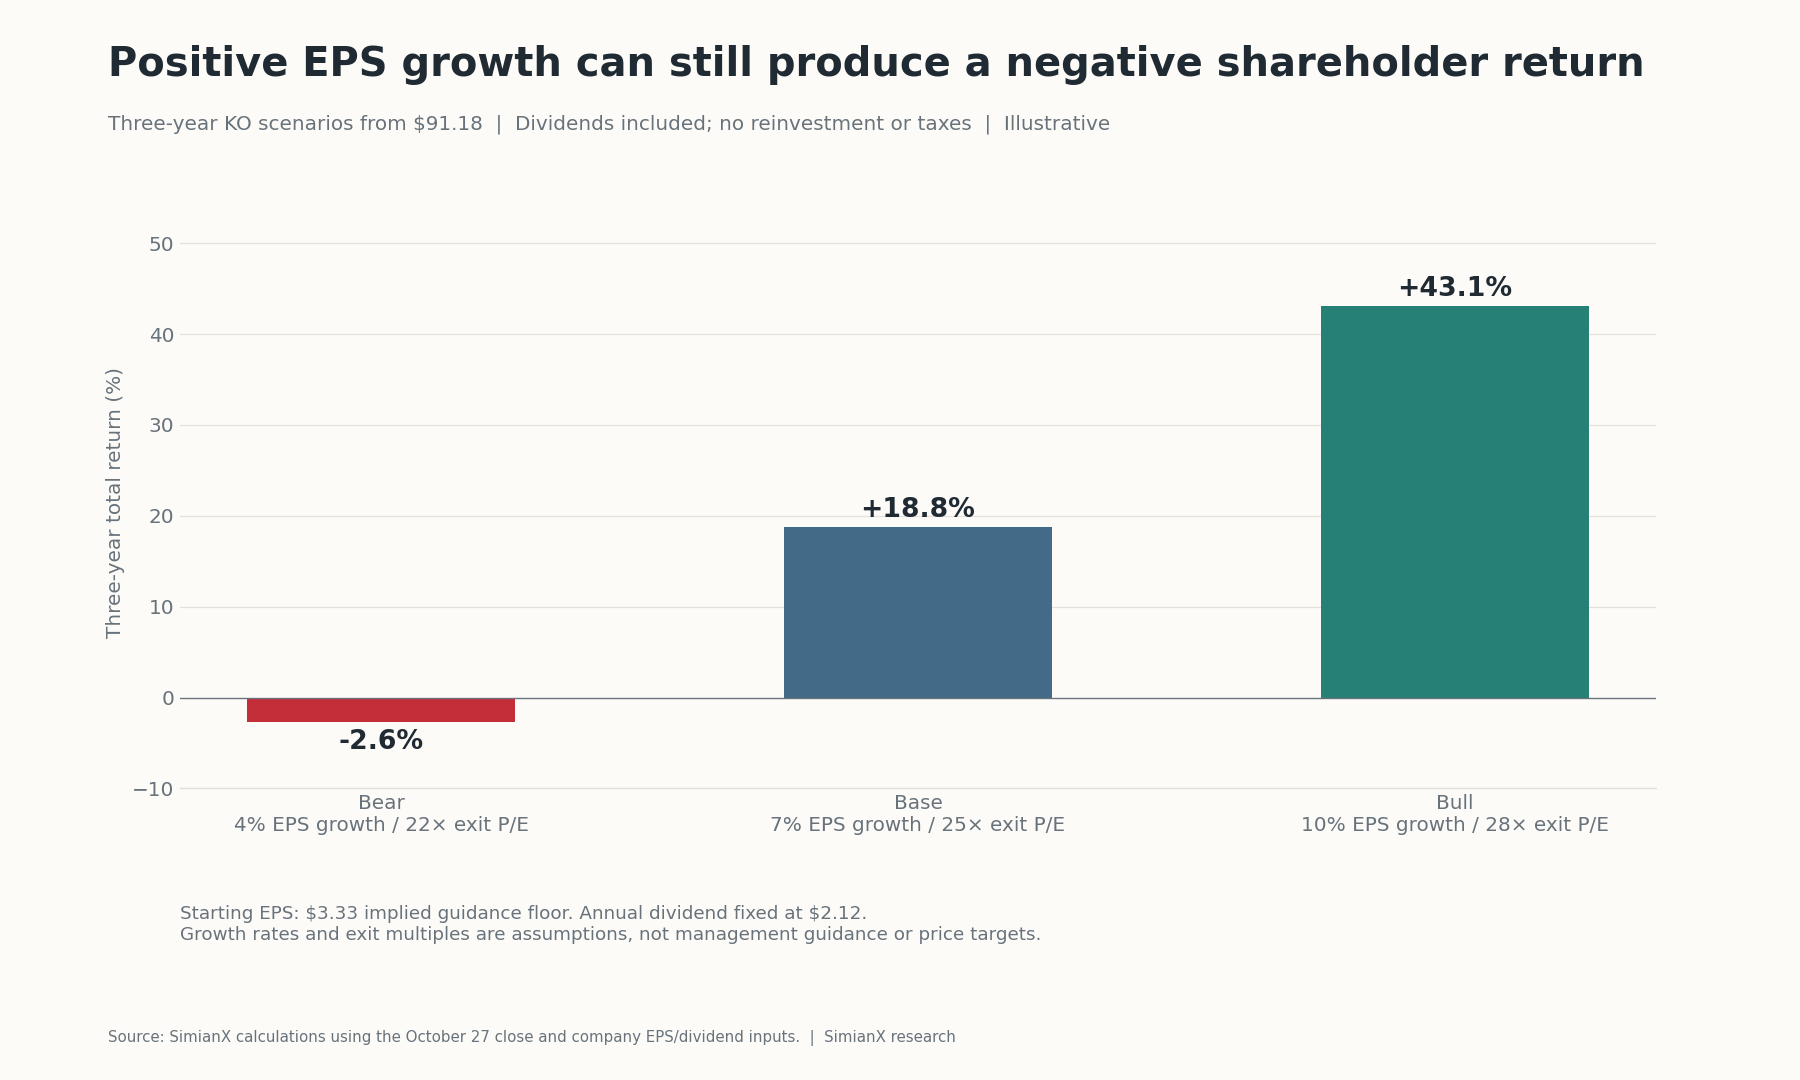
The model begins with $3.33, compounds EPS for three years, applies an exit multiple, and adds $6.36 of dividends, assuming $2.12 annually with no reinvestment or tax. All assumptions are illustrative; none is management guidance.
| Scenario | Annual EPS growth | Year-three EPS | Exit P/E | Exit share value | Total return including dividends | Annualized total return |
|---|---|---|---|---|---|---|
| Bear | 4% | $3.75 | 22× | $82.41 | −2.6% | −0.9% |
| Base | 7% | $4.08 | 25× | $101.98 | +18.8% | +5.9% |
| Bull | 10% | $4.43 | 28× | $124.10 | +43.1% | +12.7% |
Calculations retain unrounded EPS internally. Formula: total return = (exit share value + cumulative dividends) / $91.18 − 1; annualization takes the cube root of the resulting wealth multiple.
The bear case demonstrates the central risk: positive EPS growth can coexist with a negative total return. In the base case, a three-year return requirement of 8% annually would imply an entry price around $86.01 ≈ ($101.98 + $6.36) / 1.08³, assuming all cash is received at the end for this simplified calculation. That is a sensitivity result, not a recommendation or intrinsic-value estimate.
What Could Change the Thesis in Q4 and 2027?
Watch evidence that can disprove the argument, rather than only numbers that confirm it.
- Demand: sustained North American volume growth and broader peer improvement would strengthen the recovery interpretation. Weakening unit cases despite strong shipments would undermine it.
- Economics: volume growth alongside falling currency-neutral profitability or weaker cash conversion would weaken the claim of profitable execution.
- Calendar: Q4 has six fewer reporting days than Q4 2025. Unit case growth uses average daily sales, so revenue and unit cases are affected differently.
- Portfolio: the company flags an approximately 8% acquisition/divestiture headwind to 2027 comparable revenue and approximately 2% to comparable EPS, plus slight currency headwinds. These are preliminary considerations, not full 2027 guidance. A consolidation-related revenue decline would not automatically imply falling beverage demand.
- Capital and tax: marketing, packaging and input-cost needs can absorb volume benefits. The ongoing IRS dispute remains a separate risk; prior cash payments should not be treated as resolution of every later year. Check the latest quarterly filings before updating the cash or tax thesis.
Source for calendar and 2027 considerations: Q3 outlook disclosures. Revisit this page after the full-year report, a material tax development or a significant change in the share price.
Frequently Asked Questions
What were Coca-Cola’s Q3 2026 earnings?
Revenue was $13.380 billion, GAAP diluted EPS was $0.93 and comparable EPS was $0.91. Global unit case volume grew 5% and organic revenue grew 7%; comparable EPS and organic revenue are non-GAAP measures.
Does 5% volume growth prove a consumer recovery?
No. North American volume was flat, regional mix differed and company execution can improve sales without a broad increase in household spending power. Category data and independent consumption indicators are needed to support that claim.
Why did concentrate sales grow faster than unit cases?
Management attributed the Q3 2-point lead to shipment timing. Bottlers’ concentrate orders and finished-beverage sales follow different clocks. A temporary gap can reverse without a matching change in underlying demand.
What is Coca-Cola’s 2026 EPS guidance?
The company expects comparable EPS growth of at least 11% from $3.00 in 2025. That implies a floor near $3.33 by calculation. It is an adjusted current-year figure, not a 2027 forecast or guaranteed outcome.
Is Coca-Cola’s dividend covered by free cash flow?
The $13.0 billion FCF floor exceeds an estimated $9.122 billion annualized dividend requirement, giving roughly 1.43 times coverage. The estimate uses Q3 average basic shares; actual payments and other cash needs can differ.
Is KO stock cheap at $91.18?
That dated price represents about 27.4 times the implied comparable EPS floor and a 3.31% equity FCF yield. Whether the price offers an adequate return depends on future growth, distributions and the multiple investors will pay later.
Does Coca-Cola have full 2027 guidance yet?
The Q3 release gives preliminary currency and portfolio considerations and says full guidance will accompany Q4 results. Its projected consolidation headwinds should not be confused with a forecast for consumer beverage volumes.
Using the Evidence
The business thesis is stronger: volume is growing, the portfolio is adapting, and management raised earnings and cash-flow floors. The broad recovery thesis remains incomplete because regional demand and mix diverge. The investment thesis is price-sensitive because a premium multiple can absorb years of operating progress.
Use SimianX’s stock analysis tools to compare those competing assumptions against fresh filings. Keep unit cases, shipment timing, currency-neutral earnings and cash flow separate; then rerun the valuation at the price actually available.
Related Reading
- P&G Earnings by Quarter: Why PG Jumped 5.6% as AI Sank
- Walmart & Target 2026: Decoding US Consumer Stress Signals
References
- Coca-Cola — Q3 2026 earnings release
- Coca-Cola — filed financial statements and guidance reconciliations
- Coca-Cola — Q1 2026 results
- Coca-Cola — Q2 2026 results
- Coca-Cola — full-year 2025 results and fairlife cash-flow adjustment
- Coca-Cola — bottling system
- Coca-Cola — October 2026 dividend declaration
- Coca-Cola — quarterly SEC filings and tax disclosures
- Stock Analysis — KO historical closes
- BEA — personal income and outlays
- U.S. Census Bureau — retail trade data