
 By Muke
Why P&G Stock Jumped 5.6% on October 22, 2026: Earnings, Volume and the AI Selloff
Quick answer: Procter & Gamble (PG) closed at $165.59 on October 22, 2026, up $8.75 or 5.58%, its highest close since February 27, while the Nasdaq Composite fell 2.60% and the S&P 500 fell 1.21%. P&G's fiscal first quarter of 2027 (July–September 2026) delivered core EPS of $2.00 against a $1.89 consensus, net sales of $23.28 billion (+4%), organic sales growth of 4% and organic volume growth of 2.4%, the strongest volume figure in the nine quarters tracked below. The same day, Meta's negative free cash flow and $135–145 billion capex plan pushed investors out of AI stocks. P&G kept its core EPS guidance of $6.89–$7.11 even though it now expects a $1.4 billion after-tax commodity headwind, up from $1 billion. At $165.59 the stock traded at 23.7 times the $7.00 guidance midpoint, up from 22.4 times the day before.
Why P&G stock jumped on October 22, 2026, comes down to a timely combination: better-than-expected consumer demand, dependable cash generation and a market suddenly less comfortable financing the AI boom.
The divergence was striking, but the explanation requires more than calling toothpaste and detergent "safe." P&G supplied fresh operating evidence on a day when investors were questioning how quickly enormous technology investments would produce returns.
For readers of SimianX AI, the useful investment question is whether this was a brief defensive trade or the beginning of a more durable change in market leadership. This page answers it with primary filings: P&G's results by quarter since fiscal 2025, its cash returns by year since fiscal 2019, the guidance changes, and what the new share price implies.
Our assessment: P&G earned its rally through stronger sales quality, while the technology selloff amplified it. However, the resulting valuation leaves less room for disappointment.
The company's shares rose much faster than its underlying earnings. That makes the distinction between a stronger business outlook and a more expensive stock especially important.
Research date: October 23, 2026 (U.S. Pacific). All P&G figures come from the fiscal 2027 first-quarter earnings release (Form 8-K, Exhibit 99.1, filed October 22, 2026), the Form 10-Q and earlier P&G releases on SEC EDGAR. P&G's fiscal year ends June 30, so "fiscal Q1 2027" means July–September 2026. Prices are regular-session closes from Nasdaq and CNBC. Scenario calculations are SimianX calculations, illustrative rather than price forecasts, and not investment advice.
Source: P&G fiscal 2027 first-quarter results, SEC Form 8-K Exhibit 99.1 (filed October 22, 2026)
P&G Fiscal Q1 2027 at a Glance
| Metric | Fiscal Q1 2027 (Jul–Sep 2026) | Fiscal Q1 2026 (Jul–Sep 2025) | Change |
|---|---|---|---|
| Net sales | $23,276 million | $22,386 million | +4.0% |
| Organic sales growth | 4.0% | 2% | — |
| Organic volume | +2.4% | 0% | — |
| Core gross margin | 50.0% | 51.5% | −150 bp |
| Core operating margin | 25.9% | 26.7% | −80 bp |
| Net earnings | $4,757 million | $4,781 million | −1% |
| Diluted EPS (GAAP) | $1.97 | $1.95 | +1% |
| Core EPS | $2.00 | $1.99 | +1% |
| Operating cash flow | $5,767 million | $5,408 million | +6.6% |
| Capital expenditures | $1,366 million | $1,200 million | +13.8% |
| Free cash flow | $4,401 million | $4,208 million | +4.6% |
| Dividends paid | $2,603 million | $2,549 million | +2.1% |
| Share repurchases | $1,250 million | $1,250 million | 0% |
Source: P&G earnings release, Form 8-K Exhibit 99.1. Free cash flow is operating cash flow minus capital expenditures, as P&G defines it; percentage changes in the last column for cash items are SimianX calculations.
What Happened When P&G Rose and AI Stocks Fell?
The session showed substantial disagreement beneath the major indexes.
The S&P 500 declined 1.21% to 7,663.43 and the Nasdaq Composite fell 2.60% to 26,008.86, while the Dow Jones Industrial Average finished essentially unchanged at 52,867.98 (+0.02%). That pattern is consistent with a concentrated technology selloff rather than indiscriminate liquidation across the entire market. Source: Cboe market review.
Consumer companies participated broadly:
| Stock, fund or index | October 21 close | October 22 close | October 22 move |
|---|---|---|---|
| Procter & Gamble (PG) | $156.84 | $165.59 | +5.58% |
| Kimberly-Clark (KMB) | $106.64 | $112.32 | +5.32% |
| Clorox (CLX) | $84.77 | $88.66 | +4.59% |
| Colgate-Palmolive (CL) | $93.40 | $97.39 | +4.27% |
| Church & Dwight (CHD) | $105.00 | $108.86 | +3.68% |
| Consumer Staples Select Sector SPDR (XLP) | $87.11 | $89.99 | +3.31% |
| PepsiCo (PEP) | $134.70 | $138.83 | +3.07% |
| Coca-Cola (KO) | $92.68 | $95.34 | +2.87% |
| Dow Jones Industrial Average | 52,856.09 | 52,867.98 | +0.02% |
| S&P 500 | 7,757.17 | 7,663.43 | −1.21% |
| Microsoft (MSFT) | $532.95 | $521.08 | −2.23% |
| Nasdaq Composite | 26,702.86 | 26,008.86 | −2.60% |
| Technology Select Sector SPDR (XLK) | $188.54 | $182.34 | −3.29% |
| Nvidia (NVDA) | $221.97 | $212.21 | −4.40% |
| Meta Platforms (META) | $697.52 | $648.85 | −6.98% |
Sources: Nasdaq historical prices for stocks and funds, CNBC for index closes; moves are SimianX calculations from the closes. KMB is rounded to the cent.
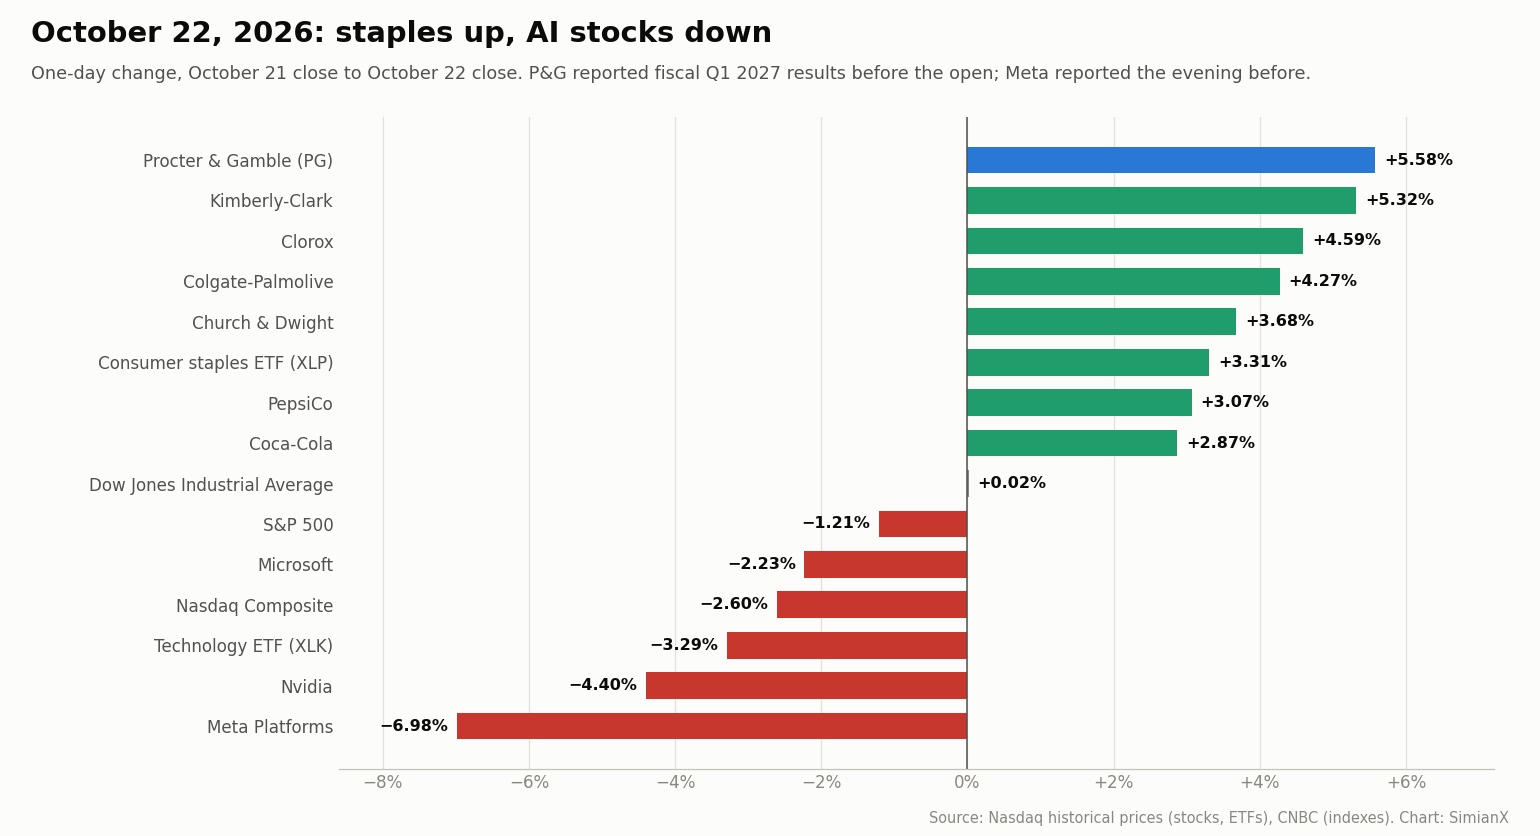
The consumer staples fund (XLP) and the technology fund (XLK) moved almost exactly opposite, +3.31% and −3.29%. P&G's volume was 22.0 million shares, more than double the roughly 10 million of the previous sessions. The pattern supports a rotation interpretation: investors were willing to own equities, but they preferred different kinds of earnings exposure.
However, daily price changes cannot establish exactly how much money moved directly from AI stocks into consumer staples. Confirming that would require fund-flow and portfolio-positioning data.
A careful description is that price performance was consistent with defensive rotation, strengthened by P&G's own earnings announcement.
The next session gave part of it back. On October 23 P&G closed at $161.02 (−2.76%), but that was also the ex-dividend date for the $1.0885 quarterly dividend, so about $1.09 of the $4.57 decline was a mechanical adjustment. Other staples fell on October 23 too (Coca-Cola −2.8%, Colgate-Palmolive −3.4%), while the Nasdaq slipped another 0.2%.
Why Did P&G's Earnings Beat Matter So Much?
P&G reported results for its fiscal first quarter of 2027, covering July through September 2026. This is different from a calendar-year first quarter.
The importance lies in the comparison with expectations. The consensus forecast for core EPS was $1.89, so the reported $2.00 was a 5.8% surprise, the largest in at least four quarters:
| Quarter reported | Core EPS | Consensus forecast | Surprise |
|---|---|---|---|
| Fiscal Q2 2026 (January 22, 2026) | $1.88 | $1.87 | +0.5% |
| Fiscal Q3 2026 (April 24, 2026) | $1.59 | $1.56 | +1.9% |
| Fiscal Q4 2026 (July 29, 2026) | $1.43 | $1.41 | +1.4% |
| Fiscal Q1 2027 (October 22, 2026) | $2.00 | $1.89 | +5.8% |
Source: Nasdaq earnings surprise data for PG; core EPS figures match P&G's releases.
That explains how a company growing core EPS only 1% could enjoy a large stock-price increase.
Stocks respond to the gap between expectations and outcomes. Investors had already discounted a difficult environment for branded consumer goods: P&G's organic sales growth had slowed to 1% in fiscal 2026 and to 0% in two of its four quarters. A quarter showing healthier demand reduced the probability of a worse earnings path.
The rally reflected relief about demand and earnings resilience, rather than a sudden transition to rapid profit growth.
Was P&G's Growth Driven by Higher Prices or More Products Sold?
This is the most useful question in the report.
Consumer companies can increase revenue by raising prices, selling more units or shifting customers toward more expensive products. Those sources of growth have different implications.
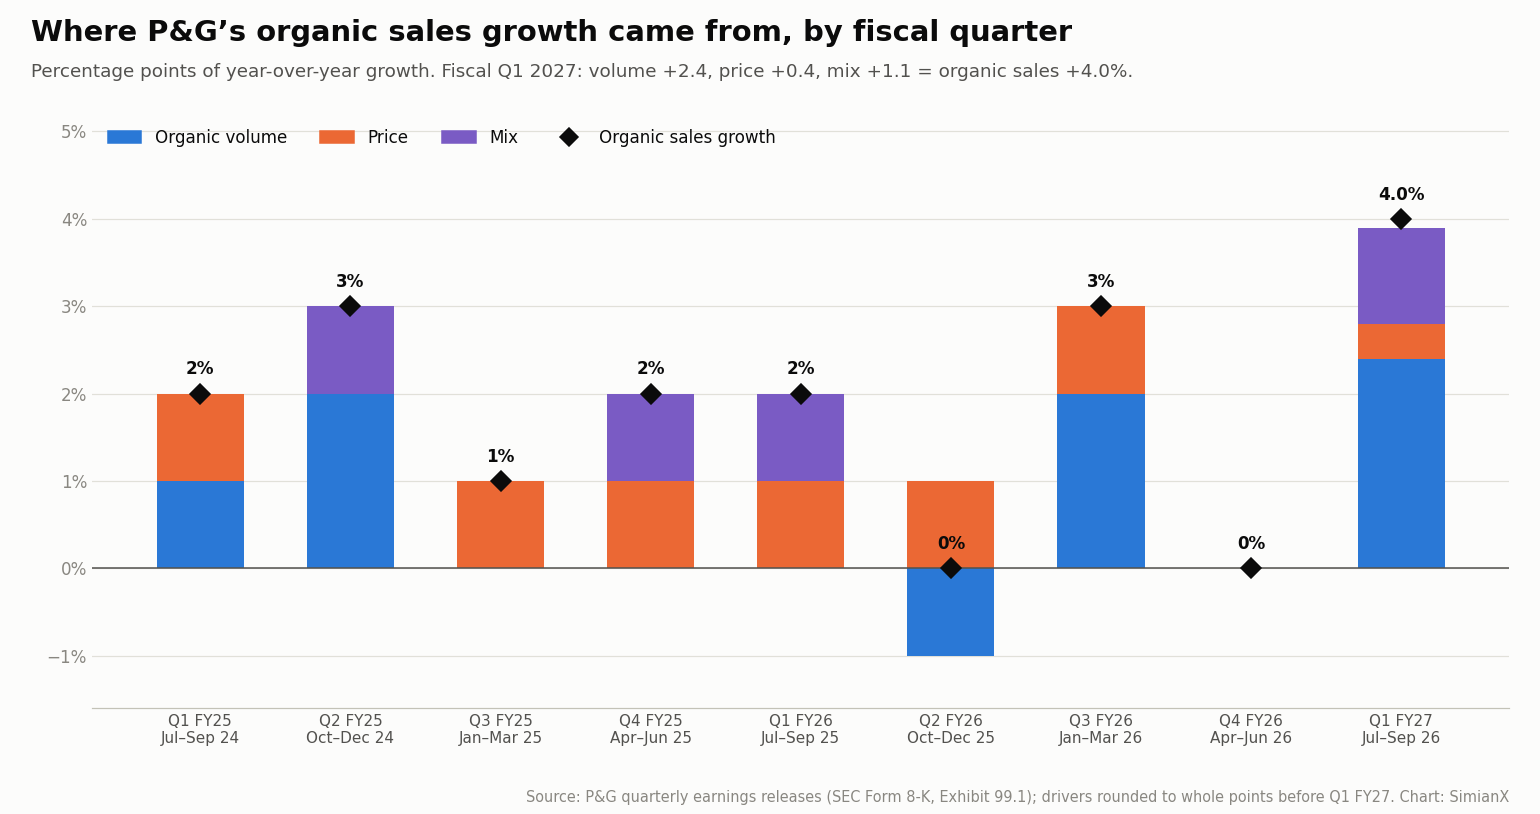
P&G's sales bridge for the quarter showed:
- 2.4 percentage points from volume
- 0.4 percentage points from pricing
- 1.1 percentage points from product and geographic mix
- 0.0 percentage points from foreign exchange and from acquisitions and divestitures
The components reconcile to 4.0% growth after rounding. Source: P&G earnings release.
The modest contribution from pricing made the result more encouraging. Consumers were purchasing more product rather than simply paying more for an unchanged basket.
By segment, the volume came mostly from Fabric & Home Care, P&G's largest business:
| Segment | Net sales (Q1 FY2027) | Net sales growth | Organic sales growth | Organic volume | Price | Mix | Net earnings change |
|---|---|---|---|---|---|---|---|
| Fabric & Home Care | $8,205 million | +4.2% | +4.8% | +4.3% | −0.3% | +0.8% | +3% |
| Baby, Feminine & Family Care | $5,322 million | +2.9% | +3.0% | +2.3% | −1.2% | +1.8% | −4% |
| Beauty | $4,410 million | +6.4% | +5.4% | +2.2% | +0.7% | +2.5% | −1% |
| Health Care | $3,318 million | +3.1% | +2.7% | −2.9% | +2.8% | +2.8% | +9% |
| Grooming | $1,889 million | +4.0% | +4.5% | −0.4% | +3.5% | +1.5% | +3% |
| Total P&G | $23,276 million | +4.0% | +4.0% | +2.4% | +0.4% | +1.1% | −1% |
Source: P&G earnings release. Total net sales include $132 million in Corporate.
Fabric Care and Home Care both grew volume in North America and Europe, and Baby Care grew volume in Greater China and North America, partly by lowering prices in North America. Health Care and Grooming grew through pricing and mix while their volumes fell.
For a branded manufacturer, volume recovery can indicate that product innovation, merchandising and marketing are connecting with customers. It can also improve factory utilization and spread fixed expenses over more units.
Still, volume growth alone does not prove stronger economics.
A company can increase shipments through discounts, promotions or retailer inventory replenishment. P&G itself cited "trade investments" in Personal Care and "merchandising investments" in Family Care, and its gross margin absorbed 140 basis points of product reinvestment. Investors need to assess whether those additional units generate sufficient profit.
How P&G's Organic Growth Has Been Built, Quarter by Quarter
| Fiscal quarter (months) | Organic volume | Price | Mix | Organic sales growth | Net sales growth |
|---|---|---|---|---|---|
| Q1 FY2025 (Jul–Sep 2024) | +1% | +1% | 0% | +2% | −1% |
| Q2 FY2025 (Oct–Dec 2024) | +2% | 0% | +1% | +3% | +2% |
| Q3 FY2025 (Jan–Mar 2025) | 0% | +1% | 0% | +1% | −2% |
| Q4 FY2025 (Apr–Jun 2025) | 0% | +1% | +1% | +2% | +2% |
| Q1 FY2026 (Jul–Sep 2025) | 0% | +1% | +1% | +2% | +3% |
| Q2 FY2026 (Oct–Dec 2025) | −1% | +1% | 0% | 0% | +1% |
| Q3 FY2026 (Jan–Mar 2026) | +2% | +1% | 0% | +3% | +7% |
| Q4 FY2026 (Apr–Jun 2026) | 0% | 0% | 0% | 0% | +2% |
| Q1 FY2027 (Jul–Sep 2026) | +2.4% | +0.4% | +1.1% | +4.0% | +4.0% |
Source: P&G quarterly earnings releases (Form 8-K, Exhibit 99.1), October 2024 to October 2026, on SEC EDGAR. P&G rounds the drivers to whole percentage points except in the latest quarter.
What Would Confirm That Volume Recovery Is Sustainable?
Three developments would strengthen the interpretation:
- Positive volume growth across several quarters.
- Stable or improving market share without excessive promotional spending.
- Better margins as higher sales absorb fixed costs.
The third point is crucial. A business can win volume while spending so aggressively that little of the improvement reaches shareholders.
P&G's report offered evidence of healthier demand, but margin pressure means the recovery remains incomplete.
P&G Earnings by Quarter and the Stock's Reaction, FY2025–FY2027
| Fiscal quarter | Report date | Net sales | Organic growth | Core EPS | Free cash flow | PG close on report day | Earnings-day move |
|---|---|---|---|---|---|---|---|
| Q1 FY2025 | Oct 18, 2024 | $21,737M | +2% | $1.93 | $3,309M | $171.28 | −0.58% |
| Q2 FY2025 | Jan 22, 2025 | $21,882M | +3% | $1.88 | $3,900M | $164.74 | +1.87% |
| Q3 FY2025 | Apr 24, 2025 | $19,776M | +1% | $1.54 | $2,846M | $159.53 | −3.74% |
| Q4 FY2025 | Jul 29, 2025 | $20,889M | +2% | $1.48 | $3,989M | $156.61 | −0.32% |
| Q1 FY2026 | Oct 24, 2025 | $22,386M | +2% | $1.99 | $4,208M | $152.49 | +0.18% |
| Q2 FY2026 | Jan 22, 2026 | $22,208M | 0% | $1.88 | $3,805M | $149.93 | +2.65% |
| Q3 FY2026 | Apr 24, 2026 | $21,235M | +3% | $1.59 | $3,026M | $148.18 | +1.70% |
| Q4 FY2026 | Jul 29, 2026 | $21,203M | 0% | $1.43 | $4,108M | $146.10 | −1.87% |
| Q1 FY2027 | Oct 22, 2026 | $23,276M | +4% | $2.00 | $4,401M | $165.59 | +5.58% |
Sources: P&G earnings releases on SEC EDGAR (free cash flow = operating cash flow minus capital expenditures for each quarter); Nasdaq historical prices. P&G reports before the U.S. market opens, so the move is the report-day close versus the prior close.
The October 22 move was the largest earnings-day gain in this nine-report window, more than double the next best (+2.65% in January 2026). Before October 2026, the shares had drifted from $171 to $146 across eight reports while organic growth stayed between 0% and 3%.
Why Did Investors Prefer Consumer Staples to AI Stocks?
The market was reassessing the relationship between growth, investment and cash returns.
AI infrastructure requires substantial spending on chips, data centers, power, networking and financing. Those investments may produce attractive long-term returns, but their timing and magnitude remain uncertain.
The trigger was Meta's third-quarter report after the close on October 21. Meta reported negative free cash flow of $2.12 billion on $32.79 billion of operating cash flow and $34.91 billion of capital expenditures (including finance-lease principal), and narrowed its 2026 capex outlook to $135–145 billion from $130–145 billion. It also announced a new non-voting Class C share. We break down Meta's spending path in Meta capex by quarter. Sources: Meta Q3 2026 results, Form 8-K Exhibit 99.1, Cboe.
Cboe linked the October 22 selloff to renewed concern over the returns on AI investment, and quoted Nvidia's CEO saying that "the demand for capital is much greater than the availability of capital." The broader pattern, in which the largest technology companies now spend most of their operating cash flow on capex, is documented in AI capex 2026.
Consumer staples offer a different investment profile.
Demand for detergent, toothpaste and household paper is generally easier to estimate than demand for a new generation of AI services. Purchase frequency, distribution relationships and established brands provide useful operating visibility. P&G spent $1.37 billion on capex in the quarter, 5.9% of sales; Meta spent $34.91 billion, 54% of its $64.60 billion in revenue.
The distinction is about the timing and uncertainty of returns:
| Investment characteristic | P&G-style consumer staples | AI infrastructure exposure |
|---|---|---|
| Demand visibility | Recurring household purchases | Rapid growth with evolving applications |
| Capital requirements | Manufacturing and distribution investment | Large spending on compute, power and facilities |
| Main uncertainty | Volume, pricing and input costs | Utilization, monetization and investment returns |
| Shareholder appeal | Cash distributions and earnings stability | Potentially faster long-term growth |
| Valuation sensitivity | Quality premium and interest rates | Growth expectations and financing conditions |
This comparison varies significantly by company. Some technology firms generate enormous cash flow, while some consumer companies struggle financially.
The October 22 session showed investors becoming more selective about how much uncertainty they would accept. Cboe also noted that the 10-year Treasury yield fell below 5% that day; lower yields make dividend-paying stocks relatively more attractive, a link explored in AI rally stress test: Nvidia earnings vs 5% yields.
Does This Mean the AI Investment Thesis Is Breaking?
One session cannot establish that conclusion.
An industry can experience strong underlying demand and still suffer a valuation correction. Returns disappoint when the stock price assumes more than the business can deliver.
For AI stocks, several questions now matter:
- How much capital is required for the next increment of revenue?
- Are customers paying enough to cover operating and depreciation costs?
- Can infrastructure remain highly utilized?
- How quickly will hardware become obsolete?
- Will competition reduce pricing before investors recover their capital?
- How much growth is already reflected in current valuations?
A company can report rising revenue while investors lower its valuation because each additional dollar of sales requires more investment than expected. Meta's revenue grew 26% in the quarter, yet its shares fell nearly 7%.
P&G's relative strength does not require AI demand to collapse. It only requires investors to assign a higher value to earnings they can assess with greater confidence.
That creates room for both sectors in a portfolio. Consumer staples can reduce dependence on a particular growth narrative, while selected technology companies can provide exposure to long-term innovation.
The investment error would be turning a useful diversification signal into a claim that all AI stocks are impaired.
What Do P&G's Cash Flows Reveal?
Cash generation helps explain why investors were willing to pay for stability.
P&G generated $5.77 billion of operating cash flow, spent $1.37 billion on capital expenditures and produced $4.40 billion of free cash flow during the quarter, 93% of net earnings (P&G's "free cash flow productivity"). It paid $2.60 billion in dividends and repurchased $1.25 billion of shares, a total of $3.85 billion. Source: P&G earnings release.
Those figures support two useful calculations:
| Calculation | Result |
|---|---|
| Quarterly free cash flow ÷ dividends | 1.69 times |
| Quarterly free cash flow ÷ dividends and buybacks | 1.14 times |
These are SimianX calculations from the company's reported figures. They suggest the quarter's cash generation covered both types of shareholder distribution.
However, investors should avoid multiplying a single quarter by four. Working capital, tax payments, inventory and capital spending vary during the year; over the last nine quarters P&G's free cash flow has ranged from $2.85 billion to $4.40 billion per quarter.
Free cash flow also has several competing uses. Dividends, repurchases, acquisitions and debt repayment all draw from the same pool. On October 1, 2026, P&G completed the $3.9 billion all-cash acquisition of Thorne, a vitamins and supplements brand that joins the Personal Health Care business. Ahead of it, cash rose to $15.37 billion at September 30 from $9.94 billion at June 30, mainly because P&G added $5.76 billion of short-term debt; debt due within one year reached $17.03 billion. Source: P&G Form 10-Q for the quarter ended September 30, 2026.
A durable dividend depends on cash generation over a full business cycle. A large buyback program is more discretionary and can be adjusted when conditions change.
For the investment thesis, the useful distinction is that P&G already produces substantial distributable cash. Shareholders do not need to wait for a new market to develop before receiving an economic return.
P&G Free Cash Flow, Dividends and Buybacks by Fiscal Year, 2019–2026
| Fiscal year (ends June 30) | Net sales | Organic sales growth | Core EPS | Operating cash flow | Capex | Free cash flow | Dividends paid | Buybacks | Dividends + buybacks as % of FCF |
|---|---|---|---|---|---|---|---|---|---|
| FY2019 | $67.68B | +5% | $4.52 | $15.24B | $3.35B | $11.90B | $7.50B | $5.00B | 105% |
| FY2020 | $70.95B | +6% | $5.12 | $17.40B | $3.07B | $14.33B | $7.79B | $7.41B | 106% |
| FY2021 | $76.12B | +6% | $5.66 | $18.37B | $2.79B | $15.58B | $8.26B | $11.01B | 124% |
| FY2022 | $80.19B | +7% | $5.81 | $16.72B | $3.16B | $13.57B | $8.77B | $10.00B | 138% |
| FY2023 | $82.01B | +7% | $5.90 | $16.85B | $3.06B | $13.79B | $9.00B | $7.35B | 119% |
| FY2024 | $84.04B | +4% | $6.59 | $19.85B | $3.32B | $16.52B | $9.31B | $5.01B | 87% |
| FY2025 | $84.28B | +2% | $6.83 | $17.82B | $3.77B | $14.04B | $9.87B | $6.50B | 117% |
| FY2026 | $87.03B | +1% | $6.89 | $19.56B | $4.41B | $15.15B | $10.23B | $5.03B | 101% |
| FY2027 guidance | +2% to +4% | +1% to +3% | $6.89–$7.11 | — | 4.5%–5.5% of sales | 85%–90% of net earnings | over $10B | about $5B | — |
Sources: P&G Form 10-K data via SEC EDGAR XBRL (sales, cash flows, dividends, buybacks); organic growth and core EPS from P&G's fourth-quarter earnings releases; FY2027 guidance from the October 22, 2026 release. Free cash flow and the last column are SimianX calculations.
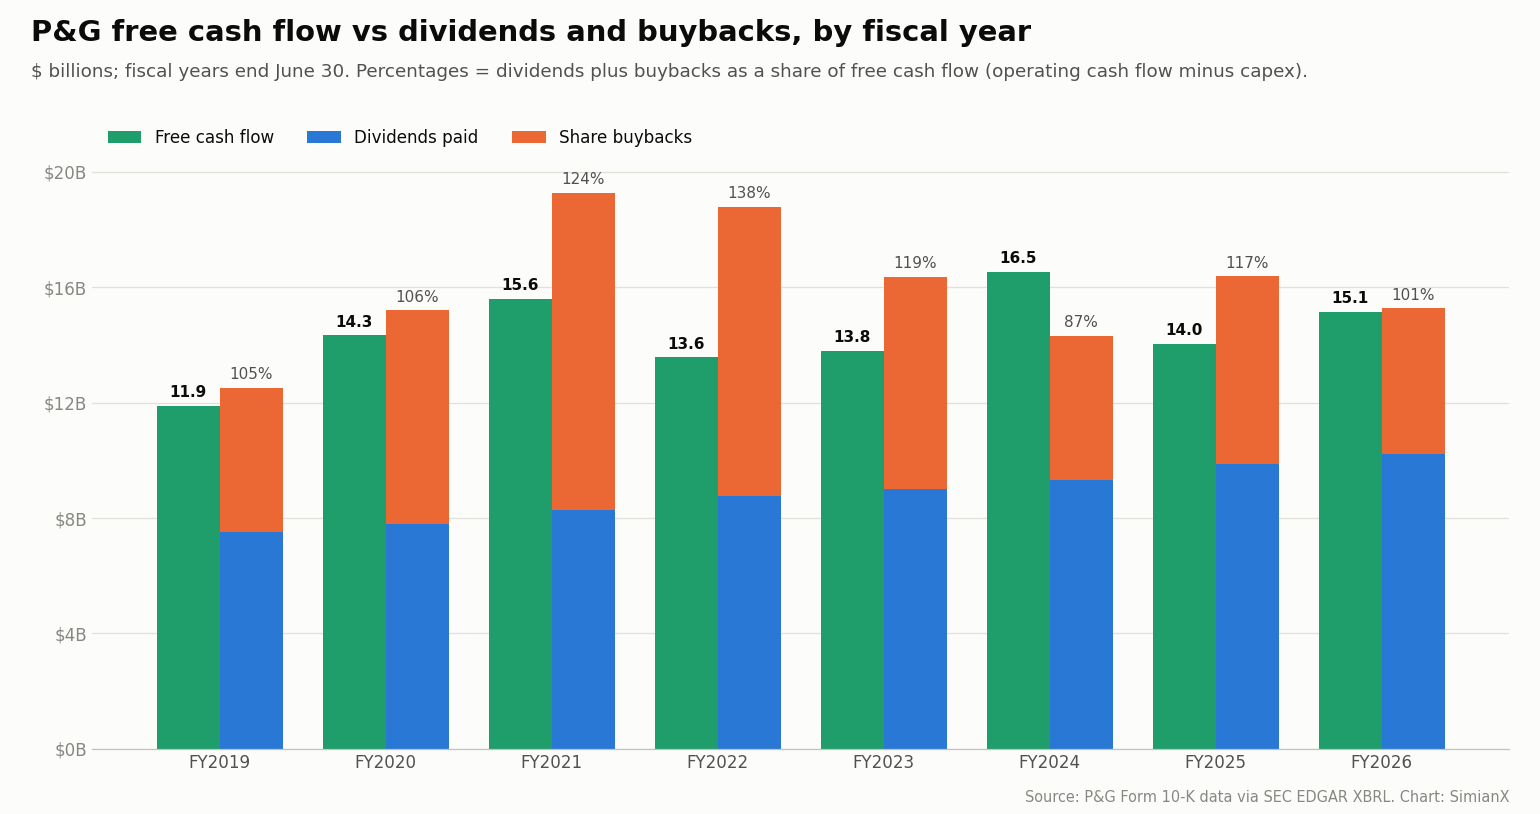
Two patterns stand out. Core EPS rose from $4.52 to $6.89 over seven years, about 6.2% a year, but only 1% in fiscal 2026 and a guided 0%–3% in fiscal 2027. And P&G has returned roughly all of its free cash flow, or more, in seven of the eight years, which is why its debt, not its cash pile, flexes when it makes an acquisition like Thorne.
Is P&G's Dividend Attractive After the Rally?
On October 13, 2026, P&G declared a quarterly dividend of $1.0885 per share, payable on or after November 16 to shareholders of record on October 23. Annualizing that quarterly rate produces $4.354 per share. The rate was raised 3.0% in the April–June 2026 quarter, from $1.0568, after a 5.0% increase a year earlier. Source: P&G dividend declaration, Form 8-K Exhibit 99 (October 13, 2026).
At $165.59, the indicated annual dividend yield is:
$4.354 ÷ $165.59 = 2.63%
At the October 23 close of $161.02 it is 2.70%. P&G says it has paid a dividend for 136 consecutive years and has increased it for 70 consecutive years. Source: P&G investor relations.
The attraction is dividend durability and potential growth, rather than an unusually high starting yield. A buyer seeking immediate income should compare that yield with available bond returns and other income-producing assets; with the 10-year Treasury yield near 5% on October 22, the dividend yield is well below the risk-free rate. An equity dividend can grow, but both the payment and the share price carry risk.
The timing also deserves attention. A stock trading without the right to its upcoming dividend normally experiences a mechanical price adjustment. Because the record date was October 23 and U.S. trades settle in one business day, October 23 was also the ex-dividend date. Investors evaluating the session after October 22 should account for that before interpreting every price change as a new signal about sentiment.
What Is the Biggest Weakness in the Bull Case?
Margins remain under pressure.
P&G's stronger demand did not eliminate inflation in raw materials, energy and transportation. The company raised its expected fiscal 2027 commodity cost headwind to approximately $1.4 billion after tax, from approximately $1 billion in its July guidance, and doubled its expected net-interest headwind:
| Fiscal 2027 headwind (after tax) | July 29, 2026 guidance | October 22, 2026 guidance |
|---|---|---|
| Commodities (raw materials, energy, transportation) | about $1.0 billion | about $1.4 billion |
| Higher net interest expense | $150 million | $300 million |
| Lower non-operating income | $150 million | $150 million |
| Unfavorable foreign exchange | $50 million | $50 million |
| Total per share | $0.56 (8% drag on core EPS growth) | $0.79 (11% drag on core EPS growth) |
Sources: P&G earnings releases of July 29, 2026 and October 22, 2026.
In the quarter, core gross margin fell 150 basis points: commodities cost 140 basis points, product reinvestments 140 and unfavorable mix 50, partly offset by 120 basis points of productivity savings, 50 from lower tariff costs and recoveries, and 20 from pricing. Core operating margin fell 80 basis points to 25.9%, despite 250 basis points of total productivity savings.
This creates an important tension. The market rewarded P&G for reliable consumer demand at a time when rising oil prices (Brent near $113 a barrel on October 22, according to Cboe) were adding pressure to the costs of producing and distributing consumer goods.
Energy affects more than the fuel used by delivery trucks. It also influences:
- Packaging materials
- Chemical inputs
- Factory operating costs
- Freight rates
- Supplier pricing
- Consumer purchasing power
P&G's brand strength gives it options, including productivity improvements, product redesign and selective price increases. Those options are constrained by competition. If households trade down to private labels, passing through higher costs becomes harder. If P&G absorbs those costs, margins suffer.
The company's defensive characteristics therefore concern the relative stability of demand. They do not guarantee stable profit margins.
Did P&G Raise Its Full-Year Outlook?
The guidance change was narrower than an enthusiastic reading of the stock move might imply.
| Fiscal 2027 guidance item | July 29, 2026 | October 22, 2026 |
|---|---|---|
| All-in net sales growth | +1% to +3% | +2% to +4% (includes Thorne from October 1) |
| Organic sales growth | +1% to +3% | +1% to +3% (unchanged) |
| Diluted (GAAP) EPS growth | +1% to +5% vs $6.62 | +1% to +5% (unchanged) |
| Core EPS | $6.89–$7.11, midpoint $7.00 | $6.89–$7.11, midpoint $7.00 (unchanged) |
| Core effective tax rate | about 20% | 20% to 21% |
| Capital spending | 4.5%–5.5% of net sales | 4.5%–5.5% of net sales |
| Free cash flow productivity | 85%–90% | 85%–90% |
| Dividends | around $10 billion | over $10 billion |
| Share repurchases | about $5 billion | about $5 billion |
Source: P&G earnings releases of July 29 and October 22, 2026, on SEC EDGAR.
The acquisition-related increase in reported sales should be distinguished from an improvement in the existing business.
Organic growth excludes acquisitions, divestitures and currency movements. It is usually the more useful measure when assessing whether underlying customer demand is accelerating.
The unchanged earnings range is also informative. Management kept the same core EPS range while absorbing $0.23 per share of additional headwinds, which implies the business itself is tracking better than it did in July. But it did not raise the range, which recognizes meaningful uncertainty for the remainder of the year.
A reasonable interpretation is that the quarter reduced downside concerns without establishing a substantially faster full-year earnings trajectory.
Why Would the Stock Rise Without an EPS Guidance Increase?
Several explanations can coexist:
- Investors had feared a guidance reduction, given the higher commodity bill.
- Stronger volume made existing targets more credible.
- The earnings beat improved near-term confidence.
- Defensive stocks became more desirable during the technology selloff.
- Investors became willing to pay a higher multiple for similar expected earnings.
That last explanation has consequences for future returns. A higher valuation can reward existing holders while making the stock less attractive for new buyers.
Is P&G Stock Expensive Near $166?
Using the October 22 close and management's $7.00 core EPS midpoint gives:
$165.59 ÷ $7.00 = 23.7 times guided core earnings
On the previous day's close of $156.84 the same multiple was 22.4 times; on fiscal 2026 core EPS of $6.89 it is 24.0 times. This calculation uses company guidance, rather than a separate analyst-consensus forecast. With 2,317.8 million shares outstanding at September 30, the October 22 close values P&G at about $384 billion.
At that multiple, P&G is priced as a high-quality business. Investors are paying for brand strength, recurring demand, distribution scale and reliable cash generation. For comparison, State Street lists the price/earnings ratio of the consumer staples fund's holdings at 26.9 as of October 22. Source: State Street XLP fund page.
They are also accepting a relatively modest earnings yield:
$7.00 ÷ $165.59 = 4.23%
The earnings yield is not a promised return. Earnings can grow or decline, and only part of them is paid out.
The following table shows how sensitive the stock's value is to the multiple investors assign to the same earnings:
| Illustrative P/E | Value using $7.00 EPS |
|---|---|
| 20 times | $140 |
| 22 times | $154 |
| 24 times | $168 |
| 26 times | $182 |
These are valuation illustrations, not analyst targets.
At roughly $166, a large portion of the near-term case already rests on investors continuing to pay a premium for reliability.
If earnings remain stable but the multiple falls, the shares can decline even while the business performs acceptably.
Can a Defensive Stock Still Deliver Poor Returns?
Yes. Reliable operations and attractive investment returns depend on different variables.
Consider an illustrative three-year investment:
- Starting price: approximately $166
- Starting EPS: $7.00
- Annual EPS growth: 4%
- EPS after three years: approximately $7.87
At a terminal multiple of 24 times, the resulting price would be about $189. At 20 times, it would be about $157.
The company grows earnings in both cases. The shareholder experiences very different price returns because the valuation changes.
Dividends would add to total returns, but they would not eliminate the effect of multiple compression.
This is particularly relevant after a strong earnings-day rally. A defensive stock can become crowded precisely when investors feel least comfortable owning other assets.
The discipline is to estimate a plausible range of business outcomes, assign reasonable valuations and compare the resulting returns with alternatives.
Does P&G's Rally Prove Consumers Are Healthy?
It provides encouraging evidence about selected categories and brands.
It does not establish that every household or consumer sector is strong.
Consumers may continue purchasing trusted detergent while reducing spending on restaurants, furniture or electronics. They may also buy premium products in one category while choosing store brands in another. Retailer signals, covered in Walmart & Target 2026: decoding US consumer stress signals, are a necessary cross-check.
Several factors complicate the interpretation:
- Retailer inventory changes can affect shipments.
- Promotional activity can lift volume.
- Product launches can create temporary gains.
- Wealthier households can support premium categories while lower-income consumers remain under pressure.
- Market-share gains can benefit one company even when the overall category grows slowly.
P&G's results are best read as evidence that its product portfolio and execution remained resilient.
To assess the broader consumer, investors should compare household-product trends with retailer commentary, real disposable income, employment and credit conditions.
A single large company is a valuable data point. It is still only one part of the consumer economy.
Are All Consumer Staples Equally Defensive?
The sector includes businesses with very different economics.
| Business type | Principal advantage | Main vulnerability |
|---|---|---|
| Household products | Frequent purchases and established brands | Input costs and private-label competition |
| Beverages | Brand loyalty and distribution scale | Changing tastes and packaging costs |
| Packaged foods | Recurring demand | Weak volume and retailer bargaining power |
| Staples retailers | Traffic and value positioning | Thin margins and labor costs |
| Tobacco | Pricing and cash generation | Regulation and declining volumes |
An investor purchasing a sector fund is buying a combination of these exposures.
For example, State Street's Consumer Staples Select Sector SPDR ETF (XLP) held 34 stocks on October 22, 2026. Its largest weights were Walmart (10.88%), Costco (9.11%), Procter & Gamble (7.76%), Coca-Cola (7.44%), Philip Morris International (6.34%), Altria (4.56%) and Colgate-Palmolive (4.50%). Its behavior therefore depends on much more than P&G's results. Source: State Street fund page.
A diversified fund can reduce company-specific risk, but it does not remove valuation risk or guarantee that every holding has strong organic growth.
P&G is a relatively focused choice for investors who want exposure to branded household and personal-care products. A sector fund may be more suitable when the objective is broad diversification away from technology.
How Can Investors Tell Whether This Rotation Will Last?
A durable change in leadership requires more than one strong session. The sector-level signals are covered in our S&P 500 sector rotation playbook.
The following signals would provide better evidence:
- Persistent relative strength: Consumer staples outperform over several weeks, including days when technology recovers.
- Earnings upgrades: Analysts raise forward profit estimates rather than simply assigning higher multiples.
- Broader participation: Leadership spreads across several businesses and categories.
- Stable demand: Volume remains positive without increasingly expensive promotions.
- Margin improvement: Productivity begins to overcome input-cost pressure.
- Fund-flow confirmation: Sector inflows support the interpretation suggested by prices.
- More selective AI investment: The market differentiates companies by cash returns instead of selling every AI-related stock together.
If staples rise while their earnings estimates remain unchanged, the move is primarily a valuation shift. That can continue for some time, but it has limits.
If volume, margins and profit forecasts improve together, the case becomes more durable.
Readers using SimianX AI can apply this distinction when questioning an investment thesis: which part of the expected return comes from business growth, which part comes from dividends, and which part requires other investors to pay more?
SimianX's description of its research process emphasizes examining competing arguments. That approach is useful here because the bullish demand evidence and cautious valuation evidence are both material.
What Are the Bull, Base and Bear Cases for PG?
The following scenarios illustrate how earnings and valuation could interact. They are not forecasts or trading recommendations.
| Scenario | Illustrative EPS | Illustrative P/E | Implied price | Main assumption |
|---|---|---|---|---|
| Bear | $6.60 | 20 times | $132 | Costs or weak demand undermine expectations |
| Base | $7.00 | 23 times | $161 | Guidance holds and the quality premium remains |
| Bull | $7.40 | 25 times | $185 | Better demand and margins support higher earnings |
Dividends are excluded, and no specific realization date is assumed.
The table highlights a challenge for buyers after the rally. The base illustration produces little price upside from $165.59, while the bull case requires improved earnings and a sustained premium valuation.
The bearish scenario does not require a collapse in household demand. A modest earnings disappointment combined with a lower multiple would be sufficient.
That does not make P&G unattractive for every investor. Someone reducing an excessive technology allocation may value its diversification benefits. Someone seeking high absolute returns from a new position may require a lower entry price or stronger evidence of profit acceleration.
Should Investors Chase the 5.6% Rally?
The case is stronger for patient portfolio diversification than for chasing a single-session move.
Existing shareholders received useful confirmation that demand was more resilient than expected. For new investors, the higher price reduces the margin for error.
A practical decision process is:
- Identify the portfolio need. Decide whether the objective is income, lower technology concentration or capital growth.
- Set a required return. Estimate what earnings growth and dividends could reasonably provide.
- Stress the valuation. Test returns at a lower terminal multiple.
- Review demand quality. Follow volume, promotions and market share together.
- Watch cash coverage. Assess dividends and repurchases against full-year free cash flow.
- Choose position size accordingly. Allow for the possibility that a defensive stock can still fall materially.
A staged purchase can reduce dependence on one earnings-day price. Waiting for another quarter may also be reasonable when the investment case depends on margin recovery.
There is no need to interpret the choice as selling all technology and buying all staples. The more useful response is to balance exposure to long-term growth with businesses whose returns are easier to evaluate today.
FAQ: Why P&G Stock Jumped and What Comes Next
Why did P&G stock rise 5.6% on October 22, 2026?
P&G reported fiscal first-quarter 2027 core EPS of $2.00 against a $1.89 consensus, 4% organic sales growth and 2.4% volume growth, and kept its full-year EPS guidance despite higher commodity costs. The same day, Meta's negative free cash flow and capex plan drove investors out of AI stocks and into defensive businesses.
What were P&G's fiscal Q1 2027 results?
For July–September 2026, P&G reported net sales of $23.28 billion (+4%), organic sales growth of 4%, diluted EPS of $1.97, core EPS of $2.00 (+1%), operating cash flow of $5.77 billion and free cash flow of $4.40 billion. It returned $3.85 billion through dividends and buybacks.
Are consumer staples a safe investment during a technology selloff?
Consumer staples often have more stable demand, which can help diversify technology exposure. Their shares can still decline because of high valuations, input inflation, competition or changing consumer behavior. On October 23, the day after the rally, most staples fell about 2% to 3.5%.
Is P&G stock cheap after its latest earnings report?
At the October 22 closing price, PG traded at approximately 23.7 times management's fiscal 2027 core EPS midpoint of $7.00, up from 22.4 times a day earlier. That reflects a substantial quality premium, so attractive returns depend on earnings execution and the valuation investors continue to assign.
What is P&G's dividend yield?
The quarterly dividend is $1.0885 per share, or $4.354 a year, a yield of 2.63% at $165.59 and 2.70% at the October 23 close of $161.02. P&G has raised its dividend for 70 consecutive years.
Does P&G's performance mean the AI boom is over?
The evidence supports renewed concern about financing costs, capital spending and returns on AI investment. It does not establish that AI demand has collapsed or that every company connected to AI faces the same outlook.
What should PG investors monitor over the next few quarters?
The most useful indicators are organic volume, promotional intensity, input costs, margins and free cash flow, plus how Thorne and the extra short-term debt affect earnings. Sustained improvements across those measures would support the rally more convincingly than another short burst of defensive buying.
Conclusion: Consumer Staples Earned Attention, but Price Still Matters
P&G stole the spotlight because it delivered tangible demand evidence at a moment when investors were questioning the economics of enormous AI investments.
Its volume recovery made the earnings beat more persuasive. Its cash generation supported shareholder distributions. The wider advance in household and beverage stocks showed that investors were reconsidering portfolio balance.
The limitations remain clear: core EPS grew 1%, the commodity bill rose by $400 million, margins shrank and the stock's valuation increased sharply in one day.
P&G's report strengthened the case for owning a durable consumer business. The rally made the entry price more demanding.
For investors, the next step is to evaluate whether improving operating results can justify that premium over several quarters. Follow volume, margins and cash returns alongside the share price.
Explore SimianX AI to examine the competing investment arguments and build a research framework that accounts for both business resilience and valuation.
How this page is updated: the quarterly tables use P&G's earnings releases (Form 8-K, Exhibit 99.1) and the annual table uses Form 10-K data from SEC EDGAR XBRL. Both will be refreshed after P&G's fiscal second-quarter 2027 report, expected in late January 2027. Prices are regular-session closes. This page is analysis, not investment advice.
Related Reading
- Meta Capex by Quarter: Q3 2026 Hit $34.9B, FCF Went Negative
- AI Capex 2026: Big Tech Now Spends 96% of Its Cash Flow
- Tesla Free Cash Flow by Year: Q3 2026's $1.5B vs AI Capex
- Walmart & Target 2026: Decoding US Consumer Stress Signals
- The S&P 500 Sector Rotation Playbook for AI Signals
- Global Bond Selloff 2026: 30-Year Yields at 19-Year Highs
- AI Rally Stress Test: Nvidia Earnings vs 5% Yields 2026
- Is Jensen Huang Fueling an AI Bubble? Nvidia’s Boom Examined
- AI Stocks Pull Back: OpenAI Doubts Hit Big-Tech Earnings
- AI Stock Analysis Rebuilt: An 8-Agent Committee You Can Ask
- More analysis in the AI & markets topic hub
References
- SEC EDGAR — P&G fiscal 2027 first-quarter results, Form 8-K Exhibit 99.1 (October 22, 2026)
- SEC EDGAR — P&G Form 10-Q for the quarter ended September 30, 2026
- SEC EDGAR — P&G fourth-quarter and fiscal 2026 results with FY2027 guidance (July 29, 2026)
- SEC EDGAR — P&G quarterly dividend declaration (October 13, 2026)
- SEC EDGAR — P&G XBRL company facts (annual cash-flow data)
- SEC EDGAR — P&G filing index (8-K)
- SEC EDGAR — Meta third-quarter 2026 results, Form 8-K Exhibit 99.1 (October 21, 2026)
- P&G — Investor relations: quarterly dividend and dividend history (October 13, 2026)
- P&G — Investor relations: fiscal 2027 first-quarter results
- Cboe — Tech sell-off leads to uptick in defensive stocks (October 22, 2026)
- Nasdaq — PG historical prices
- Nasdaq — PG earnings and consensus surprise history
- CNBC — S&P 500 index quote
- State Street — Consumer Staples Select Sector SPDR ETF (XLP) holdings and characteristics
- Investopedia — Organic growth
- Investopedia — Free cash flow (FCF)
- Investopedia — Ex-dividend date