
 By Marcus Reeve
BIST 100 Annual Returns in Turkish Lira, US Dollars and After Inflation, 1991–2026
Updated October 23, 2026, with Borsa Istanbul closes through October 23, 2026. The 2026 row is refreshed every month; the full table is finalized after the last trading day of December.
Short answer: From 1991 to 2025 the BIST 100 rose in 25 of 35 calendar years in Turkish lira, with an average annual return of +59.1% and a median of +31.6%. Compounded, that is +34.8% a year in lira, but only +2.5% a year in US dollars and +1.1% a year after Turkish inflation. In dollar terms the median year was −4.7%. Best year: 1999 (+485% in lira, +240% in dollars). Worst: 2008 (−51.6% in lira, −63.2% in dollars). 2026 through October 23: −1.3% in lira, −14.7% in dollars and −20.6% after inflation, at 11,116.99.
This page lists BIST 100 returns by year for every calendar year from 1991 to 2025, plus 2026 to date, in three currencies of measurement: the lira return everyone quotes, the return in US dollars (dollar-based), and the real return after Turkish consumer-price inflation. The last two matter because lira returns are inflated: the dollar cost 0.002930 lira at the end of 1990 and 42.8457 lira at the end of 2025, and consumer prices rose 23,456x over the same 35 years. A 30% gain in a year of 40% inflation is a loss. Each row also gives the year-end close, the year-end exchange rate, the inflation rate and the S&P 500's return, and every year-end close was checked against at least two independent sources. For the US benchmark on its own, see our S&P 500 returns by year table.
How this page is updated
- Every month: the 2026 row (close, year-to-date return in lira, dollars and real terms, the Central Bank of the Republic of Türkiye exchange rate, the latest inflation figure and the S&P 500 comparison), the answer box, the chart and the "2026 so far" section are refreshed after the last trading day of the month, and also after any session in which the BIST 100 closes 5% or more higher or lower.
- Every January: after Borsa Istanbul's last session of December and the December inflation release, the 2026 row becomes a full year and every average, median, compound rate and "last 10 years" window moves forward by one year.
- Corrections: a historical close changes only if Borsa Istanbul's own data disagree with the daily data used here. Every check made so far is listed under the main table.
BIST 100 historical returns at a glance
| Measure | 1991–2025 | 2001–2025 | 2006–2025 | 2016–2025 | 2021–2025 |
|---|---|---|---|---|---|
| In lira | |||||
| Up years | 25 / 35 | 18 / 25 | 14 / 20 | 9 / 10 | 5 / 5 |
| Average | +59.1% | +29.0% | +26.6% | +39.4% | +60.8% |
| Median | +31.6% | +26.4% | +25.6% | +27.4% | +31.6% |
| Compound annual | +34.8% | +21.1% | +18.2% | +31.7% | +50.1% |
| Best year | +485% (1999) | +197% (2022) | +197% (2022) | +197% (2022) | +197% (2022) |
| Worst year | −51.6% (2008) | −51.6% (2008) | −51.6% (2008) | −20.9% (2018) | +14.6% (2025) |
| In US dollars | |||||
| Up years | 17 / 35 | 13 / 25 | 10 / 20 | 5 / 10 | 2 / 5 |
| Average | +18.9% | +12.8% | +8.8% | +7.1% | +14.3% |
| Median | −4.7% | +3.3% | −1.2% | −1.2% | −5.7% |
| Compound annual | +2.5% | +2.5% | −0.6% | +0.7% | +5.7% |
| Best year | +240% (1999) | +111% (2022) | +111% (2022) | +111% (2022) | +111% (2022) |
| Worst year | −63.2% (2008) | −63.2% (2008) | −63.2% (2008) | −43.5% (2018) | −30.0% (2021) |
| After inflation (real) | |||||
| Up years | 17 / 35 | 13 / 25 | 10 / 20 | 5 / 10 | 1 / 5 |
| Average | +14.5% | +7.2% | +5.6% | +5.7% | +6.8% |
| Median | −7.6% | +0.4% | −3.6% | −3.6% | −8.9% |
| Compound annual | +1.1% | +1.3% | −0.1% | +1.9% | +1.8% |
| Best year | +247% (1999) | +84.6% (2009) | +84.6% (2009) | +80.5% (2022) | +80.5% (2022) |
| Worst year | −56.1% (2008) | −56.1% (2008) | −56.1% (2008) | −34.2% (2018) | −17.7% (2023) |
| S&P 500 (US$) | |||||
| Up years | 26 / 35 | 18 / 25 | 15 / 20 | 8 / 10 | 4 / 5 |
| Average | +10.5% | +8.4% | +10.4% | +13.9% | +14.3% |
| Median | +13.4% | +12.8% | +13.5% | +17.9% | +23.3% |
| Compound annual | +9.0% | +6.8% | +8.9% | +12.8% | +12.8% |
| Best year | +34.1% (1995) | +29.6% (2013) | +29.6% (2013) | +28.9% (2019) | +26.9% (2021) |
| Worst year | −38.5% (2008) | −38.5% (2008) | −38.5% (2008) | −19.4% (2022) | −19.4% (2022) |
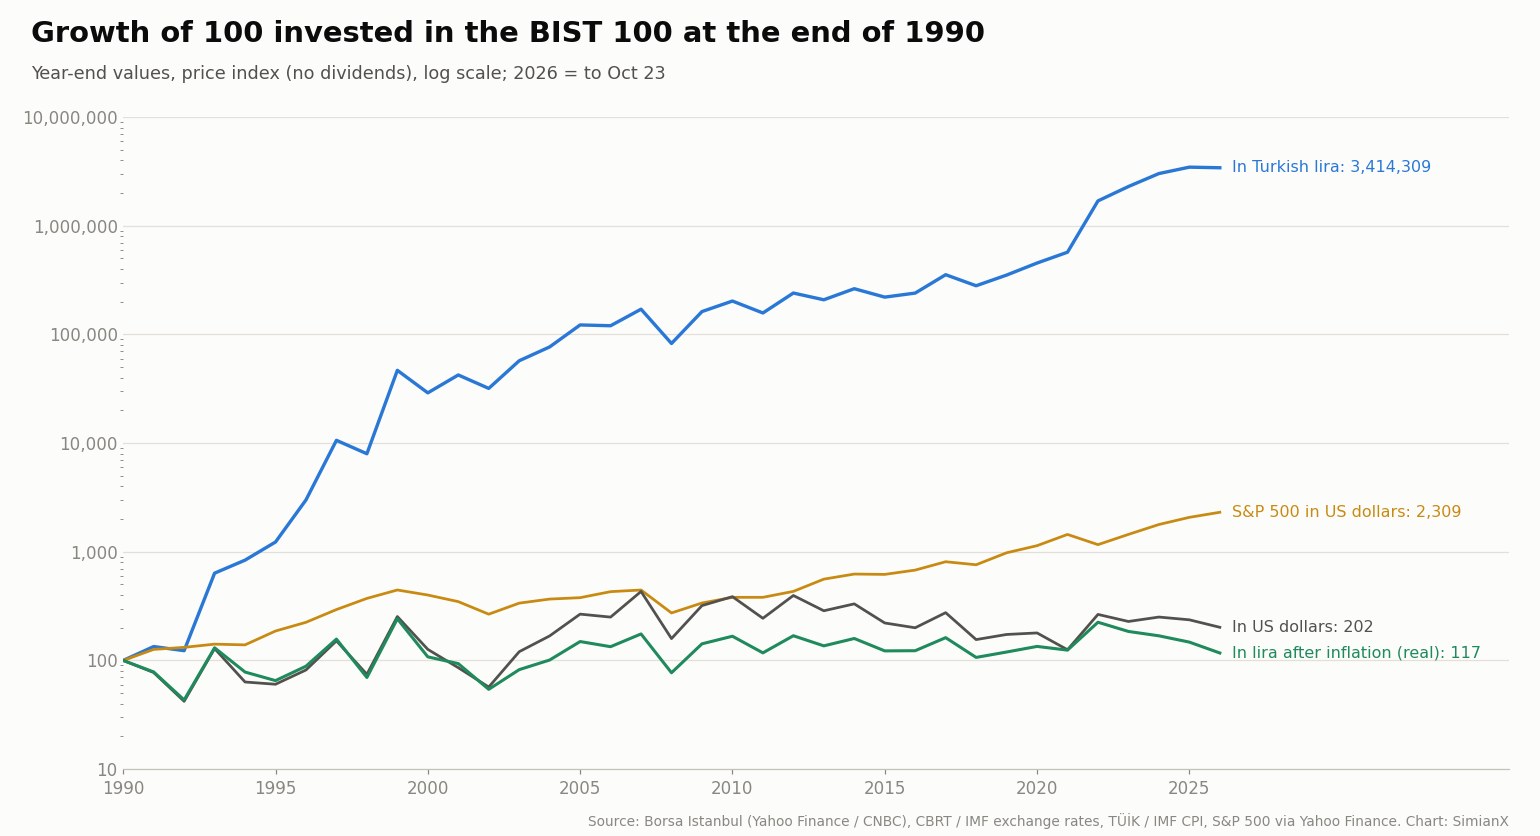
The three blocks tell three different stories. In lira the BIST 100 looks like one of the best-performing stock indices in the world, compounding +34.8% a year since 1991. In dollars the same index compounded +2.5% a year, and in real terms +1.1%: almost all of the lira gain was inflation and currency depreciation. The median year shows it even more clearly. In lira it was +31.6%; in dollars it was −4.7% and after inflation −7.6%, because a handful of enormous years (1993, 1996, 1997, 1999, 2009 and 2022) carry the averages.
Over the last 20 years (2006–2025) the gap is starker: +18.2% a year in lira, −0.6% in dollars and −0.1% after inflation. Over the same period the S&P 500 returned +8.9% a year in dollars, without dividends.
BIST 100 returns by year: the complete table, 1991–2026
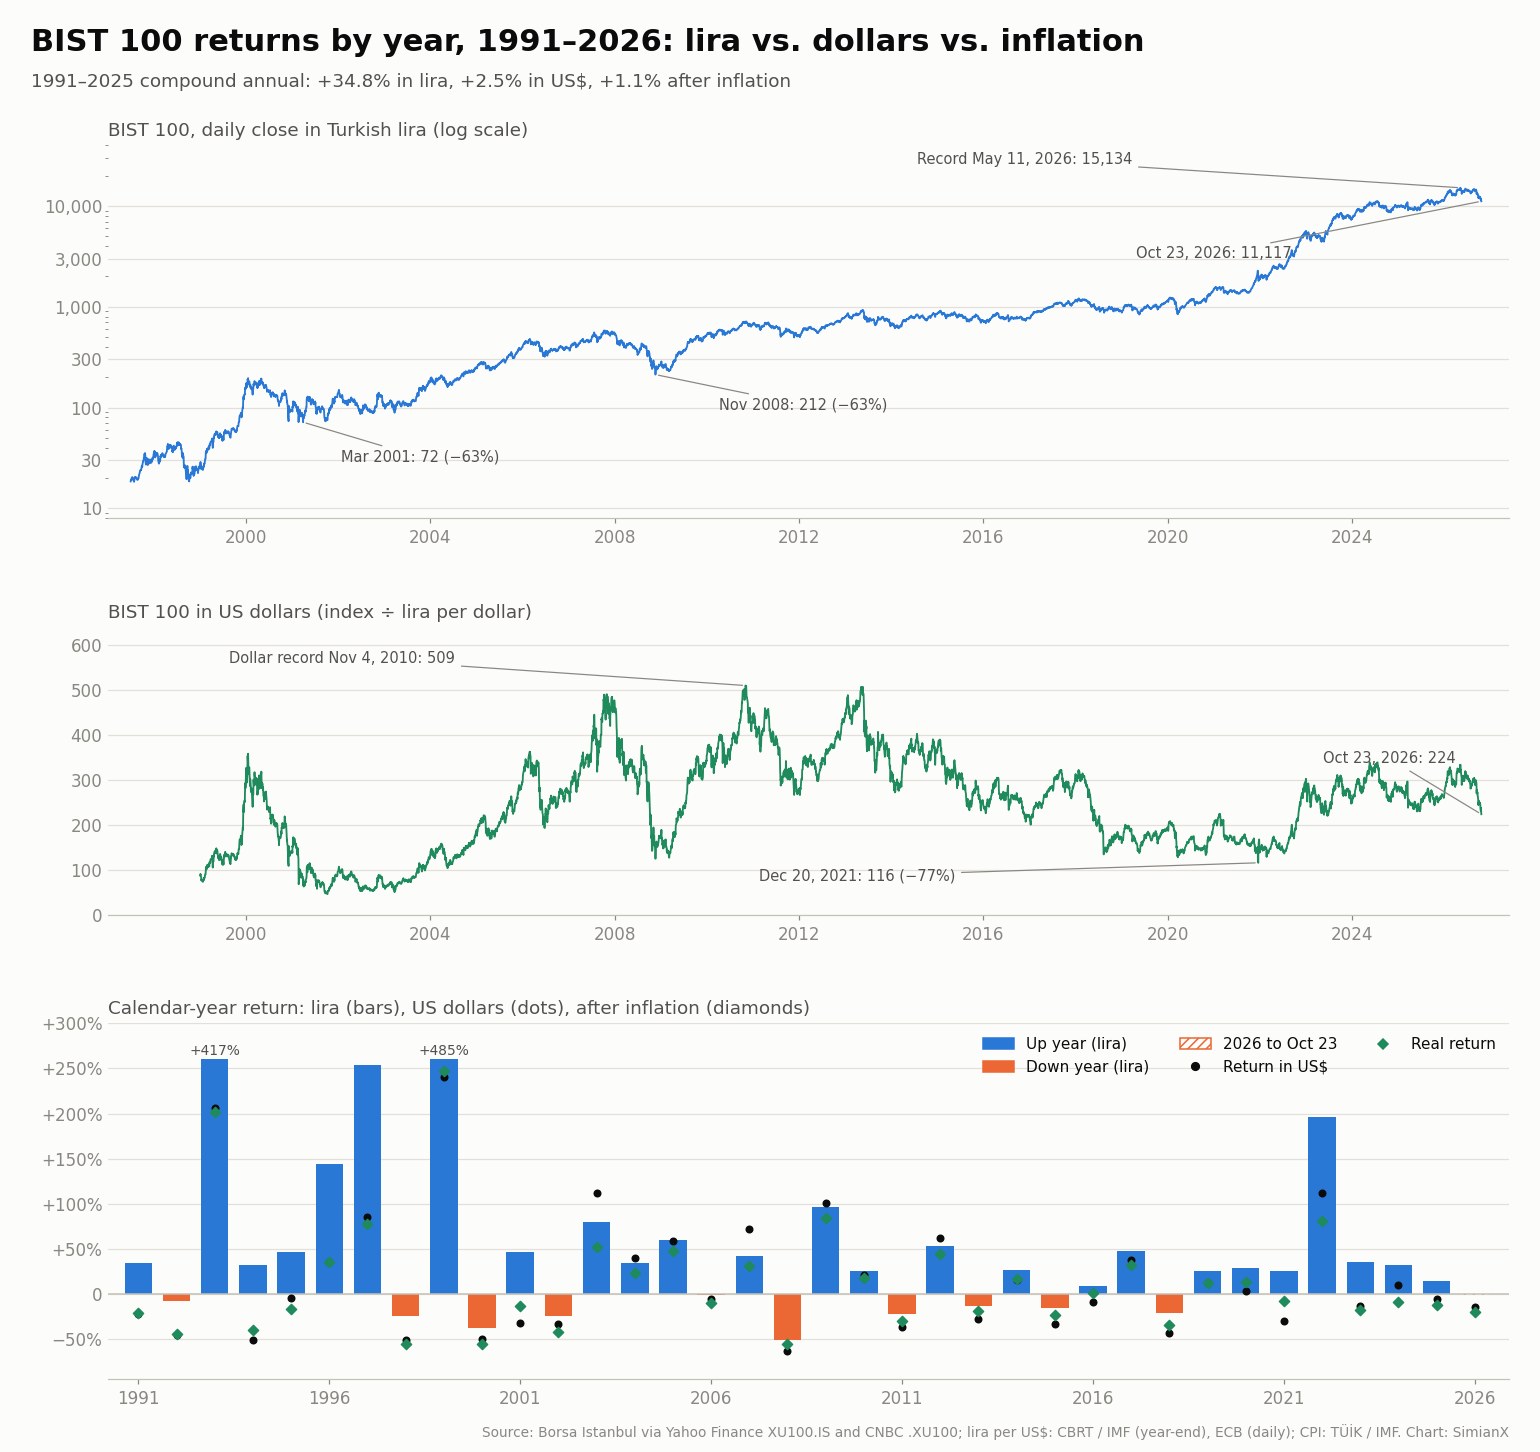
Newest first. Down years in the lira, dollar and real columns are in bold. The year-end close is the closing level of the last trading day of each year on today's index scale (see "The index scale" below for the 1996 and 2020 redenominations). The dollar return converts the index at the year-end exchange rate; the real return deflates the lira return by December-to-December consumer-price inflation; the S&P 500 column is its price return in dollars, without dividends, so it is comparable with the BIST 100, which is also a price index.
| Year | Year-end close | Return (lira) | Lira per US$ | Return in US$ | Inflation (CPI) | Real return | S&P 500 (US$) |
|---|---|---|---|---|---|---|---|
| 2026 (to Oct 23) | 11,116.99 | −1.3% | 49.5647 | −14.7% | 24.3% | −20.6% | +11.4% |
| 2025 | 11,261.52 | +14.6% | 42.8457 | −5.7% | 30.9% | −12.5% | +16.4% |
| 2024 | 9,830.56 | +31.6% | 35.2803 | +9.8% | 44.4% | −8.9% | +23.3% |
| 2023 | 7,470.18 | +35.6% | 29.4382 | −13.9% | 64.8% | −17.7% | +24.2% |
| 2022 | 5,509.16 | +197% | 18.6983 | +111% | 64.3% | +80.5% | −19.4% |
| 2021 | 1,857.65 | +25.8% | 13.3290 | −30.0% | 36.1% | −7.6% | +26.9% |
| 2020 | 1,476.72 | +29.1% | 7.4194 | +3.3% | 14.6% | +12.6% | +16.3% |
| 2019 | 1,144.25 | +25.4% | 5.9400 | +11.5% | 11.8% | +12.1% | +28.9% |
| 2018 | 912.70 | −20.9% | 5.2810 | −43.5% | 20.3% | −34.2% | −6.2% |
| 2017 | 1,153.33 | +47.6% | 3.7719 | +37.7% | 11.9% | +31.9% | +19.4% |
| 2016 | 781.39 | +8.9% | 3.5192 | −9.7% | 8.5% | +0.4% | +9.5% |
| 2015 | 717.27 | −16.3% | 2.9181 | −33.3% | 8.8% | −23.1% | −0.7% |
| 2014 | 857.21 | +26.4% | 2.3269 | +15.8% | 8.2% | +16.9% | +11.4% |
| 2013 | 678.02 | −13.3% | 2.1304 | −27.7% | 7.4% | −19.3% | +29.6% |
| 2012 | 782.08 | +52.6% | 1.7776 | +62.1% | 6.2% | +43.7% | +13.4% |
| 2011 | 512.67 | −22.3% | 1.8889 | −36.8% | 10.4% | −29.7% | −0.003% |
| 2010 | 660.04 | +24.9% | 1.5376 | +20.9% | 6.4% | +17.4% | +12.8% |
| 2009 | 528.25 | +96.6% | 1.4873 | +101% | 6.5% | +84.6% | +23.5% |
| 2008 | 268.64 | −51.6% | 1.5218 | −63.2% | 10.1% | −56.1% | −38.5% |
| 2007 | 555.38 | +42.0% | 1.1593 | +72.1% | 8.4% | +31.0% | +3.5% |
| 2006 | 391.17 | −1.7% | 1.4056 | −6.1% | 9.7% | −10.3% | +13.6% |
| 2005 | 397.78 | +59.3% | 1.3418 | +58.6% | 7.7% | +47.9% | +3.0% |
| 2004 | 249.72 | +34.1% | 1.3363 | +39.8% | 9.3% | +22.6% | +9.0% |
| 2003 | 186.25 | +79.6% | 1.3933 | +111% | 18.4% | +51.8% | +26.4% |
| 2002 | 103.70 | −24.8% | 1.6397 | −33.6% | 29.7% | −42.0% | −23.4% |
| 2001 | 137.83 | +46.0% | 1.4466 | −32.2% | 68.5% | −13.3% | −13.0% |
| 2000 | 94.37 | −37.9% | 0.6718 | −50.1% | 39.0% | −55.4% | −10.1% |
| 1999 | 152.09 | +485% | 0.5401 | +240% | 68.8% | +247% | +19.5% |
| 1998 | 25.98 | −24.7% | 0.3137 | −50.8% | 69.7% | −55.6% | +26.7% |
| 1997 | 34.51 | +254% | 0.2051 | +85.3% | 99.1% | +77.6% | +31.0% |
| 1996 | 9.7589 | +144% | 0.1075 | +35.3% | 79.8% | +35.6% | +20.3% |
| 1995 | 4.0025 | +46.8% | 0.05965 | −4.7% | 76.0% | −16.6% | +34.1% |
| 1994 | 2.7257 | +31.8% | 0.03873 | −50.8% | 120% | −40.2% | −1.5% |
| 1993 | 2.0683 | +417% | 0.01447 | +206% | 71.1% | +202% | +7.1% |
| 1992 | 0.4004 | −8.4% | 0.008564 | −45.6% | 66.0% | −44.8% | +4.5% |
| 1991 | 0.4369 | +34.2% | 0.005080 | −22.6% | 71.1% | −21.6% | +26.3% |
| 1990 (base) | 0.3256 | — | 0.002930 | — | — | — | — |
Notes: from 1997 the daily closes are from Yahoo Finance (XU100.IS) and CNBC (.XU100), which agree on every year-end from 1997 to 2025 (CNBC shows 2014 on the old scale, 85,721.13, and carries stray weekend values before 1993, both corrected here); the October 23 close of 11,116.99 is from Borsa Istanbul's own daily index file. The 1990–1996 year-end closes are from CNBC and match the Wikipedia table of BIST 100 annual values to two decimals; the 1990 and 1996 closes also match the values in the exchange's index methodology (32.56 on December 31, 1990, and 976 on December 27, 1996, on the 1986 = 1 scale used from 1997 to 2020). Exchange rates are lira per US dollar at year-end: the Central Bank of the Republic of Türkiye (CBRT) indicative buying rate from 1996, the IMF end-of-period rate before that, the same series as in our US dollar exchange rate table; all rates are in today's lira (one lira since 2005 = 1,000,000 old lira). Inflation is the December-to-December change in TÜİK's consumer price index; for 1991–1994 it is the IMF/OECD chained index, which shows 1994 at 120% instead of TÜİK's headline 125.5%, and 2003 uses TÜİK's 1994-based index (18.4%) because the IMF/OECD series switches base that year. The 2026 inflation figure covers December 2025 to September 2026, the latest release.
BIST 100 in dollar terms: how it is calculated and where it stands
To get the dollar-based BIST 100 (in Turkish, dolar bazında BIST 100), divide the index by the lira price of one dollar on the same day. At the end of 2025 that was 11,261.52 ÷ 42.8457 = 262.8; at the end of 2024, 9,830.56 ÷ 35.2803 = 278.6. The dollar return for 2025 is the change between the two: −5.7%, while the index gained 14.6% in lira. Borsa Istanbul also publishes an official dollar version of the index (BIST 100 USD), but on a different base, so its level is not comparable with these numbers.
Measured this way, the BIST 100's dollar record is still the close of November 4, 2010, at 509.3 (on European Central Bank daily rates). From there it fell 77.3% to 115.7 on December 20, 2021, during the lira crash of late 2021. On October 23 it stood at 223.5, 56.1% below the 2010 record, although the lira index is 15.7 times higher than it was on the same day. In lira the BIST 100 set a new record in 2026; in dollars it has not done so since 2010.
| Dollar peak (index ÷ USD/TRY) | Dollar low | Decline in US$ | Back above the peak |
|---|---|---|---|
| 509.3 (November 4, 2010) | 115.7 (December 20, 2021) | −77.3% | not yet |
| 490.0 (October 31, 2007) | 124.7 (November 20, 2008) | −74.6% | October 12, 2010 |
| 362.4 (February 27, 2006) | 192.9 (June 26, 2006) | −46.8% | July 2, 2007 |
| 357.9 (January 18, 2000) | 46.0 (October 8, 2001) | −87.1% | February 27, 2006 |
The dollar column also shows how often a lira gain hid a dollar loss. In 8 of the 35 years from 1991 to 2025 the index rose in lira and fell in dollars, most recently in 2025 (+14.6% in lira, −5.7% in dollars), 2023 (+35.6% and −13.9%) and 2021 (+25.8% and −30.0%). In total the index lost value in dollars in 18 of the 35 years.
BIST 100 real returns after inflation
The real column answers a simpler question: did the BIST 100 beat Turkish inflation? From 1991 to 2025 it did in 17 of 35 years, and over the whole period its real return compounded at +1.1% a year, while consumer prices rose 33.3% a year.
The record of the last three years is a good example. The index gained 35.6% in 2023, 31.6% in 2024 and 14.6% in 2025, but inflation was 64.8%, 44.4% and 30.9%, so the real returns were −17.7%, −8.9% and −12.5%: three losing years in a row in real terms while the lira index rose every year. The opposite happened in 2022, when inflation reached 64.3% and the index still rose 197%, a real gain of +80.5%, as savers moved into stocks to escape negative real interest rates.
BIST 100 returns over the last 10, 5 and 20 years
The questions people search most are "what did the BIST 100 return over 10 years, five years, one year?" Here is the answer in all three measures.
| Measure | Last 10 years (2016–2025) | Last 5 years (2021–2025) | Last 20 years (2006–2025) |
|---|---|---|---|
| Start → end (close) | 717.27 → 11,261.52 | 1,476.72 → 11,261.52 | 397.78 → 11,261.52 |
| Total change (lira) | +1,470% | +663% | +2,731% |
| Compound annual (lira) | +31.7% | +50.1% | +18.2% |
| Up years (lira) | 9 of 10 | 5 of 5 | 14 of 20 |
| Compound annual (US$) | +0.7% | +5.7% | −0.6% |
| Up years (US$) | 5 of 10 | 2 of 5 | 10 of 20 |
| Compound annual (real) | +1.9% | +1.8% | −0.1% |
| Inflation, compound annual | 29.3% | 47.4% | 18.3% |
| S&P 500, compound annual (US$) | +12.8% | +12.8% | +8.9% |
From the end of 2015 (717.27) to the end of 2025 (11,261.52) the BIST 100 rose 1,470% in lira, or +31.7% a year, and rose in 9 of those 10 years. In dollars the 10-year rate was +0.7% a year and after inflation +1.9%; the S&P 500 returned +12.8% a year in dollars over the same decade. Over the last 12 months, from October 23, 2025 to October 23, 2026, the index changed +4.8% in lira and −11.3% in dollars.
BIST 100 returns by decade
| Period | Lira, compound annual | US$, compound annual | Real, compound annual | Inflation, compound annual | S&P 500 (US$) | Up years (lira) |
|---|---|---|---|---|---|---|
| 1991–1999 | +98.0% | +10.9% | +10.3% | 79.5% | +18.0% | 7 of 9 |
| 2000s | +13.3% | +2.3% | −5.2% | 19.4% | −2.7% | 6 of 10 |
| 2010s | +8.0% | −5.9% | −1.7% | 9.9% | +11.2% | 6 of 10 |
| 2020–2025 | +46.4% | +5.3% | +3.6% | 41.4% | +13.3% | 6 of 6 |
| 1991–2025 (all years) | +34.8% | +2.5% | +1.1% | 33.3% | +9.0% | 25 of 35 |
The 1990s were the decade of extreme numbers: the index compounded +98.0% a year in lira, yet only +10.9% in dollars, because the lira lost most of its value every few years. In the 2010s the index lost money in dollars (−5.9% a year) and in real terms (−1.7%), while the S&P 500 compounded +11.2%. The 2020s so far have been the strongest real decade since the 1990s (+3.6% a year), almost all of it from 2022.
The best and worst years for the BIST 100
| Rank | Best (lira) | Best (US$) | Best (real) | Worst (lira) | Worst (US$) | Worst (real) |
|---|---|---|---|---|---|---|
| 1 | 1999: +485% | 1999: +240% | 1999: +247% | 2008: −51.6% | 2008: −63.2% | 2008: −56.1% |
| 2 | 1993: +417% | 1993: +206% | 1993: +202% | 2000: −37.9% | 1998: −50.8% | 1998: −55.6% |
| 3 | 1997: +254% | 2022: +111% | 2009: +84.6% | 2002: −24.8% | 1994: −50.8% | 2000: −55.4% |
| 4 | 2022: +197% | 2003: +111% | 2022: +80.5% | 1998: −24.7% | 2000: −50.1% | 1992: −44.8% |
| 5 | 1996: +144% | 2009: +101% | 1997: +77.6% | 2011: −22.3% | 1992: −45.6% | 2002: −42.0% |
Best years. The biggest gain in lira came in 1999 (+485%, from 25.98 to 152.09), when an IMF-backed disinflation programme and Turkey's acceptance as an EU candidate in December lifted the market; it was also the best year in dollars (+240%). 1993 (+417%), 1997 (+254%), 2022 (+197%) and 1996 (+144%) follow. In real terms 2009 (+84.6%) ranks third, because inflation that year was only 6.5%.
Worst years. 2008 (−51.6%) was the worst year in all three measures: −63.2% in dollars and −56.1% after inflation. 2000 (−37.9%) ended with the November banking crisis that led into the 2001 Turkish economic crisis; in 2001 the index still rose 46.0% in lira, but fell 32.2% in dollars as the lira was floated in February and lost more than half its value. 1998 (−24.7%) was the year of the Russian default, and 2018 (−20.9%; −43.5% in dollars) the year of the Turkish currency and debt crisis.
How often does the BIST 100 fall?
In lira the BIST 100 finished 10 of 35 calendar years lower from 1991 to 2025, and it has never fallen two years in a row. In dollars it fell in 18 of the 35 years, and three years running once, from 2000 to 2002. The longest winning streak in lira is the current one: seven years, from 2019 to 2025, when the index rose from 912.70 to 11,261.52. In dollars only four of those seven years were gains.
Every BIST 100 crash of 30% or more since 1997
A crash here is measured from a record close to the lowest close before the index set a new record, in lira, using the sessions where both daily sources agree. With inflation this high, a 20% fall is routine, so the threshold is 30%.
| Peak (close) | Low (close) | Decline | Back above the peak | Peak to recovery |
|---|---|---|---|---|
| 1,235.56 (January 21, 2020) | 842.46 (March 23, 2020) | −31.8% | November 10, 2020 | 9 months |
| 1,208.45 (January 29, 2018) | 836.75 (May 22, 2019) | −30.8% | January 14, 2020 | 1 yr 11 mo |
| 931.79 (May 22, 2013) | 611.89 (March 3, 2014) | −34.3% | April 24, 2017 | 3 yr 11 mo |
| 715.43 (November 9, 2010) | 496.22 (November 24, 2011) | −30.6% | October 30, 2012 | 1 yr 11 mo |
| 580.53 (October 11, 2007) | 212.28 (November 20, 2008) | −63.4% | April 2, 2010 | 2 yr 5 mo |
| 477.29 (February 27, 2006) | 319.51 (June 26, 2006) | −33.1% | April 25, 2007 | 1 yr 1 mo |
| 195.77 (January 18, 2000) | 71.60 (March 29, 2001) | −63.4% | January 5, 2004 | 3 yr 11 mo |
| 45.31 (July 16, 1998) | 18.52 (October 8, 1998) | −59.1% | March 26, 1999 | 8 months |
Three crashes stand apart: 1998 (−59.1%), 2000–2001 (−63.4%), after which the index needed almost four years to regain its January 2000 record, and 2007–2008 (−63.4%). The 1998 fall and the 2020 COVID-19 fall (−31.8%) were the quickest to recover, in under 10 months each. The current decline, from the record 15,133.50 on May 11, 2026 to 11,116.99 on October 23, 2026 (−26.5%), is not yet on the list.
BIST 100 vs. the S&P 500
In lira the BIST 100 beats almost anything; in dollars, the comparison with the S&P 500 is the honest one. From 1991 to 2025 the S&P 500's price return compounded +9.0% a year in dollars, against +2.5% for the BIST 100 in dollars. The BIST 100 beat the S&P 500 in dollar terms in 14 of the 35 years, but its losing years were much larger: in 2008 the BIST 100 lost 63.2% in dollars and the S&P 500 38.5%. Over the last 10 years the S&P 500 won by 12.2 points a year. For a Turkish investor, the S&P 500 return in lira is usually far higher than its dollar return; the year-by-year S&P 500 return in lira is in the Turkish version of our S&P 500 table. Other emerging-market comparisons on the same basis: KOSPI returns by year and Nifty 50 and Sensex returns by year. For other assets measured in lira, see the Turkish versions of our gold price by year (lira per gram) and Bitcoin returns by year (in lira) tables.
2026 so far
Through October 23, 2026 the BIST 100 stood at 11,116.99, down 1.3% from its 2025 close of 11,261.52, and that was its lowest close of the year. In dollars the loss was 14.7%, because the lira weakened against the dollar to 49.5647 (CBRT), 15.7% more lira per dollar than at the end of 2025. Consumer prices rose 24.3% from December 2025 to September, so the real return so far is −20.6%. Over the same period the S&P 500 gained 11.4%.
The year started strongly: the index set a record close of 15,133.50 on May 11, 2026, 34.4% above the end of 2025. On May 21, 2026 it fell 6.05%, to 13,163.90, after an appeals court annulled the 2023 congress of the main opposition party, the CHP; the market-wide circuit breaker halted trading before the close, as Bigpara reported from Borsa Istanbul's announcement. The index was back at 14,334.10 at the end of August, then fell 5.54% on September 16, 2026 and kept falling through September and October. If the year ended today, 2026 would be the BIST 100's first lira loss since 2018 and its worst dollar year since 2021. Live AI analysis of individual stocks is available in SimianX, and every SimianX market-history page is listed on the market history topic hub.
The index scale: why old BIST 100 values look 100 or 10,000 times bigger
The BIST 100 (formerly the ISE National-100) started in January 1986 with a base of 100. Borsa Istanbul has removed two zeros from it twice. On December 27, 1996, all values up to that date were divided by 100, so the 1986 base became 1. On July 27, 2020, the exchange did it again, so the 1986 base is now 0.01 and every older value is divided by 100. This page uses today's scale throughout: the 2014 close of 85,721.13, as it was reported at the time, appears here as 857.21, and the 2019 close of 114,424.96 as 1,144.25. Because the whole history was rescaled, the returns are unchanged. The lira's own redenomination in January 2005, when one new lira replaced 1,000,000 old lira, did not change the index either; the exchange rates on this page are all stated in today's lira.
Before 1991: the first years of the index
The index was launched in January 1986, when the Istanbul Stock Exchange began trading. Its first years are not tabulated here: the only daily source available starts in January 1988, and the first year-end that two independent sources agree on is 1990. The year-end 1990 close of 0.3256 (32.56 on the 1986 = 1 scale used from 1997 to 2020) is therefore the base for every return on this page.
How to read BIST 100 returns
- Always ask which currency. From 1991 to 2025 the index compounded +34.8% a year in lira, +2.5% in dollars and +1.1% after inflation. All three are correct; they answer different questions.
- The median beats the average. A few huge years lift the lira average (+59.1%) far above the median (+31.6%). In dollars the median year was a loss (−4.7%).
- The start date changes everything. The last 10 years compounded +0.7% a year in dollars; the last 20, −0.6%; the full period, +2.5%.
- These are price returns. The BIST 100 does not include dividends. Borsa Istanbul's BIST 100 return index (getiri endeksi) adds them back, so an index fund earns the dividend yield on top, before fees and taxes.
- A lira gain below inflation is a loss. In 8 of the 35 years the index rose in lira but fell in real terms.
Frequently asked questions
What is the BIST 100's average annual return?
From 1991 to 2025 the average calendar-year return was +59.1% in lira and the median +31.6%. Compounded, the index grew +34.8% a year in lira (from 0.3256 to 11,261.52), +2.5% a year in US dollars and +1.1% a year after inflation.
What is the BIST 100's return in dollar terms?
+2.5% a year from 1991 to 2025, −0.6% a year over the last 20 years and +0.7% over the last 10. In 2026 to October 23 it is −14.7%. The index's dollar record, 509.3 on November 4, 2010, has not been beaten.
How is the dollar-based BIST 100 calculated?
Divide the index by the lira price of one US dollar on the same day: 11,261.52 ÷ 42.8457 = 262.8 at the end of 2025. The dollar return for a year is the percentage change in that number from one year-end to the next.
What was the BIST 100's return over the last 10 years?
From the end of 2015 to the end of 2025 it rose 1,470% in lira (+31.7% a year), but only +0.7% a year in dollars and +1.9% a year after inflation. Over the last five years (2021–2025): +50.1% a year in lira, +5.7% in dollars, +1.8% after inflation.
What were the BIST 100's best and worst years?
Best: 1999 (+485%), then 1993 (+417%) and 1997 (+254%). Worst: 2008 (−51.6%), then 2000 (−37.9%) and 2002 (−24.8%). In dollars, 2008 was also the worst (−63.2%) and 1999 the best (+240%).
Has the BIST 100 beaten inflation?
Narrowly, over the long run: a real return of +1.1% a year from 1991 to 2025, with 17 of 35 years ahead of inflation. Over the last 20 years it roughly matched inflation (−0.1% a year).
What is the BIST 100's return in 2026 so far?
−1.3% in lira through October 23, 2026 (11,116.99 against 11,261.52 at the end of 2025), −14.7% in dollars and −20.6% after inflation. The record close is 15,133.50 on May 11, 2026.
What was the BIST 100 at the end of each year?
781.39 (2016), 1,153.33 (2017), 912.70 (2018), 1,144.25 (2019), 1,476.72 (2020), 1,857.65 (2021), 5,509.16 (2022), 7,470.18 (2023), 9,830.56 (2024) and 11,261.52 (2025), on today's scale. Every year back to 1990 is in the table above.
Methodology and sources
- BIST 100 closes are daily closing levels from Yahoo Finance (XU100.IS, from July 1997) and CNBC (.XU100, from 1988), the latest close from Borsa Istanbul's daily index file, and the pre-1997 year-ends checked against Wikipedia and the exchange's index methodology. Returns are price returns from the last close of one year to the last close of the next. Crashes use only the 7,316 sessions since 1997 where the two daily sources agree within 0.5%.
- Exchange rates are the Central Bank of the Republic of Türkiye indicative US dollar buying rate on the last business day of each year from 1996 and on October 23 for 2026, and the IMF end-of-period rate before 1996. The dollar record and the dollar crashes use European Central Bank daily reference rates, which start in 1999.
- Inflation is the December-to-December change in the consumer price index of TÜİK (Turkish Statistical Institute), as listed by the CBRT from 2005, TÜİK's 1994-based index for 1995–2004, and the IMF/OECD index on FRED for 1991–1994. Real return = (1 + lira return) ÷ (1 + inflation) − 1.
- S&P 500 returns are price returns from Yahoo Finance (^GSPC), checked against CNBC (.SPX), the same series as our S&P 500 table.
- Data compiled October 23, 2026. This page is for information only and is not investment advice.
Related Reading
- S&P 500 Returns by Year: Every Year 1928–2026 Table
- US Dollar Rate History by Year: 14 Currencies Since 1971
- Gold Price by Year: Every Year 1971–2026 With Returns Table
- Bitcoin Returns by Year: Every Year 2011–2026 Table
- KOSPI Returns by Year: Every Year 1982–2026 (Table)
- Nifty 50 & Sensex Returns Year Wise: Every Year 1980–2026
- IHSG Returns by Year: Jakarta Composite Every Year 1991–2026
- Nasdaq Returns by Year: Every Year 1972–2026 Table
- How Long Every Bear Market Took to Recover: 1929-2022
- Market history: all SimianX reference pages
References
- Borsa Istanbul — index data and BIST 100
- Yahoo Finance — BIST 100 (XU100.IS) historical data
- Central Bank of the Republic of Türkiye — indicative exchange rates
- CBRT — consumer prices (TÜİK data)
- TÜİK — Turkish Statistical Institute
- FRED — consumer price index for Türkiye (OECD)
- European Central Bank — euro reference exchange rates
- Wikipedia — BIST 100
- Wikipedia — 2001 Turkish economic crisis
- Wikipedia — 2018 Turkish currency and debt crisis